
Sample Category Title
AUD/USD Candlesticks and Ichimoku Analysis
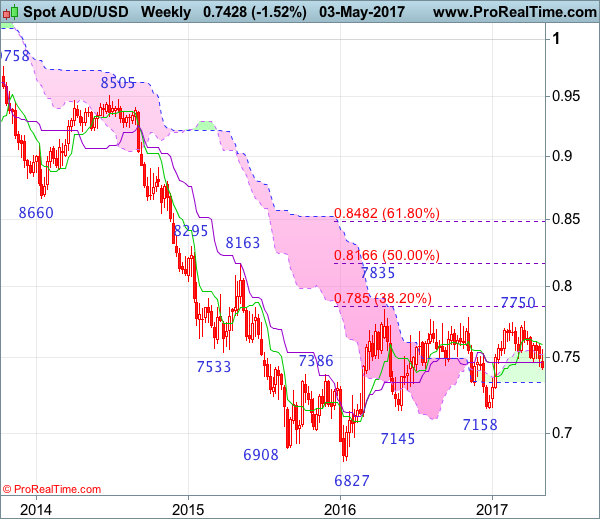
Weekly
• Last Candlesticks pattern: Shooting doji
• Time of formation: 20 Feb 2017
• Trend bias: Sideways
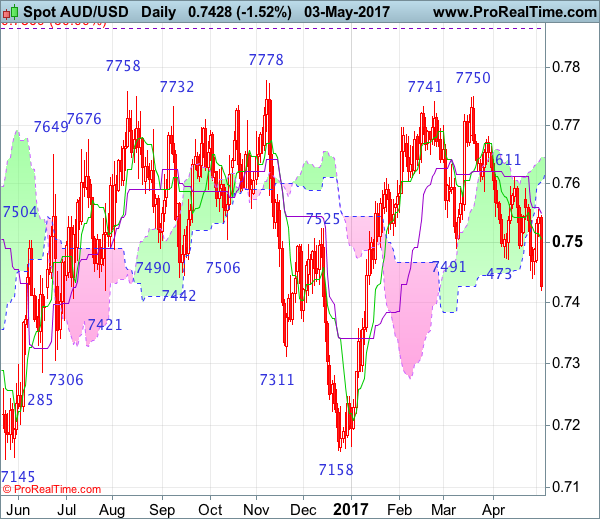
Daily
• Last Candlesticks pattern: Bearish engulfing pattern
• Time of formation: 21 Mar 2017
• Trend bias: Near term down
Although aussie recovered initially this week, renewed selling interest emerged at 0.7556 and the pair has fallen again, adding credence to our bearish view for the decline from 0.7750 to bring at least a strong retracement of the rise from 0.7158, hence further weakness to 0.7380-85 (61.8% Fibonacci retracement of 0.7158-0.7750), then towards 0.7300-10, however, near term oversold condition should prevent sharp fall below 0.7250-60 and price should stay well above support at 0.7158.
On the upside, expect recovery to be limited to 0.7440 and the Tenkan-Sen (now at 0.7493) should remain intact, bring another decline to aforesaid downside targets. Above the Kijun-Sen (now at 0.7537) would risk test of said resistance at 0.7556 but a daily close above there is needed to signal low is formed instead, risk a stronger rebound to resistance at 0.7592 and possibly test of the upper Kumo (now at 0.7645) but resistance at 0.7680 should cap upside.
Recommendation: Hold short entered at 0.7570 for 0.7390 with stop above 0.7495.
On the weekly chart, as aussie met renewed selling interest at 0.7556 earlier this week and has slipped again, another black candlestick looks set to be formed this week, retaining our bearish view that the rebound from 0.7158 has ended at 0.7750, bearishness remains for the fall from there to extend further decline to 0.7380-85 (61.8% Fibonacci retracement of 0.7158-0.7750), however, reckon downside would be limited to 0.7290-00 and 0.7230 would hold from here, bring rebound later.
On the upside, although initial recovery to 0.7440-50 cannot be ruled out, reckon 0.7495-00 would hold and bring another decline. Above 0.7556 (this week’s high) would defer and risk test of the Tenkan-Sen (now at 0.7572) but price should falter below resistance at 0.7611, bring another decline later. Only break of 0.7611 would abort and suggest low is formed instead, bring further gain towards resistance at 0.7680 but a sustained breach above this level is needed to signal the retreat from 0.7750 has ended, bring another bounce towards this level.
AUDUSD Trading Sharply Lower Today, Setbacks May Occur!
The USD is seen slightly higher against the EUR and GBP, and much more higher against commodity currencies, NZD and AUD in particular after the Federal Reserve's hawkish policy statement. Stocks are seen in bullish mode still, while gold fell sharply lower towards 1230 area. So as long this will be the case, we think that commodity currencies will stay under pressure and even extend weakness if 10 year US notes will break lower based on the Elliott Wave structure.
Our focus today is on AUDUSD where pair shows a bearish price action with an aggressive sell of from 0.75448 that looks like an extended wave 3. Fourth wave bounce may be seen in the near-term that can stop at one of resistance levels before weakness extends even lower in wave 1).
AUDUSD, 1H
How Will Non-Farm Payroll Affect June Rate Hike ?
The FOMC kept rates on hold on Wednesday which was in line with market expectations. The FOMC stated that the weak Q1 GDD is transitory and business investment firmed. The FOMC left the door open to a June rate hike in the statement.
Per the CME's FedWatch tool, the probability for a June rate hike has increased to 69.1%. The dollar index broke through a significant resistance level at 99.00 taking market to a 2-week high of 99.33. During early European session on Thursday. USD/JPY hit the highest level of 112.88 not seen since March 20.
The strengthening of USD weighed on gold prices with spot gold hitting the lowest level of 1232.92 not seen since March 21.
The crucial US labour market data for April will be released this Friday May 5, at 13:30 BST. It includes non-farm payrolls, unemployment rate and average hourly earnings. Please note that the release of US labour market data will likely cause volatility for USD, USD crosses and commodities.
Although the non-farm payrolls in March was disappointing seeing the slowest growth of 98K (a number not seen since March of last year). The unemployment rate in March of 4.5% was another figure not seen since May 2007. US unemployment has seen a downtrend since 2010 and has stabilised in a range between 4.6% – 5% since early 2016. Wages continue to show an upswing from early 2015. The Fed sees the labour market as close to full employment with Employers having to raise wages to attract workers in a tightening job market.
The ADP employment change released yesterday, regarded as the prediction of NFP, dropped to 177K in April from 255K in March, marking the slowest growth this year. The slowdown in April was mainly caused by declines in job creation in the construction and retail sectors. Conversely, the service and business service sectors saw noticeable job gains.
The average revised figure of non-farm payrolls in the past 6 months has been around 192K which is not far from the 180K estimate for April. The recent US economic data has been weak, such as the non-farm payroll in March, the Q1 GDP and auto sales etc. Therefore, If the upcoming non-farm payrolls is in line with or above 180K, accompanied by an upward revised previous figure, and a stable unemployment rate. then it will likely boost market confidence on the US economy and the probability for a rate hike in June.
Conversely, if the upcoming non-farm payrolls is far below expectations, accompanied by a downward revised previous figure, and a rising unemployment rate. Then it will likely increase market concerns on the economic slowdown and put more stress on the Fed to raise rates in June.
Be aware that, based on prior experience, market trends sometimes reverse within 1-2 hours after the initial move.
Fed Chair Yellen will make a speech at 18:30 BST on Friday at Brown University. The markets will be attentive to any comments she makes about the US economy.
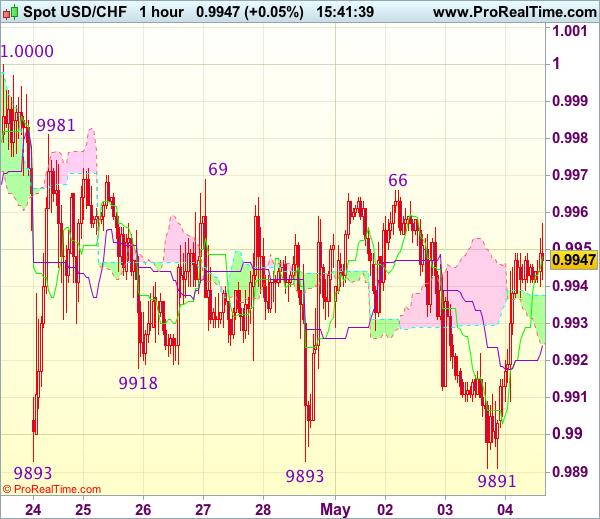
Trade Idea : USD/CHF – Stand aside
USD/CHF - 0.9929
Most recent candlesticks pattern : N/A
Trend : Near term down
Tenkan-Sen level : 0.9942
Kijun-Sen level : 0.9924
Ichimoku cloud top : 0.9938
Ichimoku cloud bottom : 0.9925
New strategy :
Stand aside
Position : -
Target : -
Stop : -
Despite yesterday’s brief fall to 0.9891, lack of follow through selling on break of previous support at 0.9893 and the subsequent rebound has retained our view that further consolidation is in store and test of 0.9966-69 resistance cannot be ruled out, however, a break of 0.9981 is needed to signal low is formed, bring a stronger rebound to 1.0000-08 resistance, above there would confirm a temporary low has been formed at 0.9891, bring retracement of recent decline to 1.0020-30 (61.8% Fibonacci retracement of 1.0108-0.9891) but price should falter well below resistance at 1.0067.
On the downside, below 0.9905-10 would bring retest of 0.9891 but break there is needed to confirm recent decline from 1.0108 top has resumed and extend weakness to 0.9865-70 (2 times extension of 1.0108-1.0008 measuring from 1.0067), however, support at 0.9831 would hold from here, bring rebound later. As near term outlook is still mixed, would be prudent to stand aside for now.
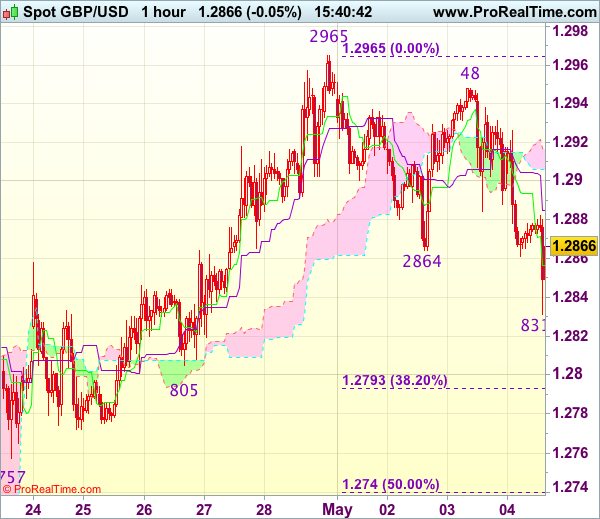
Trade Idea : GBP/USD – Buy at 1.2790
GBP/USD - 1.2877
Most recent candlesticks pattern : N/A
Trend : Near term up
Tenkan-Sen level : 1.2860
Kijun-Sen level : 1.2885
Ichimoku cloud top : 1.2911
Ichimoku cloud bottom : 1.2906
Original strategy :
Buy at 1.2790, Target: 1.2910, Stop: 1.2755
Position : -
Target : -
Stop : -
New strategy :
Buy at 1.2790, Target: 1.2910, Stop: 1.2755
Position : -
Target : -
Stop : -
Although cable has rebounded after intra-day brief fall to 1.2831, reckon upside would be limited to 1.2910-15 and near term downside risk remains for the corrective fall from 1.2965 to bring retracement of recent upmove, below said support at 1.2831 would extend weakness to 1.2790-95 (38.2% Fibonacci retracement of 1.2515-1.2965) where renewed buying interest should emerge, bring another rise later. Above 1.2948 would bring retest of 1.2965, break there would confirm upmove has resumed for headway towards 1.2990-00 (1.236 times projection of 1.2109-1.2616 measuring from 1.2365 and psychological resistance).
In view of this, would not chase this rise here and would be prudent to buy cable on further subsequent pullback as downside should be limited to 1.2790-95. A drop below previous support at 1.2757 would abort and signal top is formed instead, bring correction to 1.2740 (50% Fibonacci retracement of 1.2515-1.2965) first.
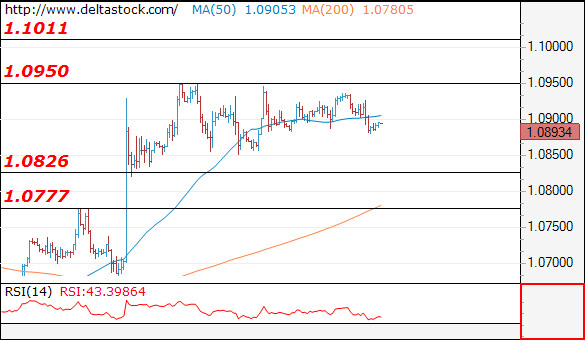
Technical Outlook: EURUSD – No Significant Changes After Fed, Focus Turns On US NFP And French Election
The Euro was weaker after Fed on Wednesday and ended trading in red but remains within 1.0850/1.0950 congestion that extends into eight straight day. Fed's statement did not bring anything significantly new, being in a rather familiar tone and pointing that interest rate increases will be gradual in 2017. Fed pointed to the labor sector which continues to strengthen, while inflation continues to run near 2% target. Markets understood Fed's tone as hawkish and subsequent dollar's rally came as a result of rising expectations of rate hike in June. However, the single currency was not seriously impacted by stronger dollar, remaining in directionless mode and awaiting further signals from two coming events, US Non-Farm Payrolls due on Friday and the final round of French presidential election on Friday. From the technical point of view, situation remains unchanged compared to few previous sessions. Rising 10 SMA (1.0877) is so far holding today's action, which moved within narrow range in Asia and guarding key 200SMA support (1.0831). Violation of the latter is needed to generate stronger negative signal, while extension below 1.0800 zone (Fibo 38.2% of 1.0568/1.0949 / base of 4-hr cloud) would confirm reversal. Otherwise, near-term focus will remain shifted higher while 10SMA holds with break above 1.0950 pivot to open way for 1.1000+ extension.
Res: 1.0900, 1.0935, 1.0950, 1.1000
Sup: 1.0873, 1.0850, 1.0831, 1.0800
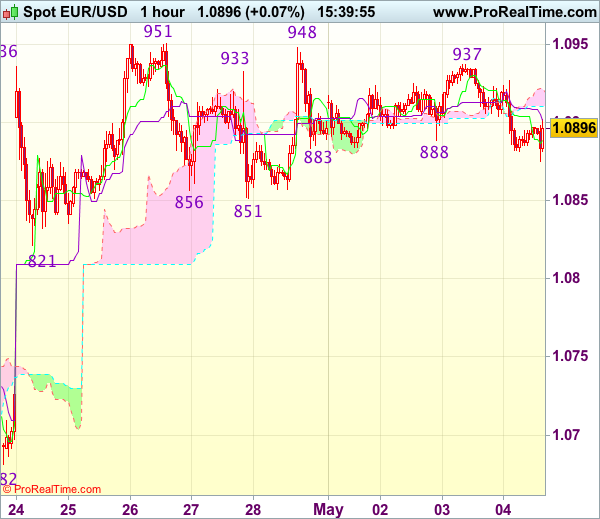
Trade Idea : EUR/USD – Buy at 1.0900
EUR/USD - 1.0916
Most recent candlesticks pattern : N/A
Trend : Near term up
Tenkan-Sen level : 1.0897
Kijun-Sen level : 1.0901
Ichimoku cloud top : 1.0920
Ichimoku cloud bottom : 1.0911
New strategy :
Buy at 1.0900, Target: 1.1000, Stop: 1.0870
Position : -
Target : -
Stop : -
Although the single currency fell briefly to 1.0875, lack of follow through selling and current rebound suggest consolidation with upside bias would be seen and test of indicated resistance at 1.0951 (last week’s high) would be seen, however, break there is needed to signal recent upmove from 1.0340 low has resumed for headway to 1.0975-80 and possibly towards 1.1000 but price should falter below 1.1025 (50% projection of 1.0602-1.0951 measuring from 1.0851).
In view of this, we are looking to buy euro on dips. Below intra-day support at 1.0875 would prolong consolidation below said resistance at 1.0951, bring correction towards support at 1.0851 but price should stay above 1.0821 support, bring another rise later.
Forex Technical Analysis: EUR/USD, USD/JPY, GBP/USD
EUR/USD
Current level - 10893
The intraday bias is negative, for a slide towards 1.0826 support and a break through the latter will challenge 1.0770 area. Key resistance is still projected at 1.0950.
| Resistance | Support | ||
| intraday | intraweek | intraday | intraweek |
| 1.0950 | 1.0950 | 1.0826 | 1.0780 |
| 1.1010 | 1.1010 | 1.0780 | 1.0676 |
USD/JPY
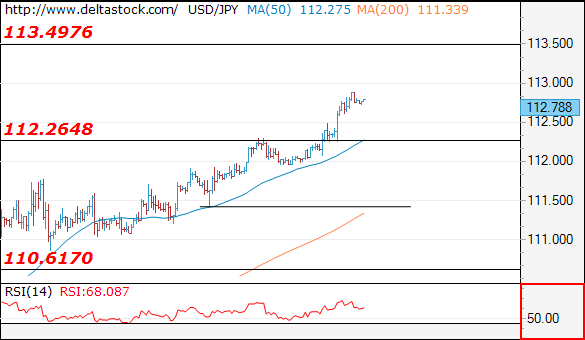
Current level - 112.78
The pair has reached the dynamic resistance at 112.90, but there are no signs of a reversal yet, so the outlook remains positive, for a rise towards 113.50 zone. Key support lies at 112.26.
| Resistance | Support | ||
| intraday | intraweek | intraday | intraweek |
| 112.90 | 113.50 | 112.26 | 109.40 |
| 113.50 | 115.60 | 110.40 | 108.12 |
GBP/USD
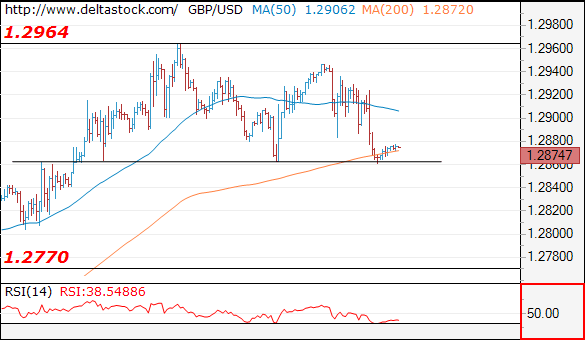
Current level - 1.2874
The intraday bias here is bearish, for a break through 1.2860 hurdle, towards 1.2770 support zone. Crucial on the upside is 1.2965 peak.
| Resistance | Support | ||
| intraday | intraweek | intraday | intraweek |
| 1.2965 | 1.3120 | 1.2860 | 1.2610 |
| 1.3000 | 1.3500 | 1.2770 | 1.2510 |
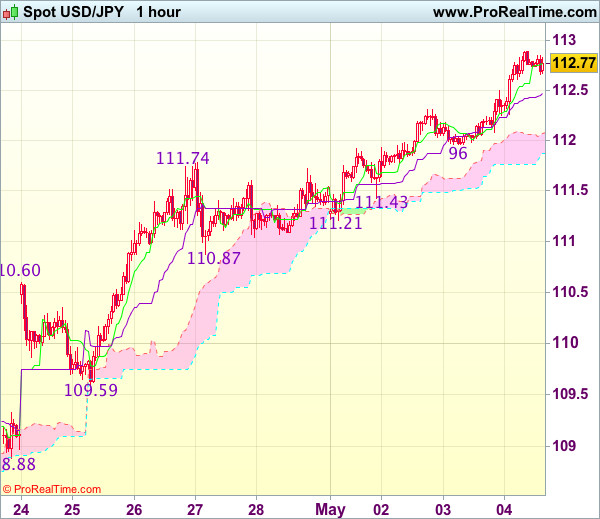
Trade Idea : USD/JPY – Buy at 112.00
USD/JPY - 112.75
Most recent candlesticks pattern : N/A
Trend : Near term up
Tenkan-Sen level : 112.78
Kijun-Sen level : 112.47
Ichimoku cloud top : 112.07
Ichimoku cloud bottom : 111.87
Original strategy :
Buy at 111.25, Target: 112.55, Stop: 110.90
Position : -
Target : -
Stop : -
New strategy :
Buy at 112.00, Target: 113.00, Stop: 111.65
Position : -
Target : -
Stop : -
As the greenback has surged again after finding renewed buying interest at 111.96 yesterday, adding credence to our view that recent upmove is still in progress and bullishness remains for further subsequent gain to 113.10-15 (61.8% projection of 108.13-111.78 measuring from 110.87) but near term overbought condition should limit upside to previous resistance at 113.54 and reckon 113.75-80 (76.4% retracement of 115.51-108.13) would hold, risk from there has increased for a retreat to take place later.
In view of this, would not chase this rise here and would be prudent to buy dollar on subsequent pullback as said support at 111.96 should limit downside and bring another rise later. Below previous resistance at 111.78 would abort and suggest a temporary top is formed instead, bring correction to 111.43, then 111.21 support.
Dollar Bulls Return On Confident Fed
The U.S. dollar and Treasury yields across the curve bounced higher after the Fed signaled that a June rate hike is still on the way. Monetary policy-makers acknowledged that there is some softness in the economy, but seemed confident that recent economic slowdown is likely to be temporary. Otherwise there wereno surprises in the statement.
The positive tone struck by the Fed was slightly surprising, especially asconsumer consumption, inflation, and nonfarm payrolls all headed south in March. Having said that, I wouldn't fight the Fed and take an opposing view unless softening data continues,forcingthe Fed to change trajectory.
Traders' attention will shift to Friday's nonfarm payrolls and given the latest ADP private payrolls and ISM non-manufacturing figures, there's potential for an upside surprise. Private payrolls came slightly above expectations at 177,000 and the employment component of the services index printed 51.4 which also indicates a rebound in NFP after a sluggish 98,000 jobs added in March.
A reading above 190K jobs tomorrow may provide additional support to the U.S. dollar, but it requires a pickup in wages for the rally to sustain on the short term, as suchtraders should look at the overall health of the jobs market.
The most significant move in currency markets was not the JPY, which declined to a six-week low against the dollar, but the Aussie plummeting 1.5% yesterday. The commodity currency was pressured by falling iron ore and other base metal prices. Iron ore, coking coal, and copper fell 8%, 4.5% and 3% respectively. Meanwhile, gold resumed its downtrend falling by more than 1.1% since yesterday's Fed decision.
In Europe, the final debate between Marine Le Pen and Emmanuel Macron did little to shift market expectations. With more than a 20% margin for Macron in the final round of Presidential Election voting, this seems to be fairly priced in the Euro. Today's services PMI figures across Europe and the U.K. aren't likely to provide much direction to EURUSD and GBPUSD, with most traders preferring to wait for Friday's NFP report before taking action.