
Sample Category Title
Daily Technical Analysis: EURUSD, GBPUSD, USDJPY, USDCHF
EURUSD
The EURUSD was indecisive yesterday. There are no changes in my technical outlook. The bias remains neutral in nearest term. Price has been moving inside a 100 pip range of 1.0950 – 1.0850 since last week. We need a clear break from that range area to see clearer direction. A clear break and daily close above 1.0950 would continue the recent bullish bias testing 1.1000 – 1.1050 area. On the downside, a clear break and daily close back below 1.0850 would expose the pre-gap level at 1.0730. There is no high impact fundamental release today so it is likely that price will remain inside the range area. Overall I remain neutral.
GBPUSD
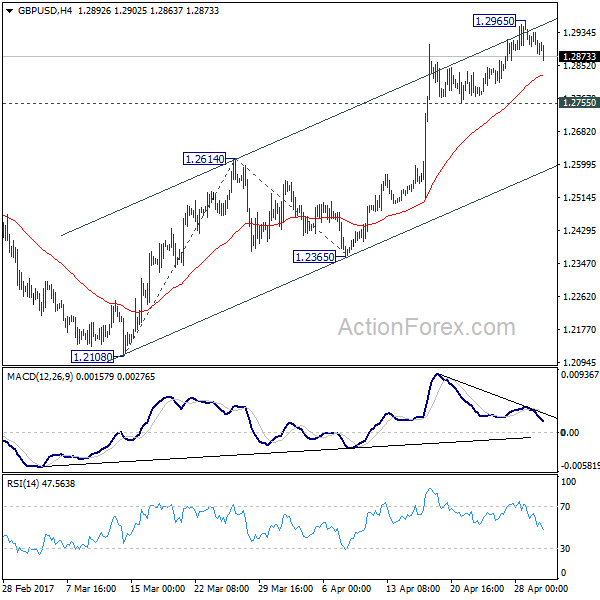
The GBPUSD was corrected lower yesterday bottomed at 1.2882. The bias is neutral in nearest term but as long as stay above 1.2780/50 I still prefer a bullish scenario at this phase with nearest target seen around 1.3050 area. Immediate support is seen around 1.2860. A clear break below that area could trigger further bearish pressure testing 1.2800 but only a clear break below 1.2780/50 would interrupt the double bottom bullish scenario
USDJPY
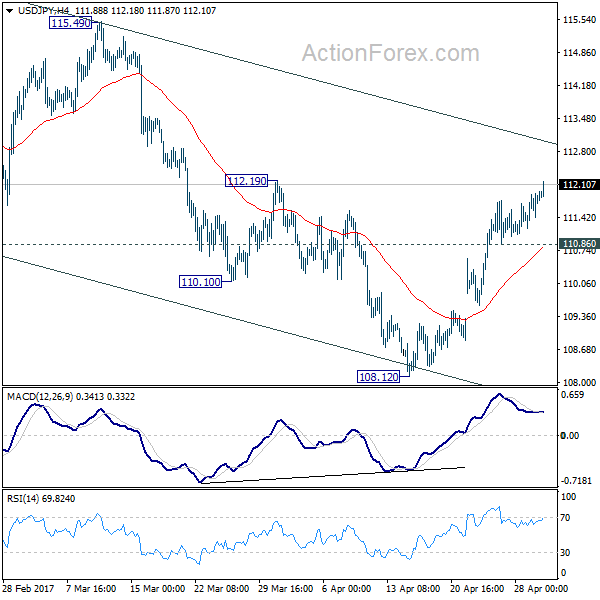
The USDJPY continued its bullish momentum yesterday topped at 111.92 and hit 111.97 earlier today in Asian session. The bias remains bullish in nearest term testing 112.20 area. Immediate support is seen around 111.45. A clear break below that area could lead price to neutral zone in nearest term testing 110.85 but overall price is still in a bullish phase and any downside pullback should be seen as a good opportunity to buy. On the upside, a clear break and daily close above 112.20 would expose 112.85 – 113.50 region.
USDCHF
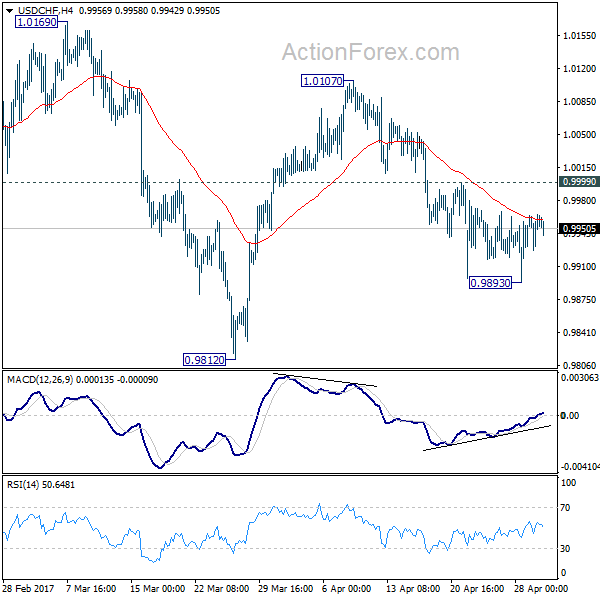
The USDCHF had a moderate bullish momentum yesterday. The bias remains neutral in nearest term but overall I still prefer a bearish scenario at this phase with key resistance seen around 1.0020 and the trend line resistance as you can see on my H4 chart below targeting 0.9880 and 0.9813. Overall I remain neutral.
Markets Mixed Despite VIX Hitting A Decade Low
After returning from a long weekend, equity investors seem undecided on whether to be bullish or bearish. Stocks across Asian markets were mixed on Tuesday despite the CBOE Volatility Index hitting its lowest levels in a decade.However,the low volatility was reflected in currency markets with the Euro, Pound, and the Yen stuck in tight trading against the U.S. dollar.
The Reserve Bank of Australia kept interest rates steady at 1.5% as widely anticipated, but the positive tone on the labor market outlook pushed the Aussie 0.2% higher against the dollar. Australia'scentral bank now expects unemployment to decline gradually over time, and inflation to increase as the economy continues to strengthen. The biggest concern going forward is likely to remain the overheated housing market despite price growth slowing slightly in April. For traders who like high yielding currencies, it will be critical to monitor the differentials in government bond yields. Spreads between U.S. and Australian 10-year bond yields are currently below 30 basis points, and without sufficient premium, it will be hard for AUDUSD to resume its rally. It will require somewhere around 50-60 basis points premium for AUDUSD to break above 2017 highs.
The Fed is next as it kicks off its two-day monetary policy meeting today with an announcement due on Wednesday. While no one expects any changes to policy, the 500-word statement will probably provide some direction to the US Dollar. Economic data releasedhas not been encouraging lately. Friday's GDP didn't reflect the upbeat PMI reports with the economy growing 0.7% in the first three months of 2017. Consumers pulled back on spending, and U.S. employers added far fewer jobs than expected in March.
Will the Fed acknowledge a slowdown in growth and thus send rate hike expectations lower for 2017? Or are these factors only a temporary drag affected by the Easter bank holiday weekend and a delay in tax refunds, which is likely to be reversed in Q2? The Fed's statement should be answering these questions, and based on that, traders will act.
In Europe, investors will take cues from the final PMI numbers from Spain, Italy, France and Germany.
Currencies: Both EUR/USD And USD/JPY Hold Near Recent Correction Top
Sunrise Market Commentary
- Rates: Investors sidelined ahead of key events?
Today's eco calendar contains the final EMU manufacturing PMI and EMU unemployment rate. We don't expect them to influence trading ahead of Apple earnings (tonight), the FOMC meeting (Wednesday), payrolls (Friday) and a possible new vote on an health-care bill (end of the week) in US Congress. We have a neutral view for core bonds today. - Currencies: Both EUR/USD and USD/JPY hold near recent correction top
Yesterday, trading developed in thin market conditions. The dollar didn't react to a disappointing US manufacturing ISM. Today's calendar contains few clues for USD trading. The dollar probably needs support from better eco data and a confirmation from the Fed's rate hike intentions to start a sustained, broad-based rebound
The Sunrise Headlines
- US stock markets ended mixed with Nasdaq outperforming, as bipartisan agreement over a US budget deal balanced a weak US manufacturing ISM. Overnight, Asian bourses gain ground with China underperforming.
- China's factory sector lost momentum in April, with growth slowing to its weakest pace in seven months as domestic and export demand faltered and commodity prices fell. The Caixin manufacturing PMI fell from 51.2 to 50.3.
- Australia's central bank left its cash rate at 1.5%, a widely expected decision given policy makers have signalled a steady outlook for much of the year ahead. AUD/USD gains marginally ground, rising above 0.7550.
- Greece and its foreign creditors reached a deal early this morning on a package of bailout-mandated reforms, Greek FM Euclid Tsakalotos said, paving the way for the disbursement of further rescue funds and debt relief talks.
- Matteo Renzi recaptured the leadership of Italy's centre-left Democratic party. He won more than 70% of the ballots cast, allowing him to brush off concerns that the referendum loss had left him fundamentally discredited.
- The White House is pursuing a twisting path in Congress this week, yielding to Democratic demands on a major spending bill while aggressively pushing a partisan health-care measure, gambling on a big win on health but risking setbacks on both fronts.
- Today's eco calendar contains the April manufacturing PMI's in the UK and EMU (final). The EMU unemployment rate is also scheduled for release. ECB Nouy and Nowotny speak..
Currencies: Both EUR/USD And USD/JPY Hold Near Recent Correction Top
USD/JPY nears 112 barrier
Trading in EUR/USD and USD/JPY was confined to tight ranges yesterday as European markets were closed. In the US, both the spending and income data and the manufacturing ISM were soft. The latter printed at 54.2 from 57.2 and the details were also disappointing. The dollar lost temporary ground after the publication of the report, but the loss was easily reversed. A good performance of US equities (especially the Nasdaq) and a rise of LT US yields after comments from US Treasury secretary Mnuchin on the issuance of long-dated bonds, kept USD/JPY well supported. The pair closed the session at 111.84. EUR/USD finished the day little changed at 1.0899.
Overnight, most Asian markets partially join the tech-driven rally from the US yesterday evening. China underperforms. The Caixin Chinese manufacturing PMI unexpectedly declined to 50.3 from 51.2 in April. USD/JPY stabilizes in the high 111 area, near the recent correction top. EUR/USD still hovers in the low 1.09 area. The Reserve bank of Australia kept its policy rate as expected unchanged at 1.5%. The RBA keeps a balanced approach on the economy going forward. The Aussie dollar gained a few ticks after the RBA's policy statement, but the move is insignificant. AUD/USD trades currently just below 0.7550.
The eco calendar is only moderately interesting today with the final EMU manufacturing PMI's and the EMU March unemployment rate. In the US, only the monthly vehicle sales are on the agenda. The final EMU manufacturing PMI's are expected to confirm the strong reading from the preliminary release. The US vehicle sales mostly have only limited impact on global markets and on the dollar in particular. However, they might get some more attention as soft car sales weighed on consumer spending of late. Global markets might also be affected by the results of several US bellwethers (including Apple). In a daily perspective, we expect relatively cautious trading in the major dollar cross rates. USD/JPY of late had a constructive momentum. Good US earnings might keep the downside in this cross rate well protected. However, given recent US soft data, the dollar probably needs support from better US eco data and a clear sign from the Fed that it maintains its rate hike intentions for this year to gain sustained further ground. The signal won't come today. In this context, we also expected EUR/USD to hold near the recent recovery high. The PMI's might be marginally euro supportive
Last week, FX trading was driven by the global risk trade as (European) political event risk eased. This supported USD/JPY, but also EUR/USD and EUR/JPY. The market also pondered whether declining political risk could bring forward the ECB normalisation process. However this hope was moderated after the ECB press conference. From a technical point of view, the rebound of USD/JPY suggests a bottoming out process has started, but the pair needs to regain the 112.20 level (neckline ST double bottom) to improve the picture. EUR/USD extensively tested the topside of the MT range (1.0874/1.0906 area) late March. The pair returned to the range top after the French election and set minor new highs. We look out how this test turns out. If EUR/USD would regain the 1.10 barrier, next resistance comes in in the 1.1145/1.13 area (US pre/post-election swings). The jury is still out, but we are not convinced that the time is already ripe for a sustained break higher of EUR/USD.
EUR/USD: holding near the post-Macron-top, but no clear break yet
EUR/GBP
Sterling cedes slightly ground on harsh Brexit talk
Yesterday, sterling traded with a soft bias both against the dollar and the euro. Trading developed in thin market conditions as most European markets were closed. The decline of sterling was probably driven by harsh comments from EU leaders this weekend as they discussed the EU strategy for the upcoming Brexit talks. Especially negative/skeptical comments from EU's Juncker on a possible collapse of the negotiations dominated the headlines. Cable returned back south to the 1.29 area. EUR/GBP closed the session at 0.8458.
Today, the UK manufacturing PMI is expected to decline slightly from 54.2 to 54.00. After some mixed data of late, the (FX) markets will look for clues to whether some further cooling in the UK economy might be at hand. We don't have strong arguments to take a different view from the consensus, but the market might become a bit more sensitive to negative surprises. We also look out whether Brexit might get some further attention as a driver for sterling trading. However, we doubt that it will become really important already before the UK elections. We start the week with a slight sterling negative bias.
Two weeks ago, EUR/GBP dropped below EUR/GBP 0.84 support, (temporary) improving the sterling picture. The pair came within reach of the key 0.8305 support (Dec low), but no real test occurred. After last week's rebound, the range bottom is better protected. Longer term, Brexit-complications remain potentially negative for sterling. On technical considerations we are inclined to reconsider a cautious EUR/GBP buy-on-dips approach.
EUR/GBP: downside better protected after last week's rebound
EUR/USD Daily Outlook
Daily Pivots: (S1) 1.0880; (P) 1.0901 (R1) 1.0920; More....
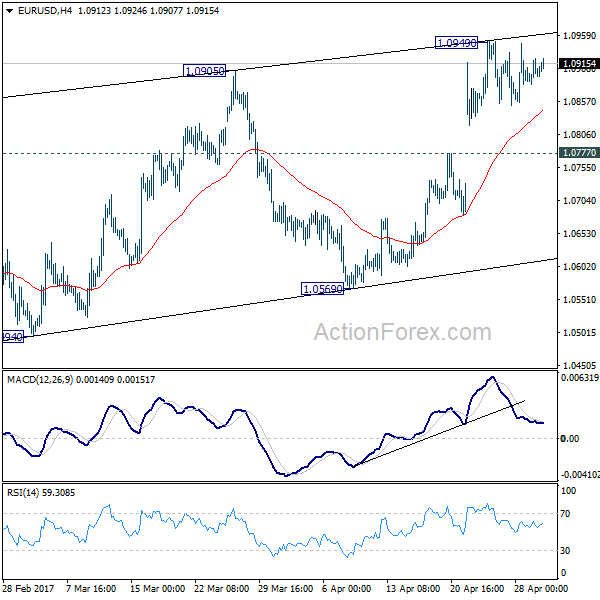
Intraday bias in EUR/USD remains neutral as consolidation from 1.0949 continues. With 1.0777 minor support intact, further rise is still expected. But still, choppy rebound from 1.0339 is seen as a correction. Hence we'd look for topping again on next rise. Meanwhile, on the downside, break of 1.0777 will turn turn bias to the downside for 1.0569 support first.
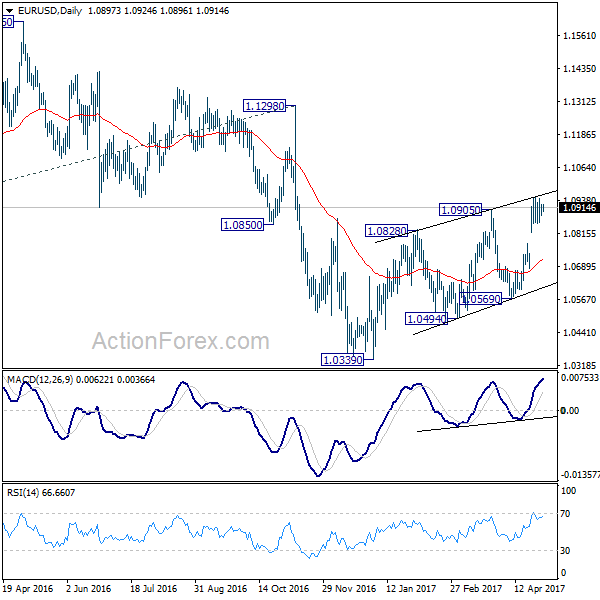
In the bigger picture, as long as 1.1298 key resistance holds, whole down trend from 1.6039 (2008 high) is still expected to continue. Break of 1.0339 low will send EUR/USD through parity to 61.8% projection of 1.3993 to 1.0461 from 1.1298 at 0.9115. However, considering bullish convergence condition in weekly MACD, break of 1.1298 will indicate term reversal. This would also be supported by sustained trading above 55 week EMA.
GBP/USD Daily Outlook
Daily Pivots: (S1) 1.2863; (P) 1.2903; (R1) 1.2923; More...
GBP/USD is staying in consolidation below 1.2965 temporary top. Further rally is expected as long as 1.2755 minor support holds. Break of 1.2965 will target 161.8% projection of 1.2108 to 1.2614 from 1.2365 at 1.3184. At this point, price actions from 1.1946 are still interpreted as a correction pattern. Therefore, we'd expect strong resistance below 1.3444 to bring larger down trend resumption. On the downside, break of 1.2755 minor support will turn bias to the downside. Further break of 1.2614 resistance turned support will now indicate near term reversal.
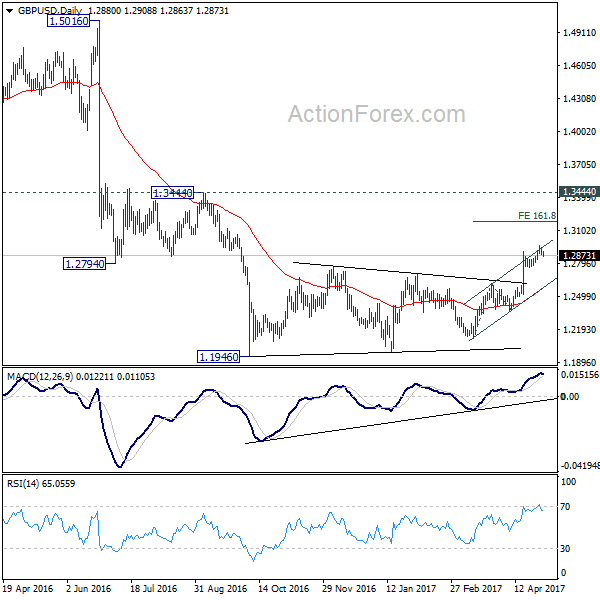
In the bigger picture, fall from 1.7190 is seen as part of the down trend from 2.1161. There is no sign of medium term reversal yet. Sustained trading below 61.8% projection of 2.1161 to 1.3503 from 1.7190 at 1.2457 will target 100% projection at 0.9532. Overall, break of 1.3444 resistance is needed to confirm medium term bottoming. Otherwise, outlook will remain bearish.
USD/CHF Daily Outlook
Daily Pivots: (S1) 0.9939; (P) 0.9952; (R1) 0.9975; More.....
Intraday bias in USD/CHF remains neutral as it's bounded in tight range above 0.9893 temporary low. With 0.9999 minor resistance intact, deeper decline is mildly in favor. Below 0.9893 will target 0.9812 and below to extend the correction from 1.0342. But break of 0.9812 should be brief and we will look for bottoming signal below there. On the upside, above 0.9999 minor resistance argues that fall from 1.0107 is finished, with bullish convergence condition in 4 hour MACD. In that case, intraday bias will be flipped back to the upside for 1.0107 resistance first.
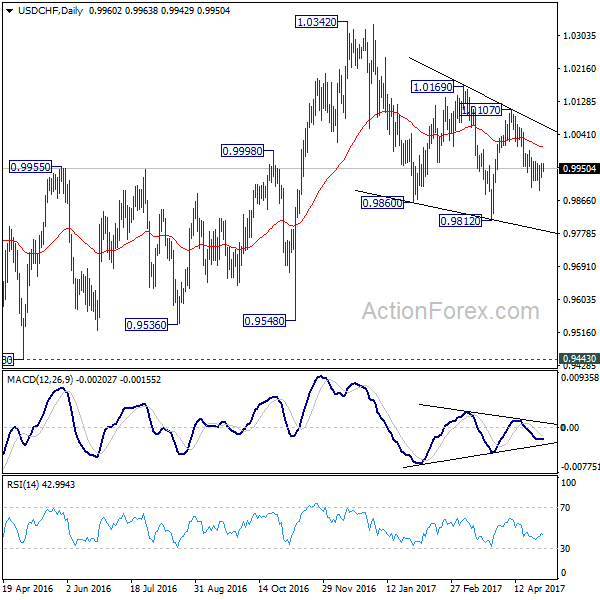
In the bigger picture, we're still maintaining that firm break of 1.0342 key resistance is needed to confirm underlying bullish momentum in the pair. However, the corrective nature of the fall from 1.0342 is starting to give the medium term outlook a bullish favor. Hence, in stead of looking for topping signal around 1.0342, we'd now pay closer attention to upside acceleration as USD/CHF approaches this level again.
USD/JPY Daily Outlook
Daily Pivots: (S1) 111.37; (P) 111.65; (R1) 112.09; More....
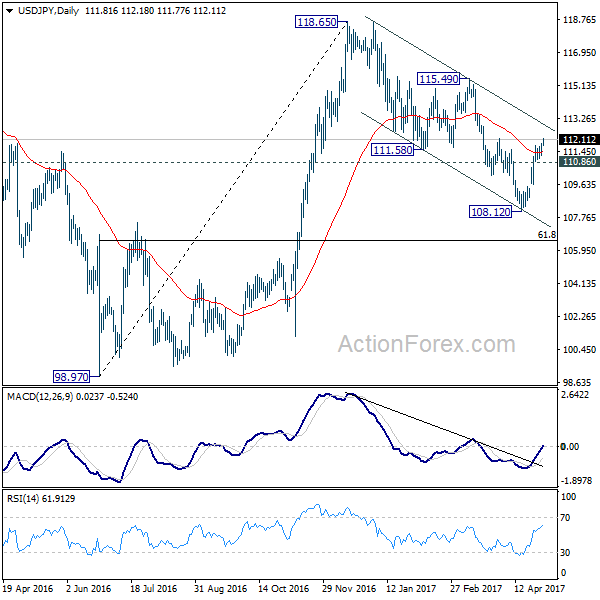
Intraday bias in USD/JPY is back on the upside as rise from 108.12 resumes. The current development indicates that corrective decline from 118.65 has completed with three waves down to 108.12. Further rally would be seen to 115.49 resistance first. Break will target 118.65 high. On the downside, break of 110.86 minor support will turn bias neutral and bring consolidations first.
In the bigger picture, price actions from 125.85 high are seen as a corrective pattern. It's uncertain whether it's completed yet. But in case of another fall, downside should be contained by 61.8% retracement of 75.56 to 125.85 at 94.77 to bring rebound. Meanwhile, break of 115.49 resistance will extend the rise from 98.97 to retest 125.85. Overall, rise from 75.56 is still expected to resume later after the correction from 125.85 completes.
USD/CAD Daily Outlook
Daily Pivots: (S1) 1.3648; (P) 1.3667; (R1) 1.3698; More....
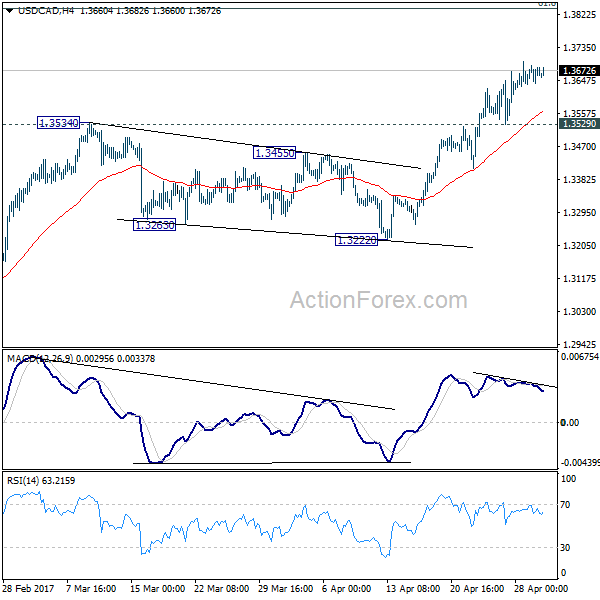
USD/CAD lost some upside momentum as seen in 4 hour MACD. But with 1.3529 minor support intact, further rise is still expected. Current rally is part of the larger rise from 1.2460 and should target next medium term fibonacci level at 1.3838 ahead. Meanwhile, break of 1.3529 will indicate short term topping and bring lengthier consolidation.
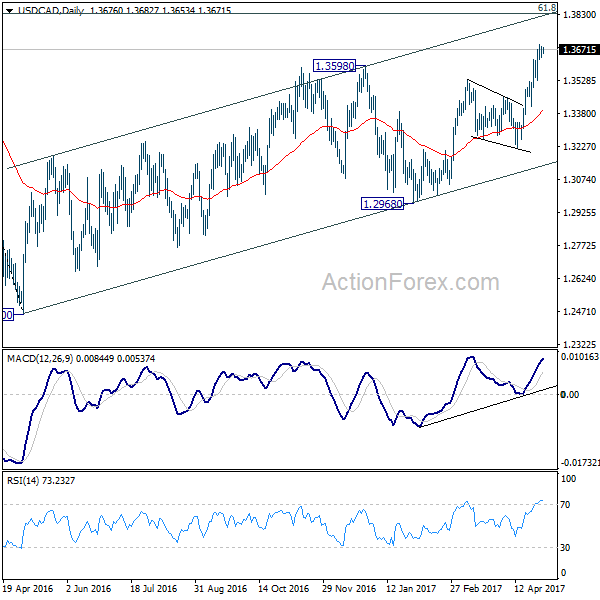
In the bigger picture, price actions from 1.4689 medium term top are seen as a correction pattern. The first leg has completed at 1.2460. The second leg from 1.2460 is likely still in progress and could target 61.8% retracement of 1.4689 to 1.2460 at 1.3838. We'd look for reversal signal there to start the third leg. However, break of 1.3222 support will argue that the third leg has already started and should at least bring a retest of 1.2460 low. Meanwhile, sustained trading above 1.3838 would pave the way to retest 1.4689 high.
RBA On Hold, Cautious Over Housing Market Despite Price Growth Slowdown In April
As widely anticipated, RBA left its cash rate, for an 8th meeting, at 1.5% in April. While headline CPI has more or less reached the central bank's target level, the core reading has remained subdued. Policymakers have decided to take more time to gauge the inflation outlook before action. Meanwhile, the unemployment rate has remained elevated while excess capacity in the job market has rendered wage growth weak.
The RBA reiterated its rhetoric on the housing market, suggesting conditions 'continue to vary considerably around the country'. Policymakers would be cautious over adopting another rate cut as previous reductions have caused a surge in housing produces and rebound in investment related credit growth. A rate hike is equally unlikely as Australian dollar has remained at historically high levels.
Housing markets: Continue to vary considerably around the country
On the housing market, policymakers reiterated that conditions 'continue to vary considerably around the country'. They acknowledged that 'prices have been rising briskly in some markets and declining in others. In the eastern capital cities, a considerable additional supply of apartments is scheduled to come on stream over the next couple of years'. Additionally, rent increases are the slowest for two decades.
Growth in housing debt has outpaced the slow growth in household incomes. The recently announced supervisory measures should help address the risks associated with high and rising levels of indebtedness'. The latest data from CoreLogic showed that Sydney housing prices dropped in April, while growth in Melbourne prices decelerated. Yet, it would be premature to call that Australian property prices have peaked after just one month of moderation.
Headline inflation picked up
On other macroeconomic developments, policymakers acknowledged the pick-up in headline inflation rates, as a result of 'higher commodity prices'. Yet, core CPI remained low.
Growth outlook unchanged
The economic growth outlook has stayed unchanged with growth 'expected to increase gradually over the next couple of years to a little above +3%'. RBA suggested that the economy is 'continuing its transition following the end of the mining investment boom, with the drag from the decline in mining investment coming to an end and exports of resources picking up'.
Mixed picture in job market
Policymakers saw a mixed picture in the job market, noting that a modest increase in the unemployment rate has been accompanied with a little stronger growth in payrolls. Policymakers expected the unemployment rate to 'decline gradually over time' while wage growth would remain 'slow and this is likely to remain the case for a while yet'
Repeating what has been stated in recent months, RBA 'judged that holding the stance of monetary policy unchanged' would be 'consistent with sustainable growth in the economy and achieving the inflation target over time'. We retain the view that RBA would stay on hold for the remainder of the year.
Daily Technical Outlook And Review: EUR/USD, GBP/USD, AUD/USD, USD/JPY, USD/CAD, USD/CHF, DOW 30, GOLD
A note on lower timeframe confirming price action...
Waiting for lower timeframe confirmation is our main tool to confirm strength within higher timeframe zones, and has really been the key to our trading success. It takes a little time to understand the subtle nuances, however, as each trade is never the same, but once you master the rhythm so to speak, you will be saved from countless unnecessary losing trades. The following is a list of what we look for:
- A break/retest of supply or demand dependent on which way you're trading.
- A trendline break/retest.
- Buying/selling tails ... essentially we look for a cluster of very obvious spikes off of lower timeframe support and resistance levels within the higher timeframe zone.
- Candlestick patterns. We tend to only stick with pin bars and engulfing bars as these have proven to be the most effective.
EUR/USD
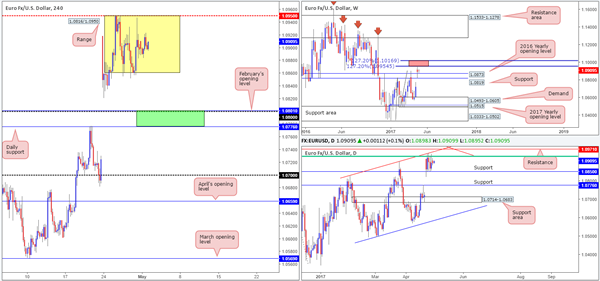
As anticipated, trading volume was thin during the yesterday's segment, with the pair ranging a mere forty pips on the day. Europe's banks were closed in observance of Labor Day as were the UK's banks due to May Day. Because of this, the EUR is effectively unchanged this morning. Therefore, much of the following report will echo thoughts put forward in yesterday's analysis…
The H4 chart shows that the unit has recently entered into the phase of a consolidation between 1.0861/1.0950. Momentum, nevertheless, has been firmly positioned to the upside since early April so a lot of traders will likely have their eye on buying the breakout of this range. Though, with a daily resistance seen lurking just above at 1.0971 coupled with a weekly 127.2% Fib extension at 1.0954 (taken from the lows 1.0340), this could very well end in tears!
Our suggestions: Based on the above notes, we see two possible scenarios:
Watch for price to breakout above 1.0950, and assess H4 candle action. In the event that a solid (bearish) rejection candle is seen, preferably a full-bodied candle, then not only is a move back into the H4 consolidation possible, but a trade short on the back of this is as well.
Assuming that the bears do take over this week, longs could be an option from 1.0776/1.0801. Why here? This green area is comprised of a daily support at 1.0776, a round number at 1.08 and February's opening level at 1.0801. Ultimately though, before considering a trade from this region we'd like to see some form of bullish rotation emerge from here (a reasonably sized full-bodied candle would be ideal).
Data points to consider: No high-impacting new events.
Levels to watch/live orders:
- Buys: 1.0776/1.08 ([waiting for a reasonably sized H4 bull candle to form before pulling the trigger is advised] stop loss: ideally beyond the candle's tail).
- Sells: Trading any fakeout seen beyond 1.0950 is a possibility (should a full-bodied rejection candle be seen). Stops would ideally be placed beyond daily resistance at 1.0971.
GBP/USD
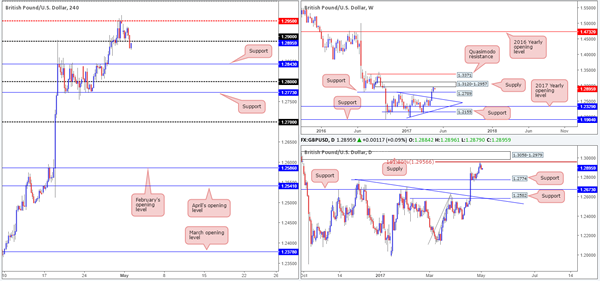
In recent trading, the GBP elbowed its way through the 1.29 neighborhood and ended the day chalking up a full-bodied bearish candle. This – coupled with weekly price recently touching gloves with supply at 1.3120-1.2957, and daily movement checking in with a 161.8% Fib extension at 1.2956 (drawn from the low 1.2108), could see H4 price shake hands with support at 1.2843/61.8% Fib support at 1.2835 (taken from the low 1.2754) sometime today. To take advantage of this potential move south, we'd be looking for a retest of 1.29 to hold firm as resistance.
Our suggestions: Should H4 price retest 1.29 today and pencil in a reasonably sized H4 bearish candle (preferably a full-bodied candle), a short from here is high probability and will likely reach the 1.2843 region, and quite possibly the weekly support mentioned above at 1.2789.
Data points to consider: UK manufacturing PMI figures at 9.30am GMT+1.
Levels to watch/live orders:
- Buys: Flat (stop loss: N/A).
- Sells: 1.29 region ([waiting for a reasonably sized H4 bear candle to form before pulling the trigger is advised] stop loss: ideally beyond the candle's wick).
AUD/USD
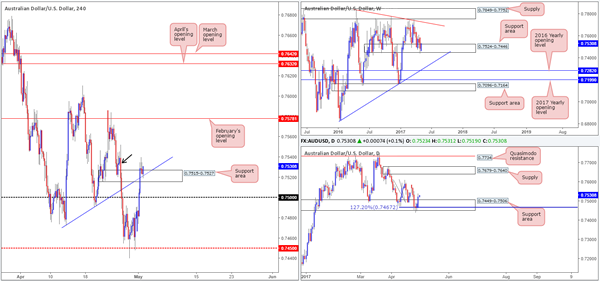
The AUD/USD, as you can see, began the day on a strong footing, printing a near-full-bodied bullish candle. Shortly after (the London open), the 0.75 handle was easily cleared which allowed the unit to smash through both a H4 resistance area at 0.7515-0.7527 and a H4 trendline resistance extended from the low 0.7472.
With both of these structures now seen offering support, and the nearby H4 supply seen marked with a black arrow at the 0.7537ish range (most likely) consumed by yesterday's high 0.7540, further buying could be on the cards today. Adding to this rationale is that weekly bulls remain trading from within a support area at 0.7524-0.7446, as do the daily bulls from a support zone logged at 0.7449-0.7506 (also bolstered by a AB=CD 127.2% Fib extension at 0.7467 taken from the high 0.7610).
Our suggestions: Should the current H4 candle close as is seen on the chart, our team would have no hesitation in buying here and targeting February's opening level at 0.7581.Ultimately, what we're looking for a sign that bulls are interested, and a near-full-bodied bullish candle would do just that.
Data points to consider: Chinese Manufacturing PMI at 2.45am, followed by the RBA meeting at 5.30am GMT+1.
Levels to watch/live orders:
- Buys: Currently hunting for longs out of the H4 support area at 0.7515-0.7527 ([waiting for a reasonably sized H4 bull candle to form before pulling the trigger is advised] stop loss: ideally beyond the candle's tail).
- Sells: Flat (stop loss: N/A).
USD/JPY
Beginning with a look at the weekly timeframe this morning, we can see the unit remains trading within the jaws of supply coming in at 112.19-111.05. Looking down to the daily candles, the resistance area seen at 111.35-112.37 is still in play. In the event that the bears come into the market here, the next area of interest for us would be the support zone seen at 107.15-107.90, which is joined closely by a 61.8% Fib support at 107.84 taken from the low 101.19. A continuation move to the upside, nevertheless, could set the stage for price to challenge the resistance area at 115.62-114.60.
A brief look at recent dealings on the H4 chart shows that price came within a cat's whisker of supply seen at 112.19-111.95 (holds the 112 handle within). Given that this area is lodged within the upper limits of the said weekly supply, we feel this H4 zone could be a nice base to consider shorts from.
Our suggestions: Wait for H4 action to strike 112 and hold firm. Should this be seen, we believe a short from here is valid down to at least April's opening level at 111.41.
Data points to consider: No high-impacting new events.
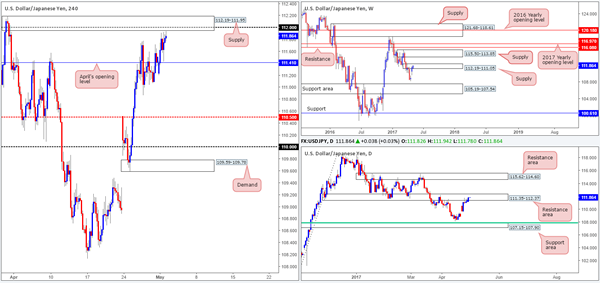
Levels to watch/live orders:
- Buys: Flat (stop loss: N/A).
- Sells: As long as 112 holds firm when tested, a short from here is valid according to our technicals (stop loss: 112.22).
USD/CAD
Although the buyers printed a seventh consecutive bullish candle yesterday, our team remains somewhat biased to the downside. To begin with, we have the 1.37 handle lurking just above current price. In addition to this, the 1.37 level represents the underside of a daily supply pegged at 1.3859-1.3700. Also of note is the 2016 yearly opening level at 1.3814 (the next upside target on the weekly scale), which is held within the walls of the above said daily supply area.
Our suggestions: The 1.37 handle remains of interest to our team this week seeing as how it aligns perfectly with the underside of the said daily supply. An intraday short from this level could be something to think about. The reason for not expecting much more of a move from here is simply through fear of weekly price dragging the market higher to the noted 2016 yearly opening level. And this is why we believe the better level for shorts today/this week, albeit quite a way off yet, is the 2016 yearly opening base itself (1.38 region) as it is firmly positioned within the said daily supply, thus allowing the trader to conservatively place stops above this area.
Data points to consider: No high-impacting new events.
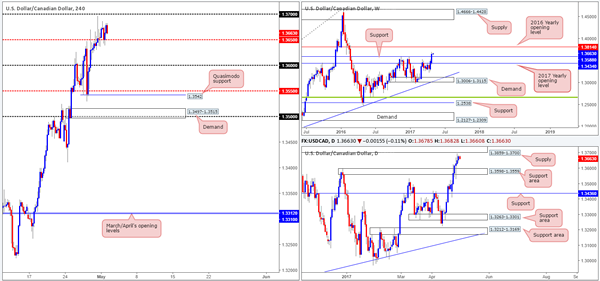
Levels to watch/live orders:
- Buys: Flat (stop loss: N/A).
- Sells: 1.37 region ([possible intraday shorts – would not advise placing pending orders – wait for additional lower-timeframe confirming price action – see the top of this report] stop loss: dependent on where one confirms this area). 1.3814/1.38 region is an ideal place for shorts since this area requires no additional confirmation (stop loss: conservative at 1.3861).
USD/CHF
With the Swissy still seen ranging between 0.9923/0.9964 on the H4 chart, much of the following report will be similar to Monday's analysis…
On the weekly chart, we still have the support level at 0.9861 in our sights. Price came within 30 or so pips of this barrier last week before rotating to the upside. The additional level of interest on this scale is the 2016 yearly opening line forged at 1.0029 that's located just below a supply zone pegged at 1.0170-1.0095.
Dropping down to the daily chart, we can see that price spent the entire week clinging to the underside of a resistance area at 1.0001-0.9957, and left the nearby support area at 0.9842-0.9884 unchallenged (holds weekly support within). Any sustained move below this support zone would likely place support at 0.9678 in the spotlight. A push above the current resistance area on the other hand could lead to the Swissy attacking the supply zone plotted at 1.0107-1.0072.
Our suggestions: There's still equal opportunity to trade this pair both long and short today. For shorts, we have the 1.0016/0.9992 region, and for longs the 0.9884/0.99 remains of interest despite it being tested on Friday (green zones on the H4 chart). Both zones, as you can see, also boast daily structure.
The only grumble we would have if we were to take a long from the said H4 area is the fact that weekly price could potentially push the market lower to shake hands with support at 0.9861. On a similar note, a short from 1.0016/0.9992 is somewhere that could be faked as price may want to connect with the 2016 yearly opening level mentioned above at 1.0029. As such, we are advising traders not to trade the above said zones blindly! Wait for additional confirmation either in the form of a H4 candle (preferably a full-bodied candle) or a lower-timeframe signal (see the top of this report).
Data points to consider: No high-impacting new events.
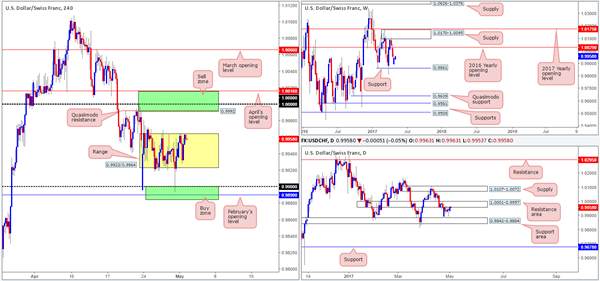
Levels to watch/live orders:
- Buys: 0.9884/0.99 ([waiting for a reasonably sized H4 bull candle to form before pulling the trigger is advised] stop loss: ideally beyond the candle's tail).
- Sells: 1.0016/0.9922 ([waiting for a reasonably sized H4 bear candle to form before pulling the trigger is advised] stop loss: ideally beyond the candle's wick).
DOW 30
Since H4 price whipsawed through resistance at 21020, US equities have been grinding lower. The next support target on tap from here is not seen in view until March's opening level at 20824 that sits conveniently above the daily support area at 20714-20821 (the next downside target on that timeframe). With daily price currently trading from a resistance area at 21022-20933, there's a good chance that price may reach the above noted daily support area. However, up on the weekly candles, price looks poised to pop up to continue marching higher!
Our suggestions: Ultimately, our team's bias is long. However, we're finding it difficult to pin down a setup given the only support present is March's opening level seen on the H4 chart. Therefore, unless new H4 structure forms at current price or we see a decline down to 20824, we will continue to remain flat.
Data points to consider: No high-impacting new events.
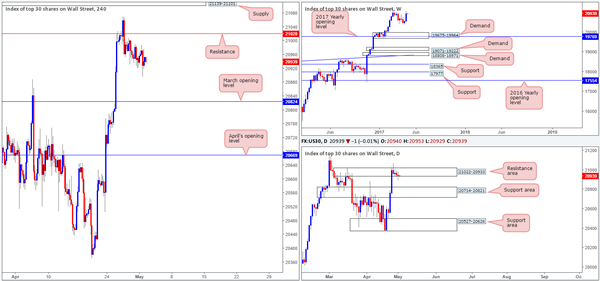
Levels to watch/live orders:
- Buys: 20824 looks an interesting level for longs. However, we would require a H4 bullish candle to present itself here (preferably a full-bodied candle) before committing (stop loss: ideally beyond the candle's tail).
- Sells: Flat (stop loss: N/A).
GOLD
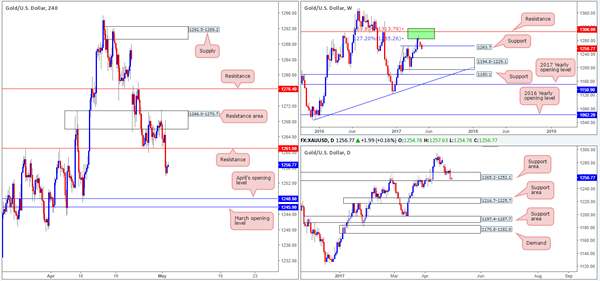
From the weekly chart this morning, we can see that the candles have edged below support coming in at 1263.7. Providing that the bears remain in control here, the demand zone plotted at 1194.8-1229.1 is likely to be the next barrier on the hit list. Whilst weekly bears appear to have a strong foothold in this market, daily price is seen trading within the lower limits of a support zone drawn from 1265.2-1252.1.
Over on the H4 candles, support at 1261.0 was taken out going into the London close yesterday. This has, as you can see, potentially opened up the path south for the unit to challenge April's opening base line at 1248.0/March's opening base line at 1245.9.
Our suggestions: Should H4 price retest 1261.0 as resistance today and hold, we may, given the technical picture on the weekly chart, think about selling. Of course, the only grumble we would have here is that daily price remains within a support zone (see above). Therefore, we would not consider shorts from 1261.0 UNLESS a reasonably sized H4 bearish candle forms off this line, preferably a full-bodied candle.
Levels to watch/live orders:
- Buys: Flat (stop loss: N/A).
- Sells: 1261.0 region ([waiting for a reasonably sized H4 bear candle to form before pulling the trigger is advised] stop loss: ideally beyond the candle's wick).