Sample Category Title
Oil “Red Zone” Warning Caps Market Recovery as Iran Signals Stay Conflicting
Forex markets remained trapped within yesterday's ranges as investors struggled to find fresh conviction amid conflicting signals surrounding the US-Iran conflict. While there was some brief improvement in risk sentiment after US President Donald Trump said Washington was in the “final stages” of negotiations with Iran, optimism faded quickly as no concrete breakthrough emerged from either side officially.
But the optimism faded quickly after Reuters reported that Iran’s supreme leader Mojtaba Khamenei had directed officials to keep enriched uranium inside the country — a move likely to complicate any final agreement substantially.
The oil market remains the key macro driver. International Energy Agency Executive Director Fatih Birol warned on Thursday that global oil markets could soon enter a “red zone” during July or August if the Strait of Hormuz is not fully reopened before summer demand accelerates.
According to Birol, the IEA has already been injecting roughly 2.5 to 3 million barrels per day from strategic reserves to offset supply disruptions, but stressed that emergency stockpiles “are not endless.” With commercial inventories already declining rapidly and global demand set to rise during the northern hemisphere travel season, concerns are shifting away from pure geopolitical risk pricing toward fears of outright physical supply tightness.
Those concerns continued capping broader risk appetite across markets. Brent crude climbed back above %106 after earlier declines, while US 10-year Treasury yield rebounded to 4.60%, keeping financial conditions tight globally. Gold also softened again and drifted back toward the 4,500 area.
In currency markets, Sterling is the strongest performer of the week so far as immediate fears surrounding UK politics and fiscal instability eased. Kiwi followed, while Dollar also stayed relatively firm amid elevated yields.
On the weaker side, Yen continued suffering under the weight of rising global yields, while Aussie is pressured after weak employment data reinforced expectations that the RBA will hold rates steady in June. Euro also underperformed following weak PMI data and lingering uncertainty over whether ECB tightening will continue near term.
The market’s problem now is credibility. Traders do not appear willing to fully trust optimistic geopolitical headlines unless they are accompanied by concrete progress on reopening the Strait of Hormuz and stabilizing physical oil supply. Until then, every temporary recovery in sentiment risks running into the same structural obstacle: tightening energy markets and rising global yields.
US initial jobless claims fall to 209k, labor market remains resilient
US weekly jobless claims stayed near low levels in May, reinforcing the view that the labor market remains resilient despite broader signs of slowing economic momentum. Read More.
GBP/CHF Rebounds as UK Fiscal Worst-Case Fears Fade, Head-and-Shoulders Bottom Forming?
Sterling rebounded as markets stepped back from pricing a UK fiscal crisis after Andy Burnham reassured investors on fiscal discipline, while GBP/CHF began forming a potential bullish reversal pattern. Read More.
UK PMI Composite Falls Into Contraction as BoE Faces “Major Quandary”
UK business activity fell back into contraction in May as collapsing services demand, rising energy costs, and growing political uncertainty left the Bank of England facing a “major quandary.” Read More.
Eurozone PMI Composite Falls to 31-Month Low, Signals -0.2% Q2 GDP Contraction
Eurozone business activity deteriorated sharply in May as the Composite PMI fell to a 31-month low, with survey data signaling a potential 0.2% contraction in Q2 GDP amid deepening energy-shock pressures. Read More.
Aussie Rebound Runs Into Domestic Reality as Weak Jobs Lock In RBA June Hold
AUD/USD’s relief rally faded quickly after weak Australian jobs data effectively locked in an RBA hold for June, reinforcing concerns that cracks are forming in the domestic economy. Read More.
Australia Employment Unexpectedly Contracts as Unemployment Rate Jumps to 4.5%
Australia’s labor market weakened sharply in April as employment unexpectedly contracted and unemployment jumped to 4.5%, strengthening expectations that the RBA will stay cautious near term. Read More.
Australia PMIs Fall Back Into Contraction as Demand and Confidence Deteriorate
Australia’s private sector fell back into contraction in May as weakening demand, softer hiring, and elevated energy costs pushed business confidence toward pandemic-era lows. Read More.
BoJ’s Koeda Says Oil-Driven Inflation Risks Could Justify Further Rate Hikes
BoJ board member Junko Koeda warned the Middle East oil shock could push Japan’s underlying inflation above target, strengthening the case for further rate hikes as early as June. Read More.
Japan PMI Growth Slows as Manufacturing Strength Offsets Stagnating Services Sector
Japan’s economic expansion slowed in May as services activity stagnated and cost pressures surged, though manufacturing continued benefiting from stockpiling tied to Middle East supply disruptions. Read More.
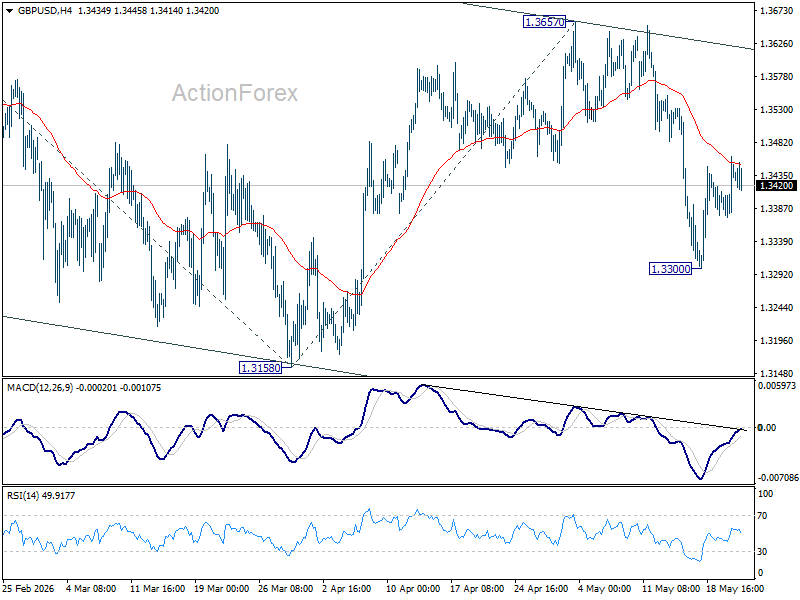
GBP/USD Daily Outlook
No change in GBP/USD's outlook and intraday bias stays neutral. Further fall is expected as long as 55 4H EMA (now at 1.3450 holds. Below 1.3300 will target a retest on 1.3158 support first. However, sustained break of the EMA will dampen the bearish case and turn bias back to the upside for 1.3657 resistance instead.
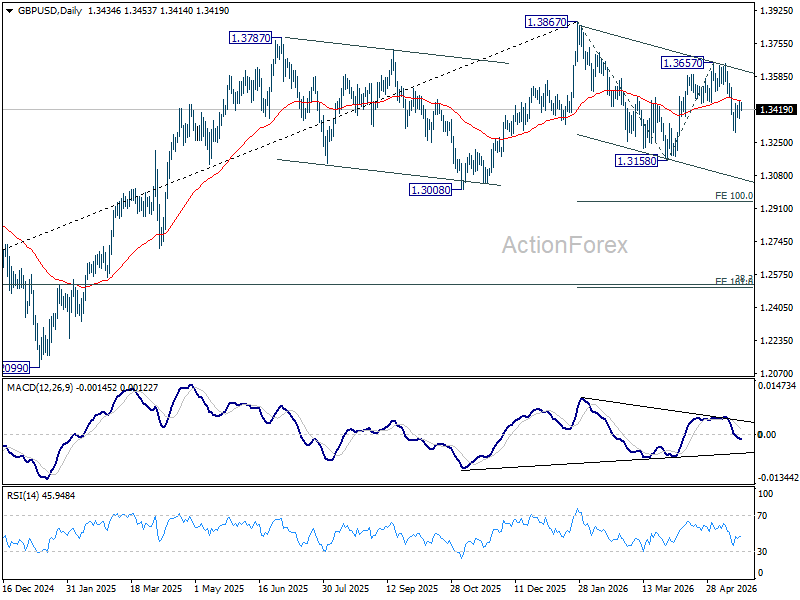
In the bigger picture, current development suggests that price actions from 1.3867 are merely a corrective pattern within the broader up trend from 1.0351 (2022 low). With 1.3008 support intact, medium term bullishness is maintained and break of 1.3867 is in favor for a later stage, towards 1.4248 key resistance (2021 high). However, firm break of 1.3008 will at least bring deeper fall to 38.2% retracement of 1.0351 to 1.3867 at 1.2524, with increased risk of bearish reversal.
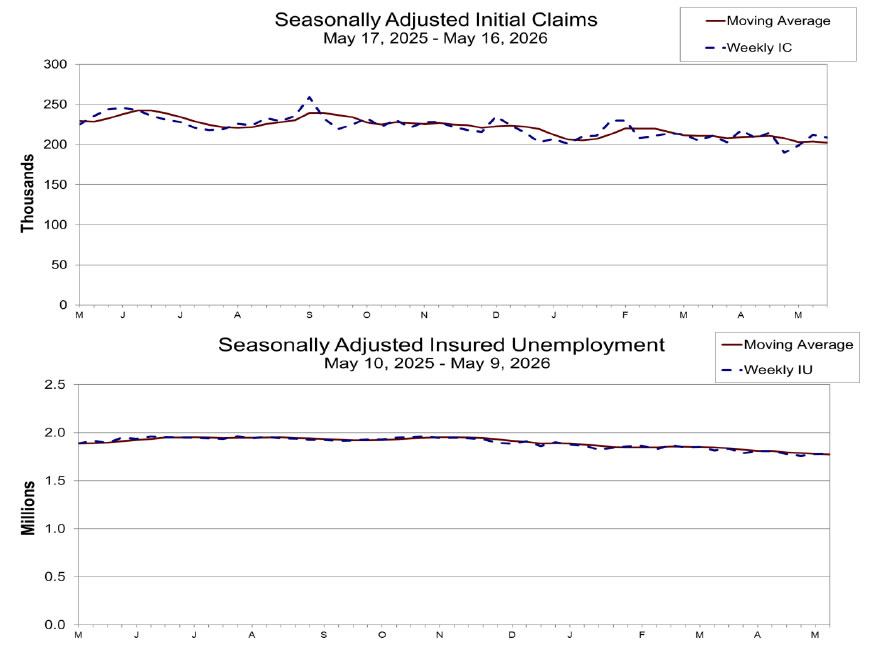
US initial jobless claims fall to 209k, labor market remains resilient
US initial jobless claims edged lower by -3k to 209k in the week ending May 16, slightly below expectations of 210k and consistent with a labor market that remains relatively resilient despite slowing economic momentum elsewhere. Four-week moving average of initial claims also declined by -1.5k to 202.5k, suggesting layoffs remain contained overall.
Continuing claims, however, rose modestly by 6k to 1.782m in the week ending May 9, indicating some unemployed workers may still be finding it harder to secure new jobs quickly. Even so, four-week moving average of continuing claims fell by -6.5k to 1.773m, pointing to broadly stable labor market conditions.
EUR/USD Daily Outlook
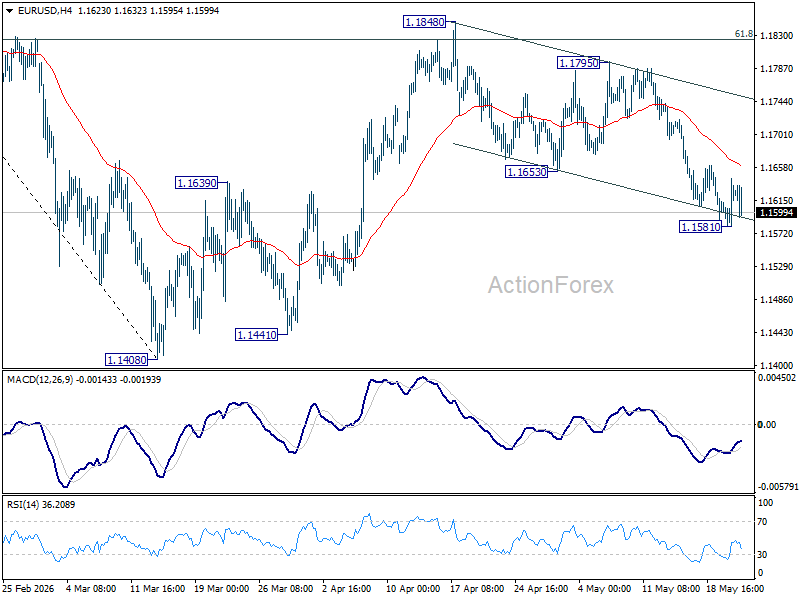
Intraday bias in EUR?USD stays neutral at this point. As noted before, rebound from 1.1408 could have completed as a corrective three-wave move. Deeper fall should be seen to retest 1.1408 low. For now, risk will stay on the downside as long as 55 4H EMA (now at 1.1659) holds.
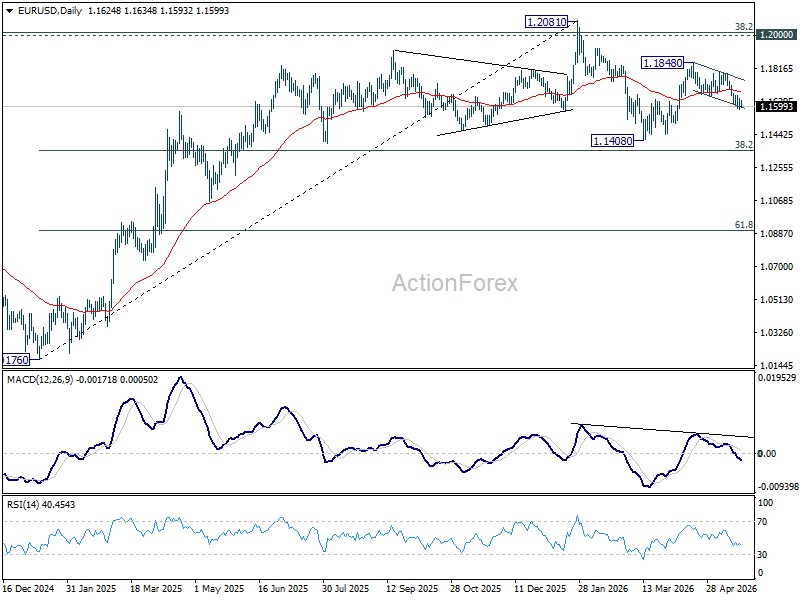
In the bigger picture, the strong support from 38.2% retracement of 1.0176 to 1.2081 at 1.1353 suggests that the pullback from 1.2081 is more likely a corrective move. Strong support was also found in 55 W EMA (now at 1.1542). Focus is back on 1.2 key cluster resistance level. Decisive break there will carry long term bullish implications. Nevertheless, break of 1.1408 support will revive the case of medium term bearish trend reversal.
USD/JPY Daily Outlook
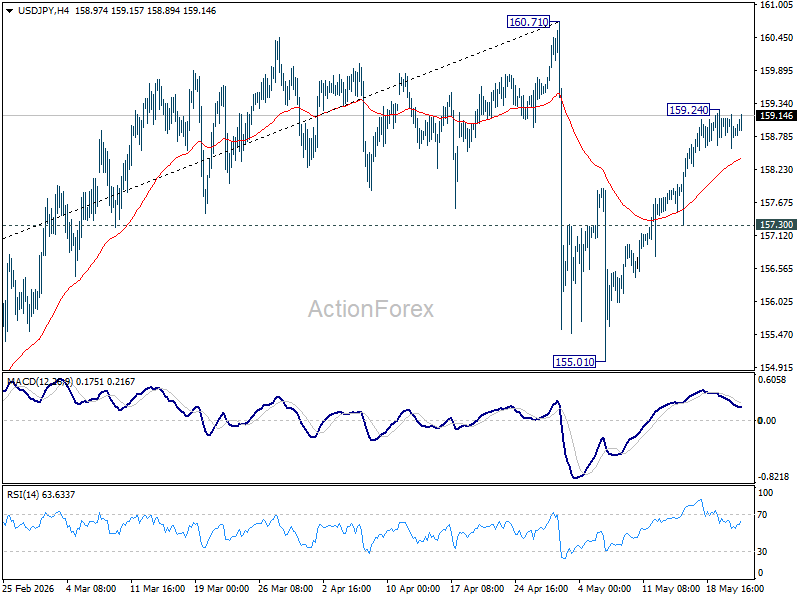
Intraday bias in USD/JPY remains neutral at this point. Above 159.24 will target 160.71 high. Strong resistance is expected from there to start the third leg of the near term corrective pattern. On the downside, break of 157.30 support will turn bias to the downside for retesting 155.01.
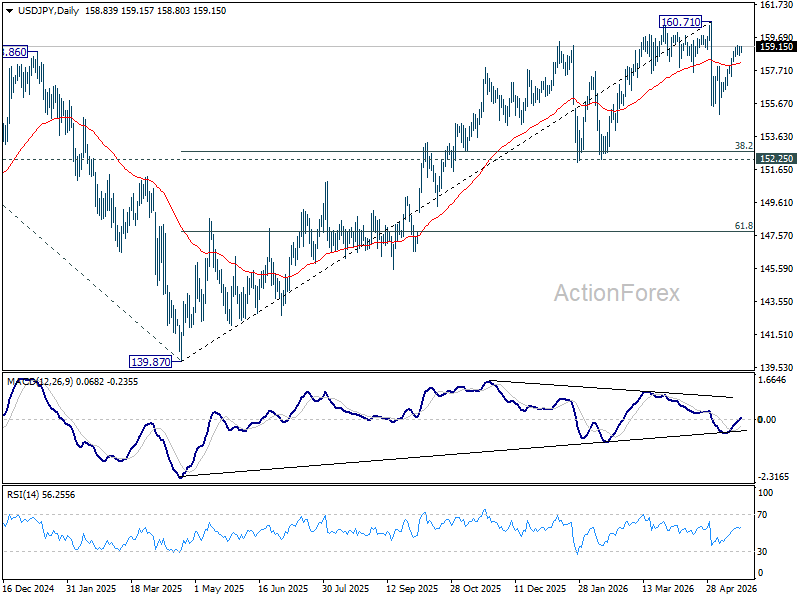
In the bigger picture, for now, corrective pattern from 161.94 (2024 high) is still seen as completed at 139.87. Rise from there is seen as resuming the long term up trend. So, break of 161.94 is expected at a later stage to resume the long term up trend. However, sustained break of 55 W EMA (now at 154.36) will dampen this view and bring deeper fall back towards 139.87 to extend the pattern from 161.94.
GBP/USD Daily Outlook
No change in GBP/USD's outlook and intraday bias stays neutral. Further fall is expected as long as 55 4H EMA (now at 1.3450 holds. Below 1.3300 will target a retest on 1.3158 support first. However, sustained break of the EMA will dampen the bearish case and turn bias back to the upside for 1.3657 resistance instead.
In the bigger picture, current development suggests that price actions from 1.3867 are merely a corrective pattern within the broader up trend from 1.0351 (2022 low). With 1.3008 support intact, medium term bullishness is maintained and break of 1.3867 is in favor for a later stage, towards 1.4248 key resistance (2021 high). However, firm break of 1.3008 will at least bring deeper fall to 38.2% retracement of 1.0351 to 1.3867 at 1.2524, with increased risk of bearish reversal.
USD/CHF Daily Outlook
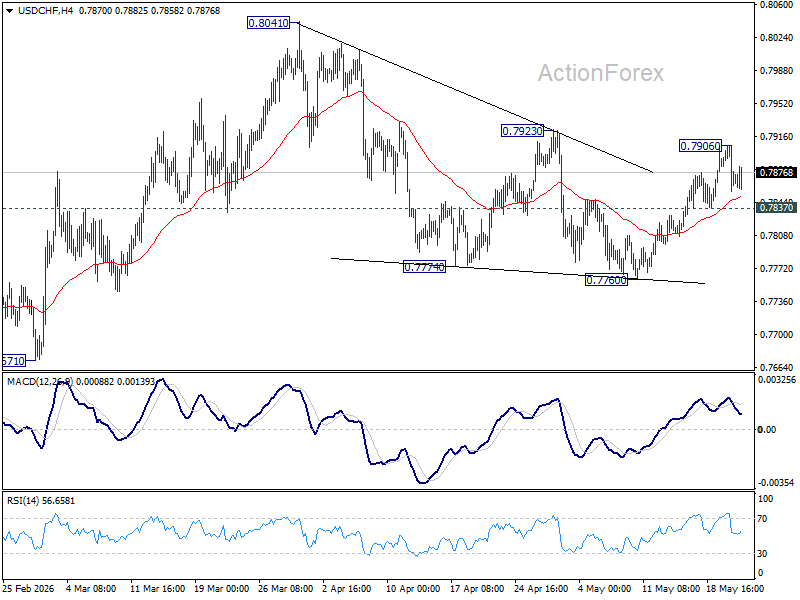
Intraday bias in USD/CHF is turned neutral again with current retreat. Further rise is in favor as long as 0.7837 support holds. Firm break of 0.7923 resistance will argue that fall from 0.8041 has completed as a three wave correction, and bring further rise to retest this high. However, break of 0.7837 will turn bias back to the downside for 0.7760 support instead.
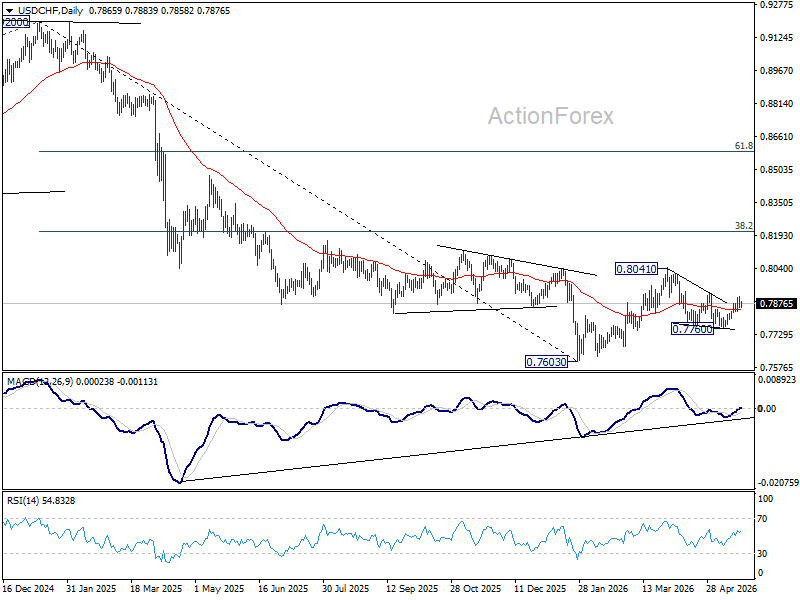
In the bigger picture, as long as 55 W EMA (now at 0.8035) holds, fall from 0.9200 is expected to continue, as part of the larger down trend. Firm break of 0.7603 will target 100% projection of 1.0146 (2022 high) to 0.8332 from 0.9200 at 0.7382.
AUD/USD Daily Report
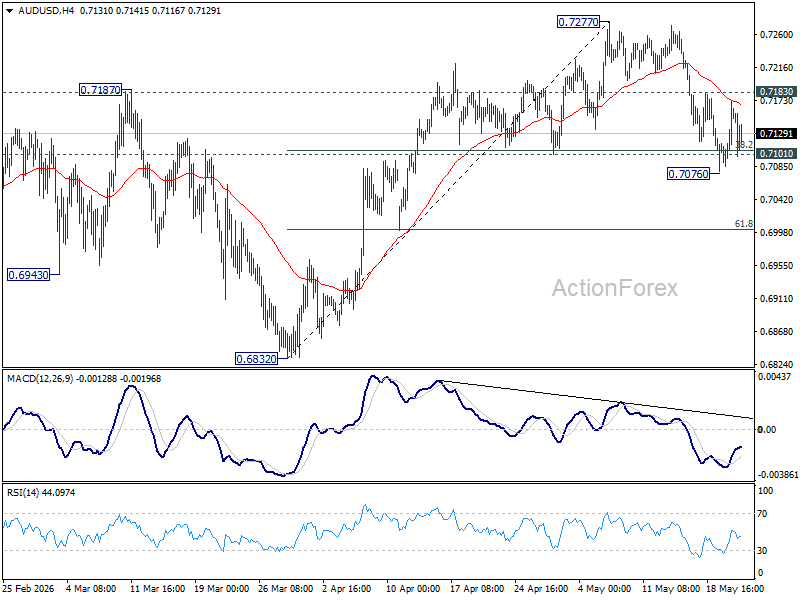
Intraday bias in AUD/USD remains neutral for the moment. On the upside, above 0.7183 minor resistance will suggest that pullback from 0.7277 has completed. Intraday bias will be back on the upside for retesting this high. However, decisive break of 0.7076 will bring deeper decline back towards 0.6832 support.
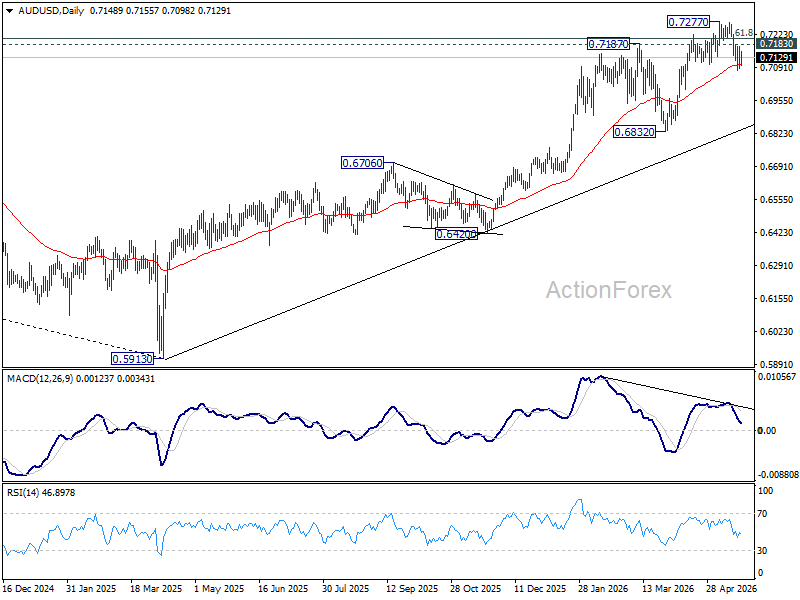
In the bigger picture, rise from 0.5913 (2024 low) is still in progress. Decisive break of 61.8% retracement of 0.8006 to 0.5913 at 0.7206 will solidify the case that it's already reversing the down trend from 0.8006 (2021 high). Further rally should then be seen to retest 0.8006. For now, outlook will remain bullish as long as 0.6832 support holds, in case of pullback.
USD/CAD Daily Outlook
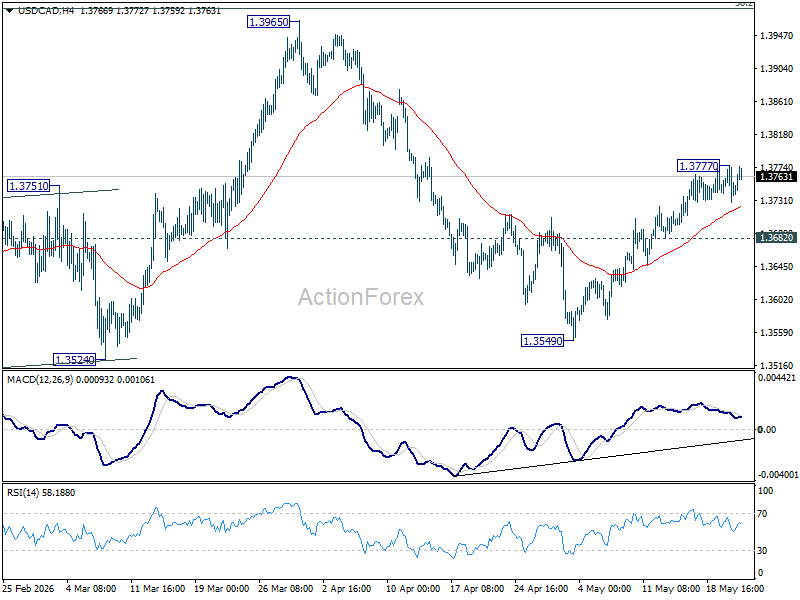
Intraday bias in USD/CAD is turned neutral with current retreat. Further rise is mildly in favor as long as 1.3682 support holds. Rebound from 1.3549 is seen as the third leg of the corrective pattern from 1.3480. Above 1.3777 will target 1.3965 resistance. Nevertheless, break of 1.3682 will turn bias back to the downside for 1.3549 support instead.
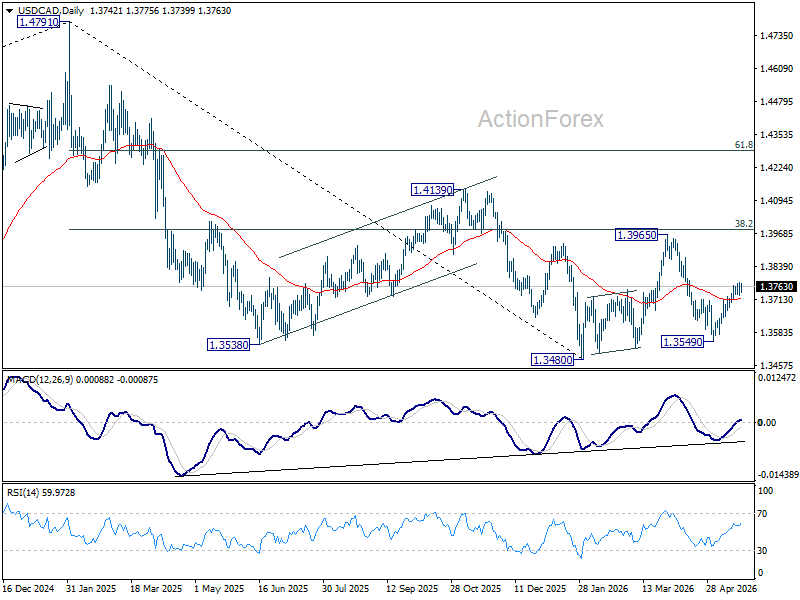
In the bigger picture, price actions from 1.4791 are seen as a corrective pattern to the whole up trend from 1.2005 (2021 low). Deeper fall could be seen, as the pattern extends, to 61.8% retracement of 1.2005 to 1.4791 at 1.3069. However, decisive break of 38.2% retracement of 1.4791 to 1.3480 at 1.3981 will argue that the correction has completed with three waves down to 1.3480 already.
GBP/JPY Daily Outlook
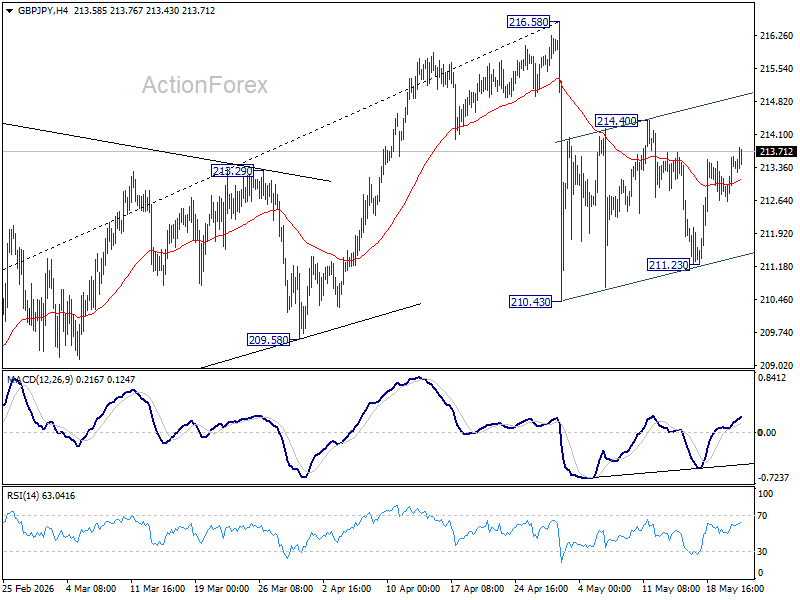
Range trading continues in GBP/JPY and intraday bias stays neutral. Consolidations from 210.43 is extending with another rising leg. On the downside, firm break of 210.43 will resume the corrective fall from 21658. However, sustained break of 214.40 will bring stronger rise back to retest 216.58 high instead.
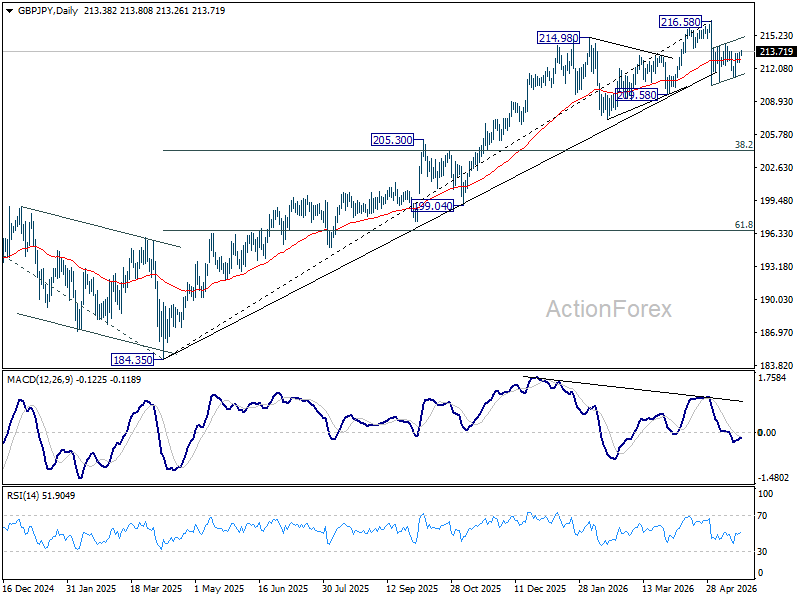
In the bigger picture, while the fall from 216.58 is steep, there is no clear sign of trend reversal yet. The long term up trend could still extend to 61.8% projection of 148.93 (2022 low) to 208.09 (2024 high) from 184.35 at 220.90 on resumption. However, sustained break of 55 W EMA (now at 205.91) will argue that it's already in medium term down trend for 184.35 support.
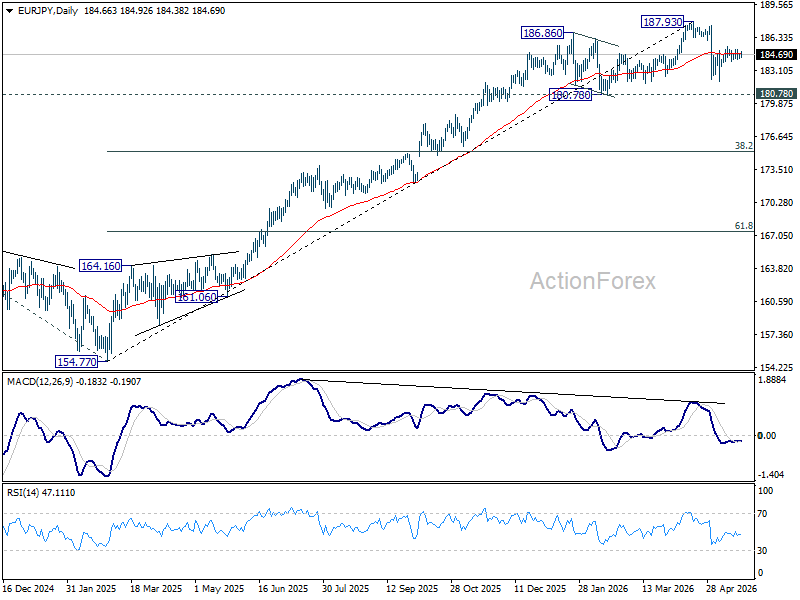
EUR/JPY Daily Outlook
EUR/JPY is still bounded in sideway trading below 185.44 and intraday bias remains neutral. As noted before, pullback from 187.93 could have completed at 182.01 already. Further rise is in favor as long as 184.02 minor support holds. Above 185.44 will target a retest on 187.93 high. Nevertheless, break of 184.02 minor support will turn bias back to the downside towards 182.01 again.
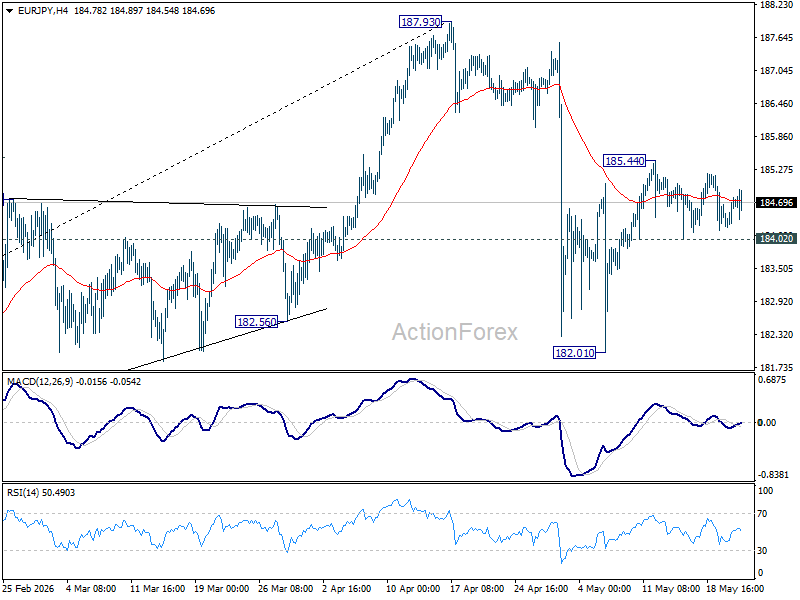
In the bigger picture, the pullback from 187.93 is steep, there is no sign of reversal yet. Uptrend from 114.42 is still expected to resume at a later stage to 78.6% projection of 124.37 (2022 low) to 175.41 (2025 high) from 154.77 at 194.88. However, sustained break of 55 W EMA (now at 178.27) will argue that it's already in a medium term down trend to 175.41 resistance turned support and below.