
Sample Category Title
Fed Minutes Show Hawks Gaining Ground as Inflation and Oil Shock Shake Policy Outlook
The Federal Reserve’s April meeting minutes revealed a central bank increasingly divided over how long interest rates may need to stay elevated as inflation risks tied to tariffs and the Middle East conflict continue building. The meeting exposed one of the sharpest internal policy splits in decade, with four dissenters and underscored the growing influence of hawkish officials ahead of the leadership transition from Jerome Powell to Kevin Warsh.
The key debate centered on the Fed’s policy language itself. Minutes showed that “ many participants indicated that they would have preferred removing the language from the postmeeting statement that suggested an easing bias regarding the likely direction of the Committee's future interest rate decisions,” signaling growing discomfort with maintaining wording that markets could interpret as preparing for future cuts.
Several officials argued that inflation dynamics were no longer evolving consistently with eventual easing, with the committee noting that “some policy firming would likely become appropriate if inflation were to continue to run persistently above 2 percent.” The discussion reinforced the sense that the Fed is rapidly drifting away from a rate-cut mindset toward a higher-for-longer framework.
Behind the shift was a combination of sticky inflation, elevated oil prices, and persistent labor market resilience. Officials warned that elevated energy prices and tariffs could result in "inflation pressures becoming embedded more broadly,” potentially creating more durable wage and pricing pressures across the economy.
Although a small group of policymakers still believed rate cuts could become appropriate later this year if geopolitical tensions faded quickly, the broader committee appeared increasingly concerned that the current policy stance may need to remain in place “for longer than anticipated” as the inflation shock proves more persistent.
(FED) Minutes of the Federal Open Market Committee
April 28–29, 2026
A joint meeting of the Federal Open Market Committee and the Board of Governors of the Federal Reserve System was held in the offices of the Board of Governors on Tuesday, April 28, 2026, at 10:00 a.m. and continued on Wednesday, April 29, 2026, at 9:00 a.m.1
Developments in Financial Markets and Open Market Operations
The manager turned first to an overview of market developments during the intermeeting period. The conflict in the Middle East had continued to be a key factor driving asset price movements. Equity prices had more than reversed their earlier declines, while 2-year and 10-year Treasury yields rose a bit further over the intermeeting period, as did near-term inflation compensation. In foreign exchange markets, the U.S. dollar retraced some of its previous appreciation.
The manager observed that the crude oil futures curve was higher than the curve prevailing at the time of the March FOMC meeting. The curve remained steeply downward sloping, consistent with investor expectations of oil prices falling considerably in coming months. The manager noted, however, that the curve's forecasting record was mixed.
Next, the manager discussed the recent behavior of inflation expectations. Near-term inflation expectations, as reported in the Open Market Desk Survey of Market Expectations (Desk survey), had again moved up, though expectations for 2027 and beyond were little changed. The survey results and market-based measures of inflation compensation pointed to longer-term expectations remaining well anchored near the Committee's 2 percent longer-run inflation objective.
On monetary policy expectations, the manager noted that market-implied expectations still indicated that market participants anticipated little change this year in the target range for the federal funds rate, and options prices implied around a 30 percent probability of a rate hike by the first quarter of 2027. In the Desk survey, the median of the modal paths continued to show two 25 basis point rate reductions over the next year, but respondents now expected them to occur later than in the previous survey, with rate cuts expected in the third or fourth quarter of 2026 and the first quarter of 2027.
Nominal Treasury yields had risen modestly further over the intermeeting period. A model-based decomposition of changes suggested that the increase in the two-year nominal yield since the start of the conflict in the Middle East reflected a sizable increase in expected inflation, offset to some degree by a decline in the expected real interest rate, a combination consistent with the realization of an adverse supply shock. A decomposition of the 10-year yield suggested a much smaller increase in expected inflation, alongside an increase in risk premiums. Liquidity conditions in Treasury securities markets had remained favorable even at times of increased volatility.
The manager next considered equity market developments. Perceived de-escalation in the Middle East conflict boosted risk sentiment over the intermeeting period, but equity price increases had also been underpinned by strong earnings expectations. After underperforming earlier in 2026, technology-sector stocks recorded the strongest price gains over the period.
In discussing credit markets, the manager noted that the private credit sector continued to receive attention over the intermeeting period. Although redemption requests continued, there were some signs of stabilization or slight improvement in investor sentiment, as evidenced, for example, by somewhat tighter credit spreads and higher equity prices of business development companies active in the sector.
With regard to international developments, the manager noted that, as in the U.S. case, two-year sovereign yields in advanced foreign economies (AFEs) had declined from their late-March peaks but remained above values prevailing before the start of the conflict. Market contacts mostly attributed the rise in short-dated nominal yields to increases in inflation compensation induced by higher energy prices and related upward shifts in the expected policy rate path across regions.
The manager observed that the foreign exchange value of the U.S. dollar had retraced much of its initial appreciation in March, though it remained higher than before the start of the conflict. The improvement in sentiment following the cease-fire in the Middle East conflict that was announced in the first half of April was cited as an important driver of the dollar depreciation.
The manager observed that money market conditions had been largely stable over the intermeeting period. The effective federal funds rate (EFFR) had remained 1 basis point below the interest on reserve balances (IORB) rate. Repurchase agreement (repo) rates remained very close to the IORB rate on average. The quarter-end date and the April tax date were not associated with significant money market pressures. The overnight reverse repurchase agreement (ON RRP) facility generally saw minimal usage over the intermeeting period. Excluding trades related to participation requirements, usage of standing repurchase agreement (SRP) operations was limited to the key tax date of April 15. Repeating the pattern observed in recent months, SRP usage on that date occurred even though interdealer repo rates were only slightly above the SRP rate. The manager took this pattern as indicating a greater willingness of counterparties to use the operations when they judged doing so to be economically sensible. Surveys taken of counterparties also pointed to this conclusion. The stability of the EFFR and repo rates at values close to the IORB rate as well as the limited ON RRP and SRP usage were consistent with the supply of reserves remaining in the ample range. This assessment was consistent with the behavior of various indicators of reserve conditions.
The manager turned next to recent developments related to the Federal Reserve's balance sheet. The decline in reserve balances induced by April's tax payments and the associated increase in the Treasury General Account balance had been large and steep but close to the Desk's expectations. The drop in reserves had occurred alongside orderly money market behavior, consistent with reserve management purchases (RMPs) helping to maintain a state of ample reserves.
The manager concluded by providing information about operational tests and utilization of foreign exchange swap lines between the Federal Reserve and foreign central banks. The manager remarked that the standing swap lines were key liquidity backstops that provided significant benefits. As this meeting was the usual time to renew these arrangements, the staff recommended that the Committee maintain the standing U.S. dollar and foreign currency liquidity swap arrangements that the Federal Reserve had with five other central banks and renew the North American Framework Agreement arrangements with the Bank of Canada and the Bank of Mexico. Finally, the manager observed that the Desk began conducting securities lending operations on FedTrade Plus on April 22, as part of the transition to this new trading platform.
The Committee voted unanimously to renew the dollar and foreign currency liquidity swap arrangements with the Bank of Canada, the Bank of England, the Bank of Japan, the European Central Bank, and the Swiss National Bank. In addition, the Committee voted unanimously to renew the reciprocal currency arrangements with the Bank of Canada and the Bank of Mexico; these arrangements are associated with the Federal Reserve's participation in the North American Framework Agreement of 1994. The votes to renew the Federal Reserve's participation in these standing arrangements occur annually at the April or May FOMC meeting.
By unanimous vote, the Committee ratified the Desk's domestic transactions over the intermeeting period. There were no intervention operations in foreign currencies for the System's account during the intermeeting period.
Staff Review of the Economic Situation
The information available at the time of the meeting indicated that inflation remained elevated and had moved higher, led by a sharp increase in energy prices. Labor market conditions had stabilized, and real gross domestic product (GDP) continued to expand.
Total consumer price inflation—as measured by the 12‑month change in the price index for personal consumption expenditures (PCE)—was 2.8 percent in February; core PCE price inflation, which excludes changes in consumer energy prices and many consumer food prices, was 3.0 percent. Both total and core inflation were similar to their levels a year earlier. Core goods price inflation had risen relative to a year earlier, a development that the staff largely attributed to the effects of higher tariffs. Core services price inflation had declined over that period, with the housing component increasing at a slower pace. Based on data from the consumer and producer price indexes, the staff estimated that total PCE price inflation rose to 3.5 percent in March, boosted by a sharp increase in energy prices; March core PCE price inflation was estimated to be 3.2 percent.
The unemployment rate was 4.3 percent in March and had changed little, on net, since the middle of the previous year. Nonfarm payroll employment rose sharply in March after having been depressed in February by a strike in the health-care sector and unusually harsh winter weather; smoothing through this volatility, job gains had remained low on average. The 12-month change in average hourly earnings was 3.5 percent in March, 0.7 percentage point below its year-earlier pace.
Available indicators suggested that real GDP growth picked up in the first quarter as the effects of the federal government shutdown unwound. Trade data through March suggested that net exports were a significant drag on U.S. GDP growth in the first quarter: Goods exports rebounded sharply from their decline in the fourth quarter of 2025, but goods imports rose even more sharply, driven by gains in high-tech goods imports. Real private domestic final purchases—which comprises PCE and private fixed investment and which often provides a better signal of underlying economic momentum than real GDP—appeared to have risen in the first quarter at a rate that was a little faster than the average pace seen over the preceding year.
Economic activity abroad appeared to have expanded at a moderate pace in the first quarter. Continued strong demand for high-tech goods supported Asian exports. Growth in China also appeared solid, supported by strong external demand and a moderate recovery in domestic demand. By contrast, activity in Mexico was held down by continued weakness in the automotive sector. Recent survey data pointed to strains from the conflict in the Middle East, with European and Asian firms reporting a notable lengthening of supplier delivery times and a surge in input prices.
Foreign headline inflation had generally been running close to central bank targets, but incoming March data pointed to a marked rise in inflation abroad driven by the run-up in energy prices. Over the intermeeting period, most foreign central banks kept their policies on hold, emphasizing the uncertainty around the Middle East conflict. An exception was the Bank of Mexico, which cut its policy rate 25 basis points in late March.
Staff Review of the Financial Situation
Over the intermeeting period, the market-implied expected path of the federal funds rate moved up modestly, showing only a slight decline over the remainder of the year. The higher expected policy rate path was driven in part by investor concerns about the potential for near-term inflationary pressures due to the conflict in the Middle East. While both market- and survey-based measures of inflation expectations indicated upside risks to the near-term inflation outlook, measures of medium- and longer-term inflation expectations remained well anchored.
Despite geopolitical uncertainty and realized volatility, broad equity price indexes increased, on net, over the intermeeting period, supported by benign data on economic activity and overall strong corporate earnings releases. The one-month option-implied volatility on the S&P 500 index declined moderately to end the period around the median of its historical distribution. Corporate bond spreads narrowed across sectors and rating classes and moved broadly with equity prices over the period.
Asset prices in foreign financial markets experienced large swings and remained highly sensitive to news about the conflict in the Middle East. Investor concerns rose early in the period as the conflict escalated and waned after the announcement of a cease-fire. On net, improved market risk sentiment weighed on the exchange value of the dollar and boosted foreign equity prices. Optimism related to artificial intelligence (AI) also contributed to the rise in foreign equity prices. Short-term inflation compensation measures and market-based policy expectations moved higher in AFEs, most notably in Europe. Emerging market economies saw modest capital outflows, on net, concentrated in countries dependent on energy imports from the Middle East.
Conditions in U.S. short-term funding markets remained orderly, supported by ongoing RMPs. The EFFR was unchanged over the intermeeting period, and rates in secured markets declined, on average, exhibiting only modest pressures over March quarter-end. On the April 15 tax date, secured funding market rates rose somewhat as reserves declined sharply, and there was modest take-up of SRP operations.
Financing conditions in domestic credit markets remained somewhat restrictive for small businesses and households but were generally accommodative for larger businesses and municipalities. Borrowing costs were little changed in most sectors and remained elevated relative to their average levels since the Global Financial Crisis (GFC).
Credit continued to be generally available to most businesses, households, and municipalities. Bank lending continued to expand, and issuance of corporate bonds was robust—in part due to a pickup in speculative-grade bond issuance for the financing of AI capital expenditures—whereas issuance of private credit loans slowed somewhat. By contrast, credit conditions remained somewhat tight for small businesses and mortgage borrowers with lower credit scores. Issuance of municipal bonds was strong.
In the April Senior Loan Officer Opinion Survey on Bank Lending Practices (SLOOS), banks reported further easing in lending standards in the first quarter, particularly for consumer loans.2 The overall level of bank lending standards aggregated across loan categories was estimated to be around the median level observed since 2011.
Credit performance remained solid in most markets. The 12-month trailing default rate on nonfinancial corporate bonds remained near the 25th percentile of its post-GFC range. Although the default rate for leveraged loans remained elevated, market-implied measures of year-ahead expected defaults were below the median of their post-GFC distributions. For direct private credit borrowers, default rates remained low through March, but payment-in-kind continued to be used to defer interest payments in the fourth quarter of 2025, particularly in the software industry. The credit performance of loans to medium-sized and large businesses and municipalities remained solid, and the credit performance of municipal bonds remained strong. Conversely, credit performance of small business loans and commercial mortgage-backed securities continued to be somewhat weak, and delinquency rates for mortgages insured by the Federal Housing Administration and consumer loans remained elevated.
The staff provided an updated assessment of the stability of the U.S. financial system and, on balance, continued to characterize the system's financial vulnerabilities as notable. The staff judged that asset valuation pressures were elevated. Measures of housing valuations were near historical highs.
Vulnerabilities associated with nonfinancial business and household debt were characterized as moderate. Household balance sheets were strong, with significant home equity. Although aggregate business debt growth had been subdued in recent years, private credit had grown rapidly. Some private credit vehicles experienced net outflows in the first quarter amid credit quality concerns caused in part by the potential for AI to disrupt business models in some industries, notably software.
Vulnerabilities associated with leverage in the financial sector were characterized as notable. Leverage at hedge funds remained high, most notably for leveraged Treasury market trades. Life insurers' leverage also remained elevated. By contrast, bank regulatory capital ratios remained high relative to historical levels. Banks' market-adjusted capital ratios, however, ticked down in the first quarter and stayed below levels seen before 2022, though they remain notably above their lows from a few years ago. Banks' asset duration had declined to pre-pandemic levels, indicating a more moderate exposure to interest rate risk relative to recent years.
Vulnerabilities associated with funding risks were characterized as moderate. Banks' reliance on uninsured deposits was low relative to the period of banking-sector stress in 2023.
Staff Economic Outlook
The staff's outlook for economic activity was slightly stronger than the one prepared for the March meeting. Real GDP was projected to slightly outpace potential in coming years, with growth supported by favorable financial conditions, continued gains in AI-related capital spending, and a reversal of some of the factors that were expected to weigh on activity this year, including weak foreign growth and uncertainty about the outlook. The unemployment rate was expected to remain close to the staff's estimate of its longer-run rate this year and next before edging slightly below it in 2028.
The staff's inflation forecast for this year was higher than the one prepared for the March meeting, reflecting incoming data, higher energy prices, and other effects of the Middle East conflict that were expected to add to consumer price inflation. Inflation was projected to slow after the first half of this year as the economic effects of the various conflict-related factors dissipated and as the pass-through of higher tariffs to inflation waned; by the end of next year, inflation was expected to be close to 2 percent.
The staff continued to view the uncertainty around the projection as elevated in light of the conflict in the Middle East and the potential economic consequences of AI adoption. On balance, risks to the forecasts for employment and real GDP growth were seen as tilted to the downside. Risks to the inflation projection were seen as skewed to the upside: With inflation having run significantly above 2 percent over the past five years, with further increases in inflation likely to occur as a result of the conflict in the Middle East, and with emergent price pressures in a few categories that appeared unrelated to tariffs or energy prices, the staff viewed the possibility that inflation would be more persistent than anticipated as a salient risk.
Participants' Views on Current Conditions and the Economic Outlook
Participants observed that overall inflation had moved up, in part because of recent global energy price increases, and remained above the Committee's 2 percent longer-run goal. Participants generally noted that core inflation had also moved further above 2 percent. Several participants noted that the rate of increase in core goods prices remained elevated, at least in part reflecting the effects of tariffs. Some participants observed that higher fuel prices had caused a number of other prices to increase, including shipping costs and airfares. In addition to energy price increases, several participants noted that supply disruptions associated with the conflict in the Middle East had caused prices for fertilizer and some other non-energy commodities to rise. Some participants noted that recent price increases in the information technology sector had contributed to higher inflation. A few of these participants remarked that, while price increases in the software category were contributing meaningfully to the increase in core inflation, price increases in that category may not be good predictors of future overall inflation.
Most participants noted that measures of longer-term inflation expectations remained stable. Some participants observed that measures of near-term inflation expectations had risen recently, likely reflecting the recent rise in global energy prices.
Participants anticipated that high energy prices would continue to put upward pressure on overall inflation in the near term. Participants generally expected that the effects of tariffs on core goods inflation would diminish over the course of this year. Some participants noted, however, that tariff rates could be increased above present levels, leading to additional upward pressure on inflation. Several participants anticipated that higher productivity growth would put downward pressure on inflation, and a few of those participants remarked that the ongoing deceleration in housing services prices was likely to continue to be a source of disinflationary pressure. Several participants observed that price pressures associated with strong AI investment expenditures would likely raise input costs for a range of industries. Several participants highlighted the possibility that, after several years of inflation above 2 percent, elevated inflation rates could begin to have an increased effect on wage- and price-setting decisions. Almost all participants noted that there was a risk that the conflict in the Middle East could persist for an extended period or that, even after the conflict ended, the prices of oil and other commodities could remain elevated for longer than expected. In such scenarios, these participants expected continued upward pressure on inflation arising from supply chain disruptions, high energy prices, or the pass-through of higher input costs to other prices. The vast majority of participants noted an increased risk that inflation would take longer to return to the Committee's 2 percent objective than they had previously expected.
With regard to the labor market, participants observed that the unemployment rate had been little changed in recent months, while job gains had remained low on average. Most participants judged that recent data, such as readings on the unemployment rate, layoffs, hiring, and labor force growth, suggested stabilization in the labor market. Several participants commented that the recent low rates of job growth were not necessarily indicative of labor market fragility, as they could be roughly commensurate with the recent slow growth in the labor force. A few participants, however, pointed to the possibility that the low rates of job growth were a sign of labor market fragility. Some participants noted some signs of potential softness in the labor market, including the concentration of job growth in only a few sectors, declines in recent months in survey measures of job availability, and the modest rate of wage growth.
Participants generally expected labor market conditions to remain stable in the near term. Most participants judged, however, that risks to the employment side of the Committee's dual mandate were tilted to the downside. Several participants cited evidence reported by business contacts suggesting that firms were likely to delay or reduce hiring because of overall economic uncertainty or in anticipation of adopting AI technologies. Several participants pointed to the possibility that a fall in labor demand could push the unemployment rate sharply higher.
Participants generally observed that economic activity appeared to be expanding at a solid pace. Most participants noted that business fixed investment remained robust, largely reflecting strength in the technology sector. Participants generally observed that consumer spending had been resilient. Many participants pointed to specific factors that were supporting consumer spending, including high levels of household wealth and fiscal policy. Some participants commented that higher energy prices were putting strains on households, particularly lower-income households. Several participants noted that consumer sentiment had been low. With regard to the agricultural sector, a few participants remarked that high fuel and fertilizer prices were headwinds for farmers.
Participants generally anticipated that the pace of real GDP growth would remain solid this year. Many participants pointed to specific factors supporting growth in economic activity, including AI-related business fixed investment, productivity gains, financial conditions, fiscal policy, and changes in regulatory policy. Several participants remarked that the effects on economic activity of the recent increase in oil prices may be smaller than those seen in the past, citing factors such as the relatively large amount of current domestic oil production or the relatively low share of current domestic spending on oil. Most participants remarked that the developments in the Middle East had contributed to the uncertainty surrounding the outlook for economic activity, and several of these participants also noted that business contacts had emphasized heightened uncertainty about the economic outlook.
In their discussion of financial stability, several participants noted that asset valuations remained elevated and that such conditions heightened the possibility of sharp corrections should adverse developments materialize. Many participants commented on developments in the private credit sector. Some participants noted that recent investor withdrawals from certain private credit funds did not appear to pose risks to the broader financial system, although they judged that data limitations on balance sheet exposure of many private credit vehicles made such an assessment difficult. Some participants expressed concerns that losses in this sector could spill over to other markets, causing a broad credit contraction, or that firms dependent on private credit could face challenges securing alternative financing sources should investor sentiment in the private credit sector deteriorate further. A few participants highlighted risks associated with the substantial participation of hedge funds in the market for U.S. Treasury securities, noting that the unwinding of leveraged positions by these institutions could generate broader financial market disruption. A couple of participants discussed the implications of recent proposals to revamp the regulatory framework applying to both smaller and larger banks. Many participants mentioned the importance of addressing cybersecurity risks. Several of these participants discussed cybersecurity threats associated with rapid developments in AI technologies and commented that hostile cyber intrusions at systemically important financial firms or essential market infrastructure could materially impair financial system operations. These participants also emphasized the importance of collaborative approaches among regulatory agencies and financial institutions to mitigate cybersecurity risks. Some participants discussed ongoing and potential operational improvements related to various liquidity tools used to support the implementation of monetary policy and the stability of the financial system, including the discount window, SRP operations, and the standing liquidity swap arrangements. A few participants commented on the possibility that the Committee could consider extending the terms of swap lines beyond one year, noting that a longer extension would be beneficial for financial stability.
In their consideration of monetary policy at this meeting, participants observed that inflation was elevated relative to the Committee's 2 percent longer-run objective, in part reflecting the recent increase in global energy prices. Participants generally further noted that recent indicators suggested that economic activity had been expanding at a solid pace. They also observed that job gains had remained low, on average, and that the unemployment rate had been little changed in recent months. Participants agreed that developments in the Middle East were contributing to a high level of uncertainty about the economic outlook. Against this backdrop, almost all participants supported maintaining the current target range for the federal funds rate at this meeting. Participants generally judged that the current policy rate was within the range of plausible estimates of its neutral level and that the Committee still remained well positioned to base the extent and timing of adjustments to the policy rate on incoming data, the evolving outlook, and the balance of risks. They remarked that holding the policy rate steady would allow the Committee to gather additional information on how developments in the Middle East and other factors were affecting the economic outlook before determining whether adjustments to the policy rate would be warranted. One participant preferred to lower the target range for the federal funds rate 25 basis points, noting concerns that the current policy stance was overly restrictive in a situation of downside risks to the labor market.
With regard to the outlook for monetary policy, participants generally judged that the continued elevated inflation readings together with uncertainty related to the duration and economic implications of the Middle East conflict could necessitate maintaining the current policy stance for longer than previously anticipated. Several participants highlighted that it would likely be appropriate to lower the target range for the federal funds rate once there are clear indications that disinflation is firmly back on track or if solid signs emerge of greater weakness in the labor market. A majority of participants highlighted, however, that some policy firming would likely become appropriate if inflation were to continue to run persistently above 2 percent. To address this possibility, many participants indicated that they would have preferred removing the language from the postmeeting statement that suggested an easing bias regarding the likely direction of the Committee's future interest rate decisions. Participants noted that monetary policy was not on a preset course and that future policy decisions would be made on a meeting-by-meeting basis.
In discussing risk-management considerations bearing on the outlook for monetary policy, participants assessed that both upside risks to inflation and downside risks to employment remained elevated. Participants generally observed that the conflict in the Middle East could have significant implications for the balance of these risks and for the appropriate path of monetary policy. Several participants indicated that, in a scenario in which the conflict was resolved soon, rate reductions would be warranted later this year if the effects of higher tariffs and energy prices on inflation were to dissipate in line with their expectations. Some participants expressed concerns, however, about a scenario in which sustained elevated energy prices, combined with the effects of tariffs, could result in inflation pressures becoming embedded more broadly, potentially de-anchoring inflation expectations and creating a greater tradeoff between the Committee's employment and inflation goals.
A few participants commented on issues related to the Federal Reserve's balance sheet and policy tools, including the role of SRP operations in the implementation of monetary policy and the connection between liquidity tools, liquidity regulations, and the demand for reserves.
Committee Policy Actions
In their discussions of monetary policy for this meeting, members agreed that recent indicators suggested that economic activity had been expanding at a solid pace. They noted that job gains had remained low, on average, and that the unemployment rate had been little changed in recent months. Members agreed that inflation was elevated, in part reflecting the recent increase in global energy prices, and that developments in the Middle East were contributing to a high level of uncertainty about the economic outlook. Members concurred that the Committee was attentive to the risks to both sides of its dual mandate.
In support of the Committee's goals, almost all members agreed to maintain the target range for the federal funds rate at 3-1/2 to 3-3/4 percent. One member voted against that decision and preferred to lower the target range by 1/4 percentage point. Nine members agreed that in considering the extent and timing of additional adjustments to the target range for the federal funds rate, the Committee would carefully assess incoming data, the evolving outlook, and the balance of risks. Three members would have preferred to provide a more two-sided characterization of the Committee's future interest rate decisions. Members agreed that the postmeeting statement should affirm their strong commitment both to supporting maximum employment and to returning inflation to the Committee's 2 percent objective.
Members agreed that in assessing the appropriate stance of monetary policy, the Committee would continue to monitor the implications of incoming information for the economic outlook. They would be prepared to adjust the stance of monetary policy as appropriate if risks emerged that could impede the attainment of the Committee's goals. Members also agreed that their assessments would take into account a wide range of information, including readings on labor market conditions, inflation pressures and inflation expectations, and financial and international developments.
At the conclusion of the discussion, the Committee voted to direct the Federal Reserve Bank of New York, until instructed otherwise, to execute transactions in the System Open Market Account in accordance with the following domestic policy directive, for release at 2:00 p.m.:
"Effective April 30, 2026, the Federal Open Market Committee directs the Desk to:
- Undertake open market operations as necessary to maintain the federal funds rate in a target range of 3-1/2 to 3-3/4 percent.
- Conduct standing overnight repurchase agreement operations at a rate of 3.75 percent.
- Conduct standing overnight reverse repurchase agreement operations at an offering rate of 3.5 percent and with a per-counterparty limit of $160 billion per day.
- Increase the System Open Market Account holdings of securities through purchases of Treasury bills and, if needed, other Treasury securities with remaining maturities of 3 years or less to maintain an ample level of reserves.
- Roll over at auction all principal payments from the Federal Reserve's holdings of Treasury securities. Reinvest all principal payments from the Federal Reserve's holdings of agency securities into Treasury bills."
The vote also encompassed approval of the statement below for release at 2:00 p.m.:
"Recent indicators suggest that economic activity has been expanding at a solid pace. Job gains have remained low, on average, and the unemployment rate has been little changed in recent months. Inflation is elevated, in part reflecting the recent increase in global energy prices.
The Committee seeks to achieve maximum employment and inflation at the rate of 2 percent over the longer run. Developments in the Middle East are contributing to a high level of uncertainty about the economic outlook. The Committee is attentive to the risks to both sides of its dual mandate.
In support of its goals, the Committee decided to maintain the target range for the federal funds rate at 3-1/2 to 3-3/4 percent. In considering the extent and timing of additional adjustments to the target range for the federal funds rate, the Committee will carefully assess incoming data, the evolving outlook, and the balance of risks. The Committee is strongly committed to supporting maximum employment and returning inflation to its 2 percent objective.
In assessing the appropriate stance of monetary policy, the Committee will continue to monitor the implications of incoming information for the economic outlook. The Committee would be prepared to adjust the stance of monetary policy as appropriate if risks emerge that could impede the attainment of the Committee's goals. The Committee's assessments will take into account a wide range of information, including readings on labor market conditions, inflation pressures and inflation expectations, and financial and international developments."
Voting for this action:Jerome H. Powell, John C. Williams, Michael S. Barr, Michelle W. Bowman, Lisa D. Cook, Philip N. Jefferson, Anna Paulson, and Christopher J. Waller.
Voting against this action: Stephen I. Miran, who preferred to lower the target range for the federal funds rate by 1/4 percentage point at this meeting and Beth M. Hammack, Neel Kashkari, and Lorie K. Logan, who supported maintaining the target range for the federal funds rate but did not support inclusion of an easing bias in the statement at this time.
Consistent with the Committee's decision to leave the target range for the federal funds rate unchanged, the Board of Governors of the Federal Reserve System voted unanimously to maintain the interest rate paid on reserve balances at 3.65 percent, effective April 30, 2026. The Board of Governors of the Federal Reserve System voted unanimously to approve the establishment of the primary credit rate at the existing level of 3.75 percent.
It was agreed that the next meeting of the Committee would be held on Tuesday–Wednesday, June 16–17, 2026. The meeting adjourned at 10:40 a.m. on April 29, 2026.
Notation Vote
By notation vote completed on April 7, 2026, the Committee unanimously approved the minutes of the Committee meeting held on March 17–18, 2026.
Attendance
Jerome H. Powell, Chair
John C. Williams, Vice Chair
Michael S. Barr
Michelle W. Bowman
Lisa D. Cook
Beth M. Hammack
Philip N. Jefferson
Neel Kashkari
Lorie K. Logan
Stephen I. Miran
Anna Paulson
Christopher J. Waller
Thomas I. Barkin, Mary C. Daly, Austan D. Goolsbee, Sushmita Shukla, and Cheryl L. Venable, Alternate Members of the Committee
Susan M. Collins, Alberto G. Musalem, and Jeffrey R. Schmid, Presidents of the Federal Reserve Banks of Boston, St. Louis, and Kansas City, respectively
Joshua Gallin, Secretary
Matthew M. Luecke, Deputy Secretary
Michelle A. Smith, Assistant Secretary
Mark E. Van Der Weide, General Counsel
Richard Ostrander, Deputy General Counsel
Trevor A. Reeve, Economist
Stacey Tevlin, Economist
Beth Anne Wilson, Economist
Stephanie R. Aaronson, Shaghil Ahmed, Brian M. Doyle, Michael T. Kiley, Elizabeth Klee, Edward S. Knotek II, and Andrea Raffo, Associate Economists
Roberto Perli, Manager, System Open Market Account
Julie Ann Remache, Deputy Manager, System Open Market Account
Jose Acosta, Senior System Engineer II, Division of Information Technology, Board
Ozge Akinci Emekli, Research Department Head, Federal Reserve Bank of New York
Gene Amromin, Senior Vice President, Federal Reserve Bank of Chicago
Philippe Andrade, Vice President, Federal Reserve Bank of Boston
Alyssa Arute,3 Assistant Director, Division of Reserve Bank Operations and Payment Systems, Board
Alessandro Barbarino, Special Adviser to the Board, Division of Board Members, Board
Becky C. Bareford, First Vice President, Federal Reserve Bank of Richmond
William F. Bassett, Senior Associate Director, Division of Financial Stability, Board
Michele Cavallo, Special Adviser to the Board, Division of Board Members, Board
Yao-Chin Chao,4 Associate Secretary, Office of the Secretary, Board
Satyajit Chatterjee, Vice President, Federal Reserve Bank of Philadelphia
Andrew Cohen,5 Special Adviser to the Board, Division of Board Members, Board
Lucy L. Cordes, Financial Institution Policy Analyst II, Division of Monetary Affairs, Board
Francisco Covas,4 Deputy Director, Division of Supervision and Regulation, Board
Stephanie E. Curcuru, Deputy Director, Division of International Finance, Board
Ryan A. Decker, Special Adviser to the Chair, Division of Board Members, Board
Sarah Devany, First Vice President, Federal Reserve Bank of San Francisco
Anthony M. Diercks, Special Adviser to the Board, Division of Board Members, Board
Burcu Duygan-Bump, Senior Associate Director, Division of Research and Statistics, Board
Giovanni Favara, Associate Director, Division of Monetary Affairs, Board
Laura J. Feiveson,6 Special Adviser to the Board, Division of Board Members, Board
Michele Taylor Fennell,7 Associate Secretary, Office of the Secretary, Board
Jenn Gallagher, Assistant to the Board, Division of Board Members, Board
Carlos Garriga, Senior Vice President, Federal Reserve Bank of St. Louis
Jonathan Glicoes, Senior Financial Institution Policy Analyst II, Division of Monetary Affairs, Board
Joseph W. Gruber, Executive Vice President, Federal Reserve Bank of Kansas City
François Henriquez, First Vice President, Federal Reserve Bank of St. Louis
Valerie S. Hinojosa, Section Chief, Division of Monetary Affairs, Board
Jane E. Ihrig, Special Adviser to the Board, Division of Board Members, Board
Benjamin K. Johannsen, Deputy Associate Director, Division of Monetary Affairs, Board
Kurt Kostyu,8 Capital Markets Trading Principal, Federal Reserve Bank of New York
Anna R. Kovner, Executive Vice President, Federal Reserve Bank of Richmond
Christopher J. Kurz, Assistant Director, Division of Research and Statistics, Board
Sylvain Leduc, Executive Vice President and Director of Economic Research, Federal Reserve Bank of San Francisco
Andreas Lehnert, Director, Division of Financial Stability, Board
Logan T. Lewis, Assistant Director, Division of International Finance, Board
Laura Lipscomb, Special Adviser to the Board, Division of Board Members, Board
Francesca Loria, Principal Economist, Division of Monetary Affairs, Board
Daniel Maddy-Weitzman,8 Policy and Market Analysis Principal, Federal Reserve Bank of New York
Patrick E. McCabe, Deputy Associate Director, Division of Research and Statistics, Board
Yvette McKnight,9 Senior Agenda Assistant, Office of the Secretary, Board
Mark Meder, First Vice President, Federal Reserve Bank of Cleveland
Norman J. Morin, Associate Director, Division of Research and Statistics, Board
David Na, Acting Group Manager, Division of Monetary Affairs, Board
Edward Nelson, Senior Adviser, Division of Monetary Affairs, Board
David Newville, Director, Division of Consumer and Community Affairs, Board
Anna Nordstrom, Head of Markets, Federal Reserve Bank of New York
Matthias Paustian, Assistant Director, Division of Research and Statistics, Board
Kristen Payne,8 Lead Financial Institution Policy Analyst, Division of Monetary Affairs, Board
Brian Phillips,5 Special Counsel, Legal Division, Board; Special Adviser to the Board, Division of Board Members, Board
Eugenio P. Pinto,10 Special Adviser to the Board, Division of Board Members, Board
Suraj Prasanna,8 Associate Director, Federal Reserve Bank of New York
Jeanne Rentezelas, First Vice President, Federal Reserve Bank of Philadelphia
Tim Schmidt-Eisenlohr,11 Principal Economist, Division of Financial Stability, Board
Samuel Schulhofer-Wohl, Senior Vice President, Federal Reserve Bank of Dallas
Zeynep Senyuz, Special Adviser to the Board, Division of Board Members, Board
Maneesha Shrivastava,8 Policy and Market Analysis Principal, Federal Reserve Bank of New York
John J. Stevens, Senior Associate Director, Division of Research and Statistics, Board
Paula Tkac, Director of Research, Federal Reserve Bank of Atlanta
Skander J. Van den Heuvel, Associate Director, Division of Financial Stability, Board
Annette Vissing-Jørgensen, Senior Adviser, Division of Monetary Affairs, Board
Jeffrey D. Walker,3 Senior Associate Director, Division of Reserve Bank Operations and Payment Systems, Board
Min Wei, Senior Associate Director, Division of Monetary Affairs, Board
Donielle A. Winford, Senior Information Manager, Division of Monetary Affairs, Board
Fabian Winkler, Group Manager, Division of Monetary Affairs, Board
Filip Zikes, Special Adviser to the Board, Division of Board Members, Board
_______________________
Joshua Gallin
Secretary
1. The Federal Open Market Committee is referenced as the "FOMC" and the "Committee" in these minutes; the Board of Governors of the Federal Reserve System is referenced as the "Board" in these minutes. Return to text
2. The SLOOS results reported are based on banks' responses, weighted by each bank's outstanding loans in the respective loan category, and might therefore differ from the results reported in the published SLOOS, which are based on banks' unweighted responses. Return to text
3. Attended through the discussion of developments in financial markets and open market operations. Return to text
4. Attended Tuesday's session only. Return to text
5. Attended the discussion of economic developments and the outlook. Return to text
6. Attended the discussion of the economic and financial situation through the end of the meeting. Return to text
7. Attended Wednesday's session only. Return to text
8. Attended through the discussion of economic developments and the outlook. Return to text
9. Attended through the discussion of economic developments and the outlook, and from the discussion of current monetary policy through the end of the meeting. Return to text
10. Attended through the discussion of developments in financial markets and open market operations, and from the discussion of the economic and financial situation through the end of the meeting. Return to text
11. Attended through the discussion of the economic and financial situation. Return to text
AUD/USD Picks Up Momentum Ahead of Australian Employment: In-Depth FX Analysis
In recent days, forex markets have seen a strong increase in activity, moving away from their earlier steady trends.
The confirmation of Kevin Warsh as the next Federal Reserve Chair added volatility, but today’s trading is mainly driven by a sharp drop in the US Dollar.
Before the recent moves in the US Dollar, antipodean currencies like the New Zealand Dollar and especially the Australian Dollar were already among the top performers, thanks to optimism around the Iran peace talks.
Today, that positive trend gained further support after President Trump announced that a diplomatic deal between the US and Iran is close to completion, easing geopolitical concerns.
This breakthrough is easing pressure on global energy supply chains and causing oil prices to fall.
As a result, the US Dollar is weakening because the risk of war-driven inflation is fading. Lower energy costs are especially good news for oil-importing countries in the Asia-Pacific, which helps explain why the Australian Dollar is leading today’s forex gains.
The AUD/USD pair is also benefiting from renewed global risk appetite.
Looking ahead, the focus is rapidly shifting to the critical Australian jobs report scheduled for later this evening.
The market expects 17.5K new jobs, a slight slowdown from last month’s 17.9K.
Overall, this slower growth is what the Reserve Bank of Australia wants after raising rates twice to cool the economy in recent meetings.
A gradual slowdown in the labor market gives the RBA more flexibility, but a miss could easily see a fast-paced correction in the pair's prior bounce.
The upcoming employment data will show if the Australian Dollar’s recent strength can continue.
AUD/USD Multi-Timeframe Analysis
Daily Chart
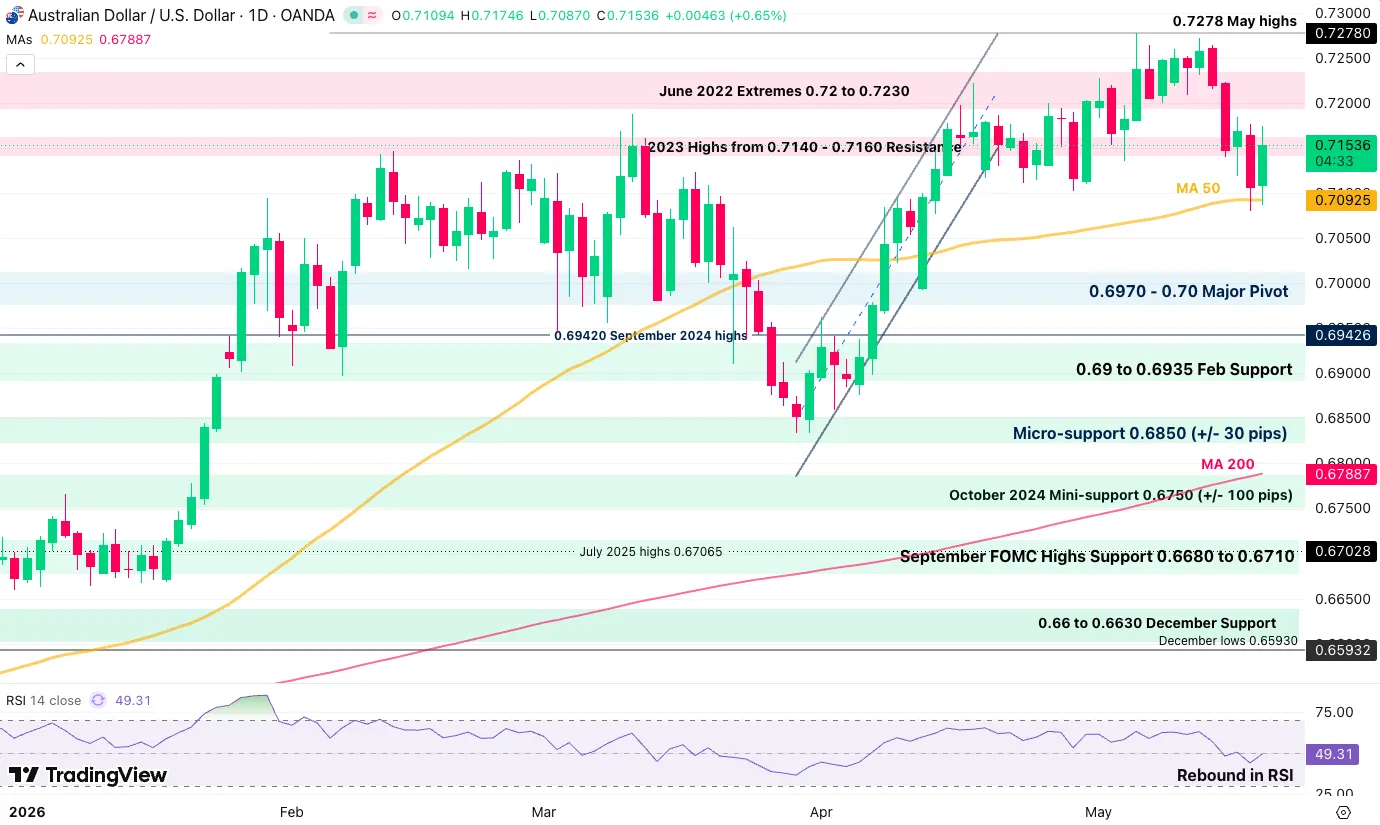
AUD/USD daily chart. Source: TradingView, May 20, 2026.
AUD/USD is rebounding quite strongly on its 50-day moving average, rebounding above 600 pips since.
The current daily candle still was not strong enough to extend beyond the previous one and form a bullish engulfing pattern. Hence, this shows some relative hesitancy from market participants.
Today's candle, however, offers great breakout levels:
- Any push on high volume and momentum above previous highs, 0.7175, should see continuation above 0.72.
- On the contrary, a push below the daily lows, 0.7090, and the 50-day MA could extend back towards 0.70.
4H Chart
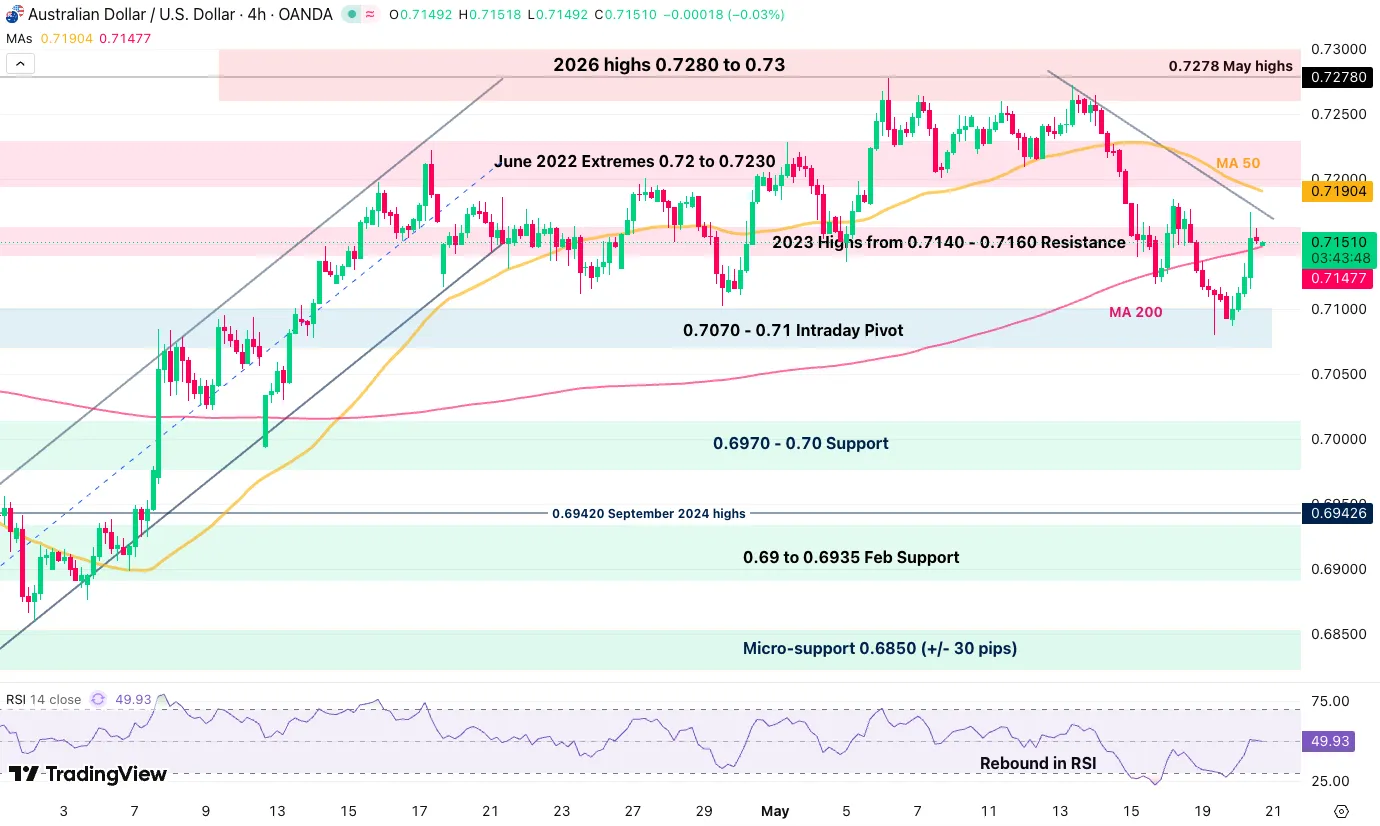
AUD/USD 4H chart. Source: TradingView, May 20, 2026.
Momentum is slowing down hard ahead of the key data release during the overnight session, with the action consolidating at the 4H 200-period MA, 0.71480.
Intraday buyers will want to see a break above today's highs, while sellers will want to see a clear push below the 200-MA.
Levels of interest for AUD/USD:
Resistance Levels
- 0.7175 daily highs
- 2023 highs from 0.7140 to 0.7160 resistance
- June 2022 extremes: 0.72 to 0.7230
- 2026 highs: 0.7280 to 0.73
- 0.7278 May and 2026 highs
Support Levels
- Daily lows: 0.7090
- 0.7070 to 0.71 intraday pivot
- 0.6970 to 0.70 support
- 0.69 to 0.6935 early February support
- 0.68340 war lows
1H Chart
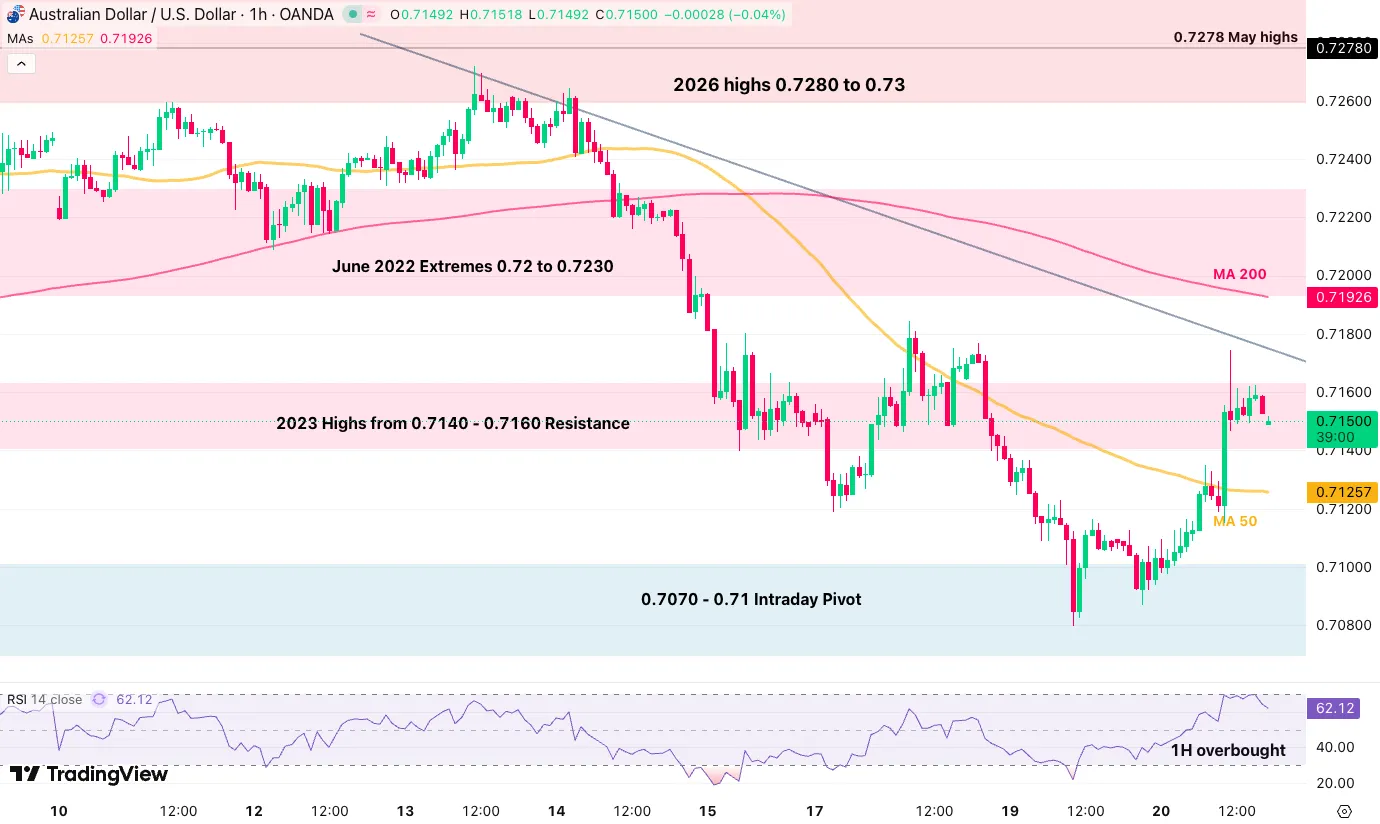
AUD/USD 1H chart. Source: TradingView, May 20, 2026.
The Aussie is pulling back from short-timeframe overbought conditions, with the action likely to stay put ahead of the data.
Watch for a potential test of the 50-hour MA ahead of the data releasing overnight.
Safe trades.
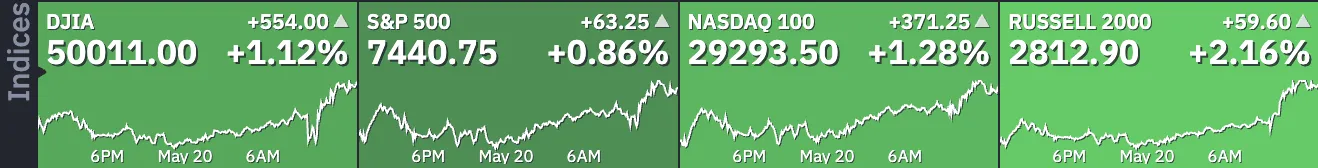
US-Iran Deal in Final Stages: Markets Are Exploding — Dow Jones, Nasdaq and S&P 500 Intraday Levels
- Stock markets are back on a happy ride after President Trump revealed that the US-Iran deal was in its final stages.
- Both the Nasdaq and the Dow Jones are taking a fast-speed route to new records.
- Exploring technical levels for the Dow Jones, Nasdaq and S&P 500.
Stock markets are surging today after President Trump announced that the United States and Iran are close to finishing intense diplomatic talks.
After several days of uncertainty, this breakthrough is giving a strong boost to global risk assets. The threat of war and worries about energy supplies are fading quickly, letting investors regain confidence in the markets.
This major diplomatic shift is having a big impact on the energy sector. WTI crude oil prices fell quickly on the news, dropping to around $97 before recovering a bit as traders adjusted their risk expectations.
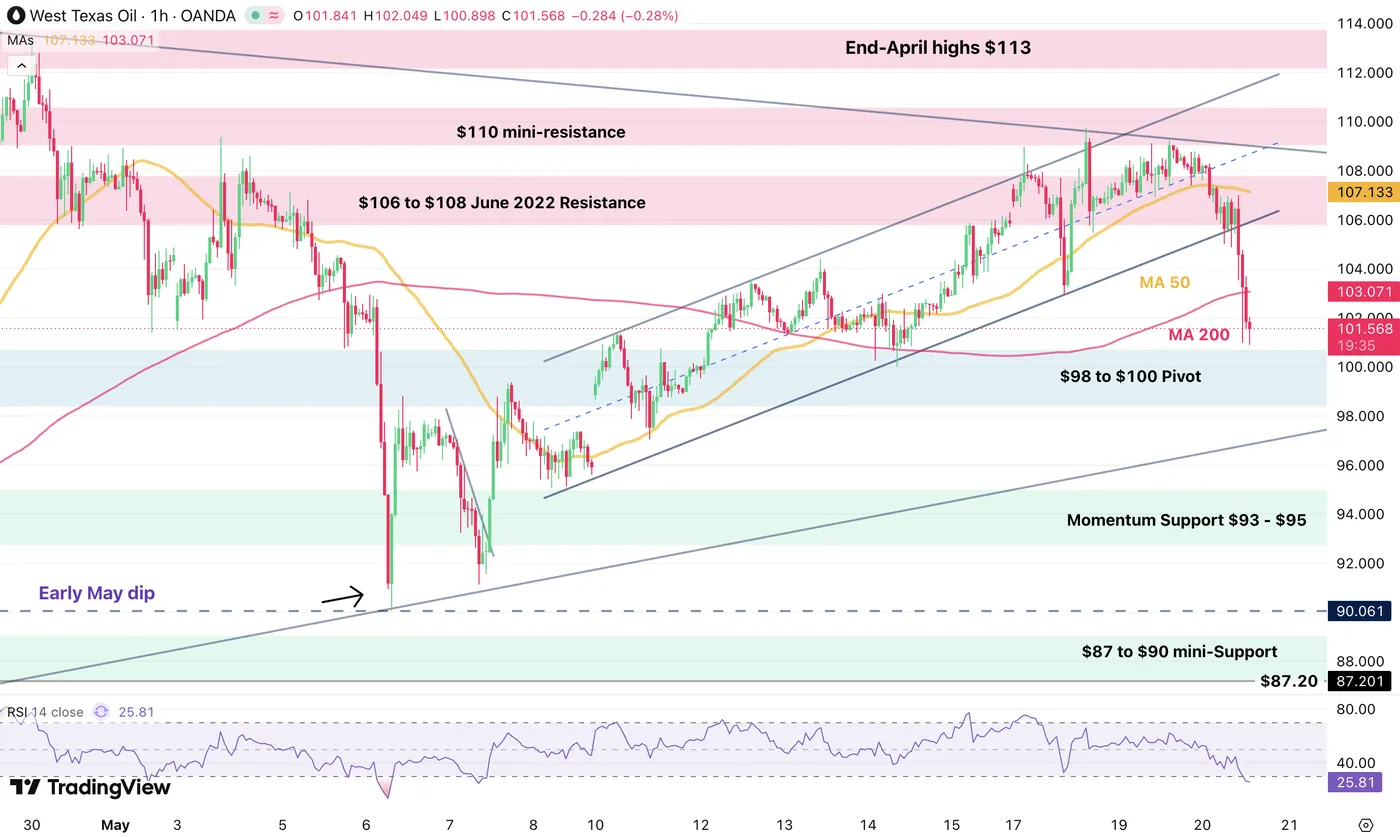
Oil 1H chart, 13:38. Source: TradingView, May 20, 2026.
Lower energy costs are allowing for the pricing of a quick boost in the economy, or at least some relief.
Since oil has been the main reason for recent inflation worries, this drop is letting US Treasury yields fall for the first time in a week, with the 10-year bond dropping below 4.60% for the first time since last Friday.
As long-term yields go down, inflation concerns ease, which helps companies with a lot of debt and growth stocks and overall boosts investor sentiment.
Daily market performance, 13:33. Source: Finviz, May 20, 2026.
As a result, major US indices are rising sharply. Both the Nasdaq and the Dow Jones Industrial Average are up more than 1% and moving toward new record highs.
Another reason for the strong stock rally is that the Warsh trade is pausing as traders pay attention to the latest news.
The recent shift toward higher interest rate expectations, which hurt investor sentiment last week, is now on hold as traders wait for Fed Chair Kevin Warsh's swearing-in on Friday. For now, the positive news about a possible Middle East peace deal is the main focus.
Let's take a look at current reaction by looking into intraday charts and trading levels for the Dow Jones Industrial Average, Nasdaq Composite, and S&P 500.
Current Session's Stock Heatmap
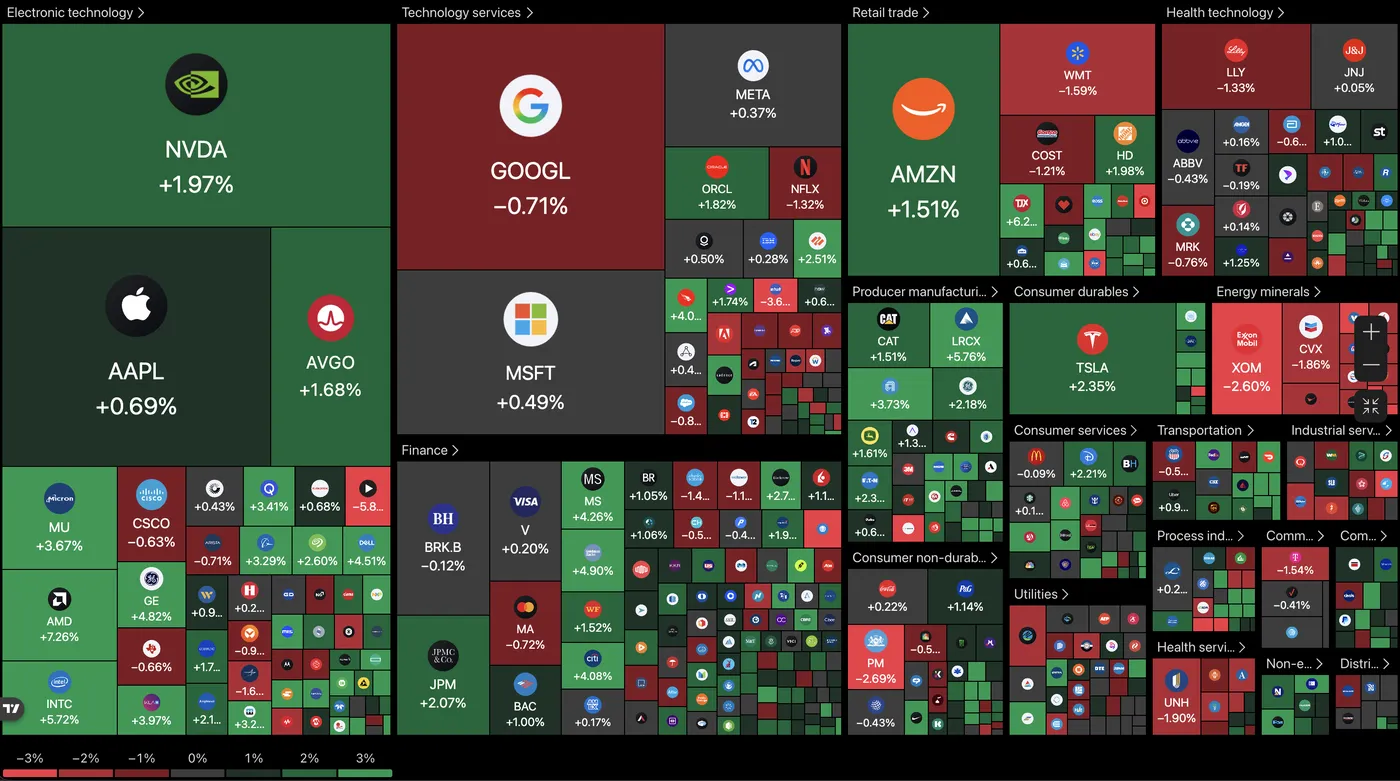
Current picture for the stock market, 13:33. Source: TradingView, May 20, 2026.
While the stock market picture is not yet green throughout the market, semiconductors are quickly rebounding back towards the prior week’s highs, and this move is spreading to finance, healthcare and the recently struggling producer manufacturing sector.
Only energy minerals are fully down on the session.
Dow Jones 2H Chart and Trading Levels
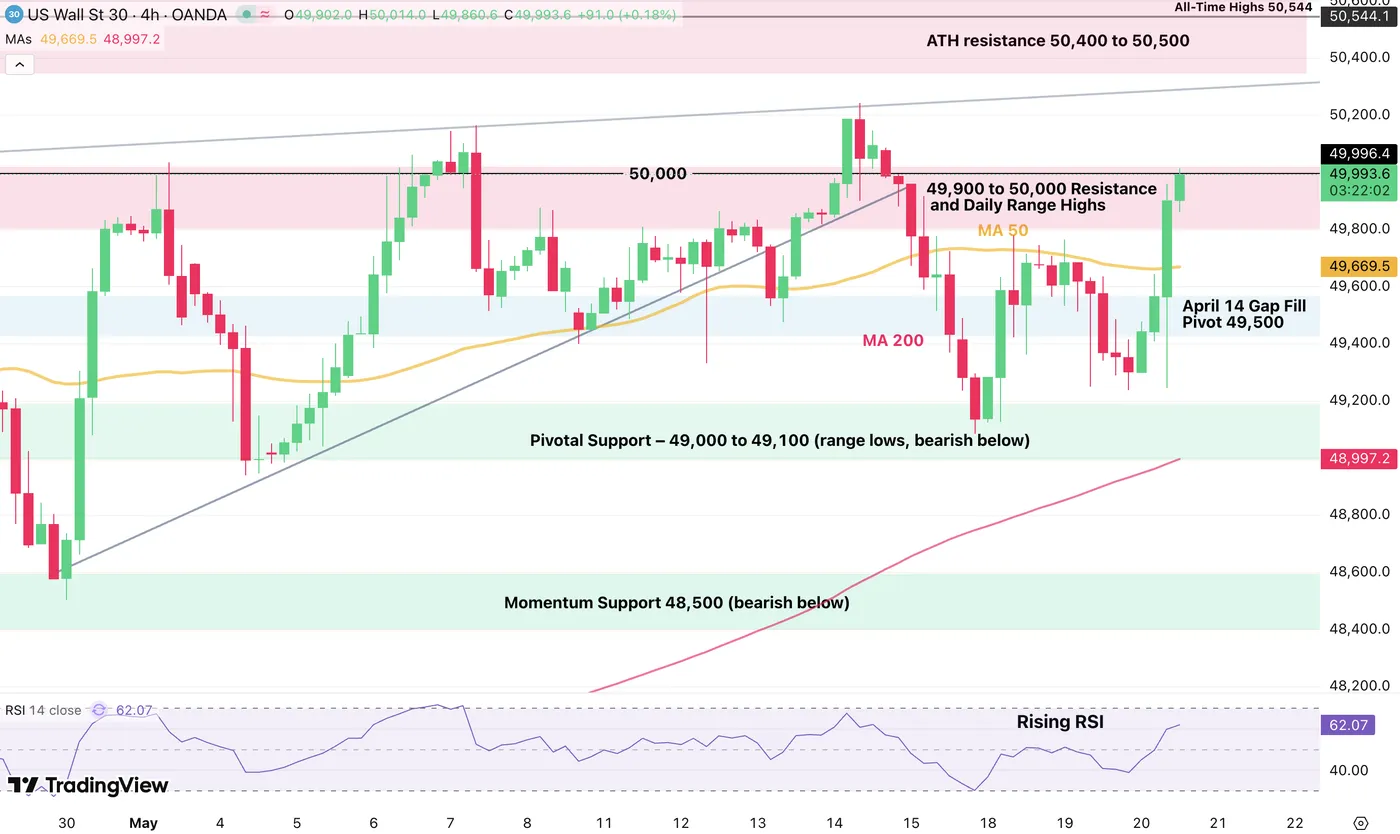
Dow Jones CFD 2H chart. Source: TradingView, May 20, 2026.
The DJIA is bullying right back towards 50,000 as we speak, pushed by the renewed boost in sentiment.
Industrial and traditional equities get a double advantage from lower oil prices, through manufacturing costs and lower yields. Firms represented by the Dow tend to often make high use of leverage, hence the higher yields were also putting pressure on the index.
Trying to break the 50,000 resistance, bulls will want to see a close in either today's or tomorrow's session to add higher chances of a continuation back towards the preceding all-time highs, around 50,500.
Failing to do so indicates more doubts and rangebound action ahead, but the odds for such a scenario seem lower.
Dow Jones technical levels for trading:
Resistance Levels
- 49,900 to 50,000 resistance and early 2026 highs, testing the breakout
- ATH resistance 50,400 to 50,500
- All-time highs 50,544
Support Levels
- Major pivot: 49,000 to 49,100, range lows
- Momentum support 48,500
- Pivotal support at 48,000, mid-term bearish below
- Mini support 47,400 to 47,600
Nasdaq 2H Chart and Trading Levels
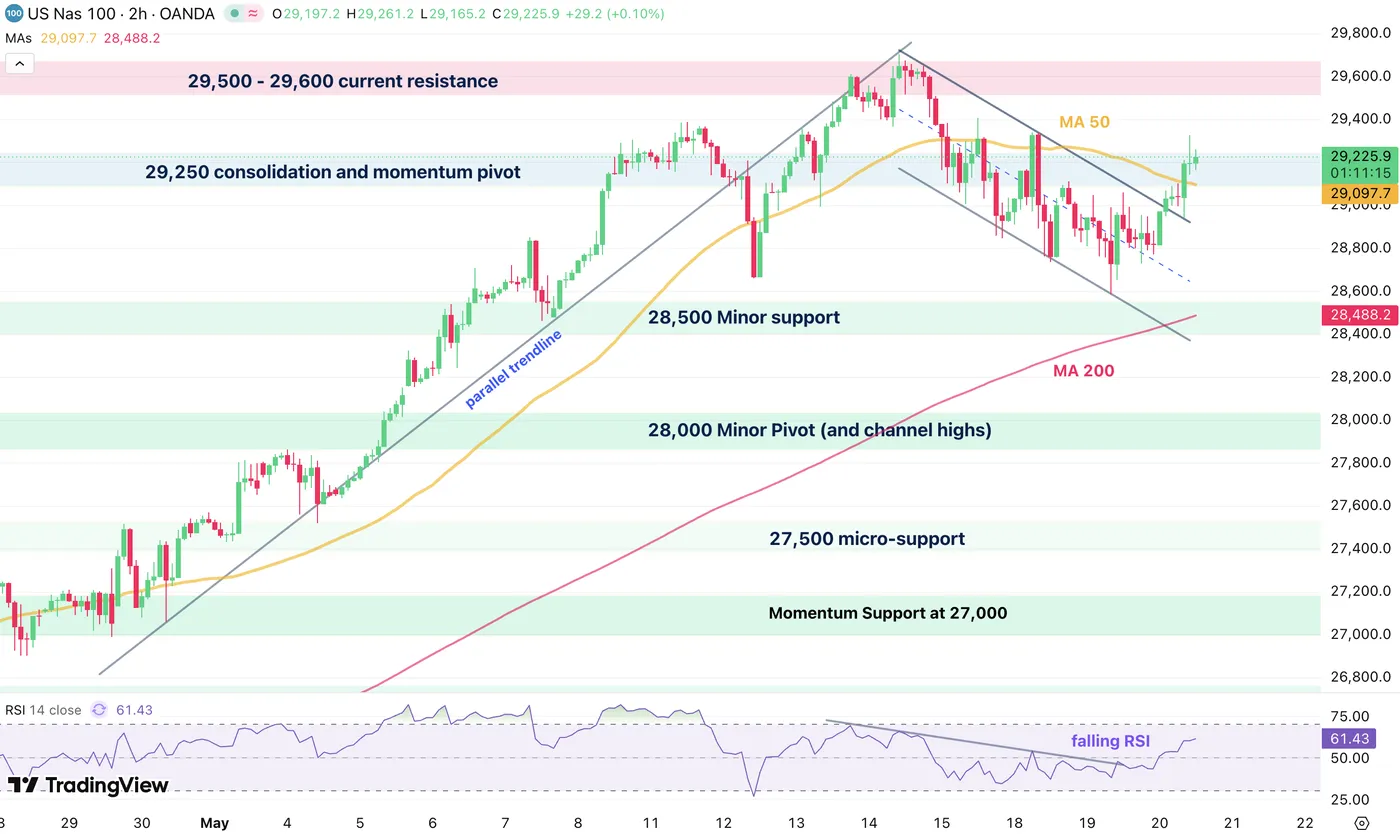
Nasdaq CFD 2H chart. Source: TradingView, May 20, 2026.
Nasdaq officially broke its pullback bear channel, and after having retested its upper bound, the index is solidly back above 29,000 and on path to retest its prior record highs.
The action is somewhat stalling around the 29,250 pivot area, +/- 75 pts.
- Closing above the pivot zone will assist bulls towards a new ATH.
- On the other hand, failing to do so may impose a correction.
Nasdaq technical levels of interest:
Resistance Levels
- 29,250 consolidation and momentum pivot
- 29,218 2H 50-period MA
- 29,500 to 29,600 current resistance, ATH
Support Levels
- 28,500 minor support
- 28,000 major psychological resistance now pivot, and channel highs
- 27,500 micro-support
- Prior ATH support 26,200 to 26,300
S&P 500 2H Chart and Trading Levels
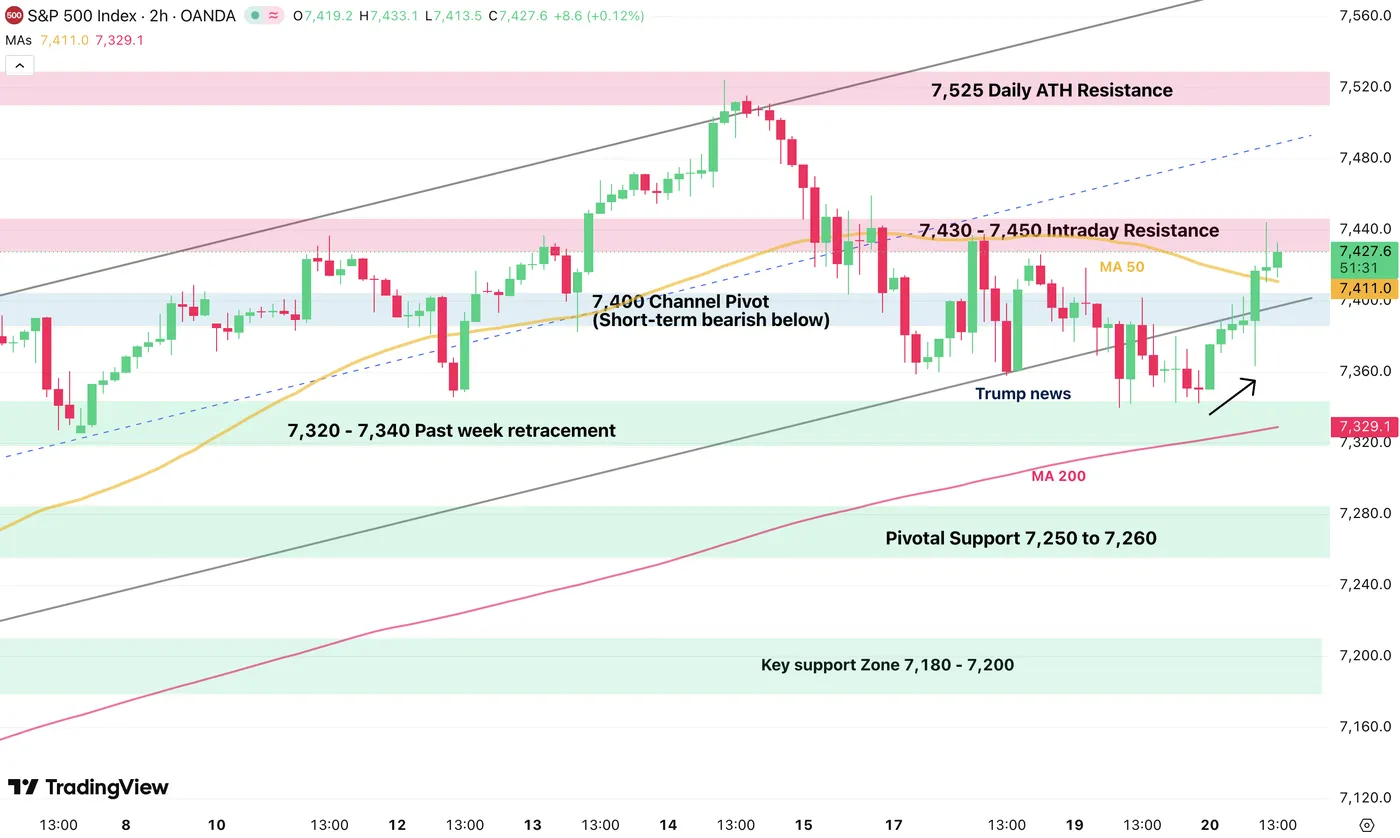
S&P 500 CFD 2H chart. Source: TradingView, May 20, 2026.
The S&P 500 rallied right back into its main channel, but it is also currently struggling at its 7,450 major resistance.
Breaching above it before the end of the week should help the index shoot back to a new record high.
Failing to push above, however, would add to the chances of a larger pullback, around 7,200.
S&P 500 technical levels of interest:
Resistance Levels
- 7,430 to 7,450 intraday resistance
- 7,525 daily ATH resistance
Support Levels
- 7,320 to 7,340 past week retracement, and channel lows
- Pivotal support 7,250 to 7,260
- Prior ATH pivot 7,000 to 7,020
- Minor support 6,880 to 6,900
- Pivotal support 6,750 to 6,770
- 6,300 psychological level, war lows
Keep track of WTI crude and the latest headlines throughout the week to stay ahead of the game.
Safe trades.
FOMC Struggles to Reach Consensus over Heightened Inflation Risks in April
The Federal Reserve Open Market Committee (FOMC) held the federal funds rate at a target range of 3.50% to 3.75% in April.
The minutes showed that the committee remains concerned about inflation staying above the 2% target. Participants highlighted that recent inflation readings remained elevated, with the risks to the outlook tilted to the upside. The conflict in the Middle East was again cited as a key driver, with “almost all participants” noting the risk that higher energy and input costs could persist and delay the return of inflation to target. The “vast majority” judged that inflation could take longer than previously expected to reach 2%, reflecting a combination of geopolitical risks, tariffs, and potential pass-through to broader prices.
With respect to the labor market, participants still judged it to be roughly balanced and expected it to remain stable in the near term. While the baseline expectation is for the unemployment rate to remain broadly steady, several participants pointed to downside risks to hiring, particularly in the context of slowing job gains and uncertainty around business investment decisions. At the same time, discussion also highlighted structural forces — including AI-related investment — that could both raise costs in the near term and improve productivity over time.
Importantly, "many participants indicated that they would have preferred removing the language from the postmeeting statement that suggested an easing bias". These minutes reveal a clear shift toward a more two-sided or hawkish stance for the Fed, one where participants disagree on the appropriate stance of policy to a wider extent than has been the case recently. Indeed, this meeting had an unusually high number of dissents compared to recent history.
The committee viewed uncertainty around the outlook as elevated considering the conflict in the Middle East and the potential consequences of AI adoption, and risks to the forecasts for GDP and employment as tilted to the downside.
Key Implications
The minutes underscore a notable rise in internal disagreement signaling a committee that is less aligned around imminent cuts and increasingly focused on preserving optionality in both directions.
The evolution of the Middle East conflict remains central. Even if energy prices stabilize, the minutes suggest concern that second-round effects (via wages, expectations, and broader input costs) could prolong the inflation shock. The committee's reaction function is now more explicitly two-sided, reducing confidence in near-term easing. The bar for cuts has moved higher, and the Fed appears prepared to wait longer — or potentially tighten policy — if inflation does not convincingly return toward target.
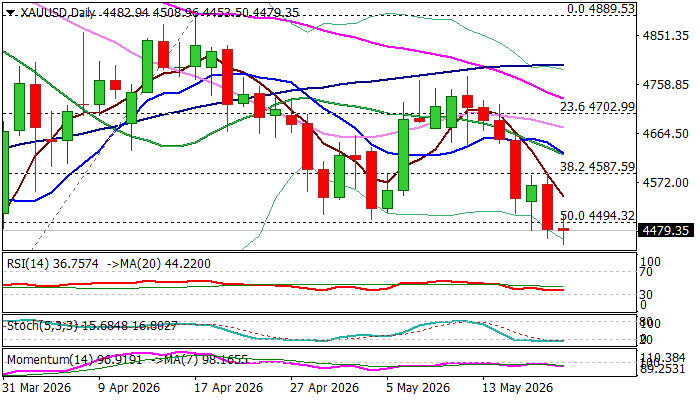
Gold – Bears Take a Breather at Key Support Zone But Still Hold Grip, Geopolitics Remain in Focus
Gold edged higher on Wednesday after cracking important $4500 support zone (50% retracement of $4099/$4889 rally / recent higher base) which provides significant headwinds to larger bears.
Partial profit-taking on oversold conditions / eased tensions in the Middle East on the latest narrative from US officials about potential peace agreement, keep bears temporarily on hold, but so far without significant bounce from pivotal supports.
The yellow metal price may rise further in scenario of sustainable peace deal, which would ease uncertainty over energy supply problems and decrease inflationary pressure, one of dollar’s main drivers nowadays.
Conversely, persistent geopolitical tensions would continue to fuel price pressures and keep the dollar supported. In such scenario, firm break of $4500 zone would further strengthen predominantly bearish near-term structure and expose supports at $4401 (Fibo 61.8%) and $4359 (200DMA).
Lower platform / broken Fibo 38.2% ($4587) offers solid resistance which should ideally cap upticks and guard $4624 (converged 10/20DMAs).
Res: 4543; 4587; 4624; 4676
Sup: 4453; 4401; 4359; 4300
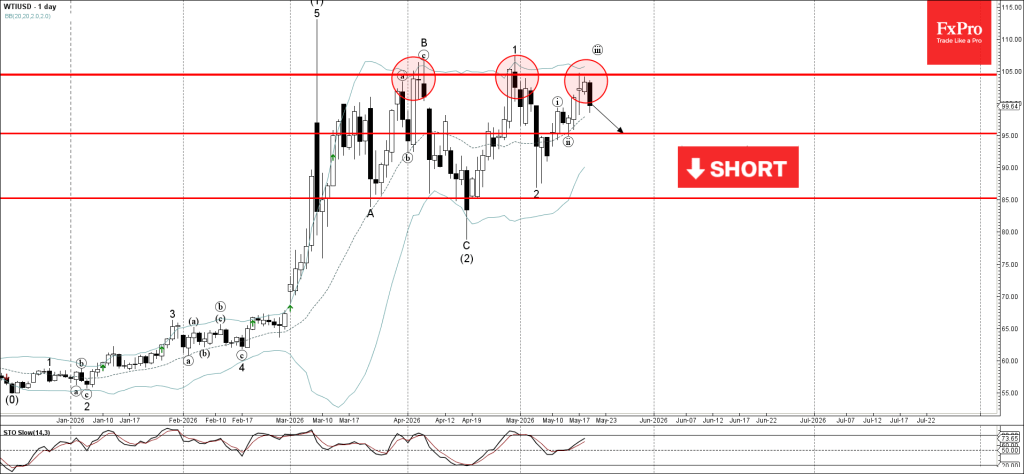
WTI Crude Oil Wave Analysis
WTI crude oil: ⬇️ Sell
- WTI crude oil reversed from resistance zone
- Likely to fall to support level 95.00
WTI crude oil recently reversed from the resistance zone between the pivotal resistance level 105.00 (which has been reversing the price from the start of April) and the upper daily Bollinger Band.
The downward reversal from this resistance zone stopped the earlier impulse waves iii and (3).
Given the strength of the resistance level 105.00, WTI crude oil can be expected to fall to the next support level 95.00 (low of the previous correction ii).
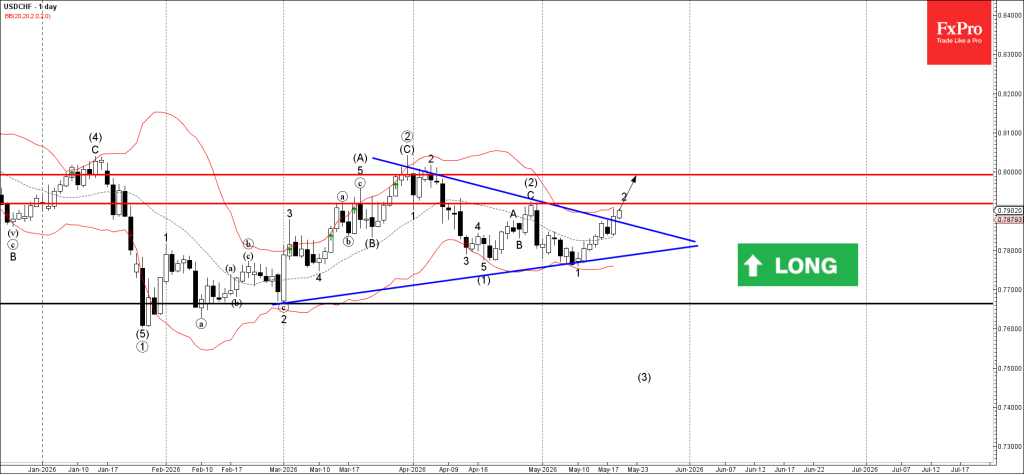
USDCHF Wave Analysis
USDCHF: ⬆️ Buy
- USDCHF broke daily Triangle
- Likely to rise to resistance level 0.7920
USDCHF currency pair recently broke above resistance trendline of the daily Triangle chart pattern from the start of March.
The breakout of this Triangle should accelerate the active minor correction 2 which started earlier from the strong support level 0.7770.
Given the continuation of the bullish US dollar sentiment seen across the FX markets today, USDCHF currency pair can be expected to rise further to the next resistance level 0.7920 – followed by 0.8000.
Eco Data 5/21/26
| GMT | Ccy | Events | Act | Cons | Prev | Rev |
|---|---|---|---|---|---|---|
| 22:45 | NZD | Trade Balance (NZD) Apr | 1920M | 980M | 698M | 430M |
| 23:00 | AUD | Manufacturing PMI May P | 50.2 | 51.3 | ||
| 23:00 | AUD | Services PMI May P | 47.7 | 50.7 | ||
| 23:50 | JPY | Trade Balance Apr | 0.24T | -0.20T | 0.09T | |
| 23:50 | JPY | Machinery Orders M/M Mar | -9.40% | -7.70% | 13.60% | |
| 00:30 | JPY | Manufacturing PMI May P | 54.5 | 54.5 | 55.1 | |
| 00:30 | JPY | Services PMI May P | 50 | 51 | ||
| 01:00 | AUD | Consumer Inflation Expectations May | 5.60% | 5.90% | ||
| 01:30 | AUD | Employment Change Apr | -18.6K | 15.2K | 17.9K | |
| 01:30 | AUD | Unemployment Rate Apr | 4.50% | 4.30% | 4.30% | |
| 07:15 | EUR | France Manufacturing PMI May P | 48.9 | 52.3 | 52.8 | |
| 07:15 | EUR | France Services PMI May P | 42.9 | 46.7 | 46.5 | |
| 07:30 | EUR | Germany Manufacturing PMI May P | 49.9 | 51 | 51.4 | |
| 07:30 | EUR | Germany Services PMI May P | 47.8 | 47.1 | 46.9 | |
| 08:00 | EUR | Eurozone Current Account (EUR) Mar | 14.9B | 25.3B | 24.9B | 25.6B |
| 08:00 | EUR | Eurozone Manufacturing PMI May P | 51.4 | 51.8 | 52.2 | |
| 08:00 | EUR | Eurozone Services PMI May P | 46.4 | 48 | 47.6 | |
| 08:30 | GBP | Manufacturing PMI May P | 53.7 | 53 | 53.7 | |
| 08:30 | GBP | Services PMI May P | 47.9 | 51.9 | 52.7 | |
| 12:30 | USD | Initial Jobless Claims (May 15) | 209K | 210K | 211K | 212K |
| 12:30 | USD | Building Permits Apr | 1.44M | 1.38M | 1.37M | |
| 12:30 | USD | Housing Starts Apr | 1.47M | 1.42M | 1.50M | |
| 12:30 | USD | Philadelphia Fed Manufacturing Survey May | -0.4 | 15.3 | 26.7 | |
| 13:45 | USD | Manufacturing PMI May P | 55.3 | 53.7 | 54.5 | |
| 13:45 | USD | Services PMI May P | 50.9 | 51.3 | 51 | |
| 14:00 | EUR | Eurozone Consumer Confidence May P | -19 | -21 | -20.6 | |
| 14:30 | USD | Natural Gas Storage (May 15) | 101B | 96B | 85B |
| 22:45 | NZD |
| Trade Balance (NZD) Apr | |
| Actual | 1920M |
| Consensus | 980M |
| Previous | 698M |
| Revised | 430M |
| 23:00 | AUD |
| Manufacturing PMI May P | |
| Actual | 50.2 |
| Consensus | |
| Previous | 51.3 |
| 23:00 | AUD |
| Services PMI May P | |
| Actual | 47.7 |
| Consensus | |
| Previous | 50.7 |
| 23:50 | JPY |
| Trade Balance Apr | |
| Actual | 0.24T |
| Consensus | -0.20T |
| Previous | 0.09T |
| 23:50 | JPY |
| Machinery Orders M/M Mar | |
| Actual | -9.40% |
| Consensus | -7.70% |
| Previous | 13.60% |
| 00:30 | JPY |
| Manufacturing PMI May P | |
| Actual | 54.5 |
| Consensus | 54.5 |
| Previous | 55.1 |
| 00:30 | JPY |
| Services PMI May P | |
| Actual | 50 |
| Consensus | |
| Previous | 51 |
| 01:00 | AUD |
| Consumer Inflation Expectations May | |
| Actual | 5.60% |
| Consensus | |
| Previous | 5.90% |
| 01:30 | AUD |
| Employment Change Apr | |
| Actual | -18.6K |
| Consensus | 15.2K |
| Previous | 17.9K |
| 01:30 | AUD |
| Unemployment Rate Apr | |
| Actual | 4.50% |
| Consensus | 4.30% |
| Previous | 4.30% |
| 07:15 | EUR |
| France Manufacturing PMI May P | |
| Actual | 48.9 |
| Consensus | 52.3 |
| Previous | 52.8 |
| 07:15 | EUR |
| France Services PMI May P | |
| Actual | 42.9 |
| Consensus | 46.7 |
| Previous | 46.5 |
| 07:30 | EUR |
| Germany Manufacturing PMI May P | |
| Actual | 49.9 |
| Consensus | 51 |
| Previous | 51.4 |
| 07:30 | EUR |
| Germany Services PMI May P | |
| Actual | 47.8 |
| Consensus | 47.1 |
| Previous | 46.9 |
| 08:00 | EUR |
| Eurozone Current Account (EUR) Mar | |
| Actual | 14.9B |
| Consensus | 25.3B |
| Previous | 24.9B |
| Revised | 25.6B |
| 08:00 | EUR |
| Eurozone Manufacturing PMI May P | |
| Actual | 51.4 |
| Consensus | 51.8 |
| Previous | 52.2 |
| 08:00 | EUR |
| Eurozone Services PMI May P | |
| Actual | 46.4 |
| Consensus | 48 |
| Previous | 47.6 |
| 08:30 | GBP |
| Manufacturing PMI May P | |
| Actual | 53.7 |
| Consensus | 53 |
| Previous | 53.7 |
| 08:30 | GBP |
| Services PMI May P | |
| Actual | 47.9 |
| Consensus | 51.9 |
| Previous | 52.7 |
| 12:30 | USD |
| Initial Jobless Claims (May 15) | |
| Actual | 209K |
| Consensus | 210K |
| Previous | 211K |
| Revised | 212K |
| 12:30 | USD |
| Building Permits Apr | |
| Actual | 1.44M |
| Consensus | 1.38M |
| Previous | 1.37M |
| 12:30 | USD |
| Housing Starts Apr | |
| Actual | 1.47M |
| Consensus | 1.42M |
| Previous | 1.50M |
| 12:30 | USD |
| Philadelphia Fed Manufacturing Survey May | |
| Actual | -0.4 |
| Consensus | 15.3 |
| Previous | 26.7 |
| 13:45 | USD |
| Manufacturing PMI May P | |
| Actual | 55.3 |
| Consensus | 53.7 |
| Previous | 54.5 |
| 13:45 | USD |
| Services PMI May P | |
| Actual | 50.9 |
| Consensus | 51.3 |
| Previous | 51 |
| 14:00 | EUR |
| Eurozone Consumer Confidence May P | |
| Actual | -19 |
| Consensus | -21 |
| Previous | -20.6 |
| 14:30 | USD |
| Natural Gas Storage (May 15) | |
| Actual | 101B |
| Consensus | 96B |
| Previous | 85B |
Bailey Says Higher Market Rates Are Buying BoE Time to Evaluate Energy Shock
Bank of England Governor Andrew Bailey signaled that rising market borrowing costs are helping tighten financial conditions naturally, reducing pressure for immediate additional policy action from the central bank. Testifying before lawmakers on today, Bailey said the jump in market interest rates since the outbreak of the Iran war — particularly in mortgage costs — has already delivered some tightening to the economy.
“That tightening, I think also gives us ... some time to assess,” Bailey said. The comments reinforce the cautious stance taken at April’s MPC meeting, where the BoE voted 8-1 to leave rates unchanged while stressing that any future response would depend on how deeply and persistently higher energy costs spread through the economy.
At the same time, Bailey acknowledged signs that the UK economy is cooling, with growth and labor market conditions softening and wage settlements easing gradually. Still, he warned that energy market pricing currently appears “fairly benign” relative to the actual disruption caused to Middle East gas infrastructure, suggesting policymakers remain wary that inflation risks could re-intensify if the conflict escalates further.