Sample Category Title
EUR/GBP Daily Outlook
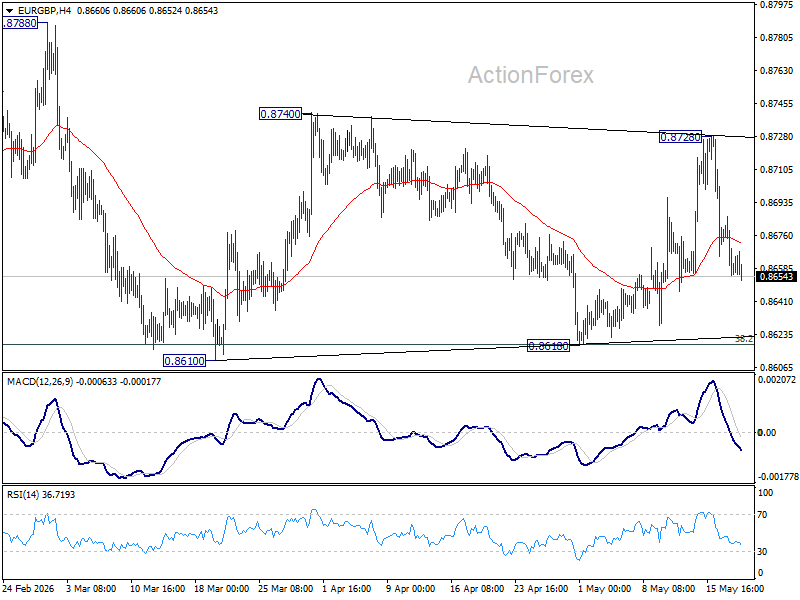
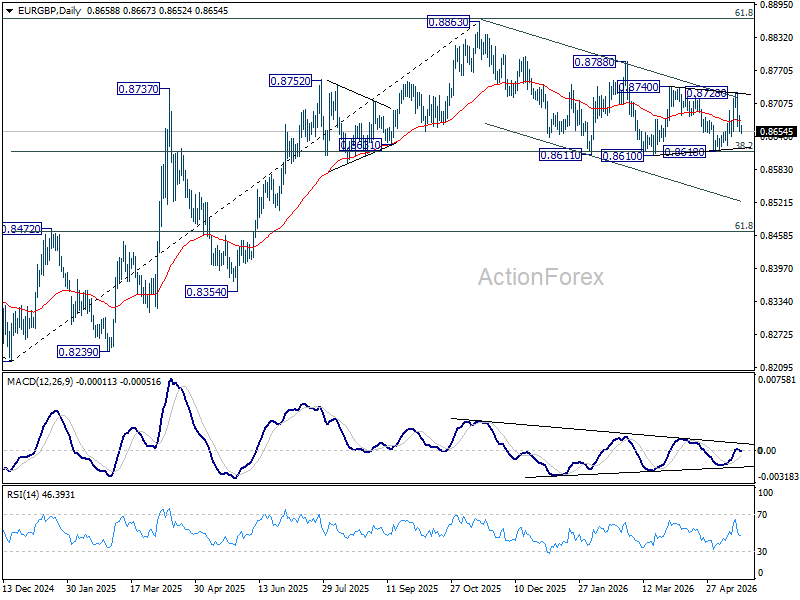
Range trading continues in EUR/GBP and intraday bias stays neutral. On the upside, decisive break of 0.8740 should pave the way through 0.8788 to retest 0.8863 high. Meanwhile, firm break of 0.8610 will revive the case of bearish trend reversal.
In the bigger picture, focus is back on 38.2% retracement of 0.8821 to 0.8863 at 0.8618. Strong rebound from there will retain medium term bullishness. Rise from 0.8221 should resume through 0.8863 at a later stage. Nevertheless, sustained break of 0.8618 will confirm that whole rise from 0.8221 has completed at 0.8863. Deeper decline should then be seen to 61.8% retracement at 0.8466 at least.
EUR/AUD Daily Outlook
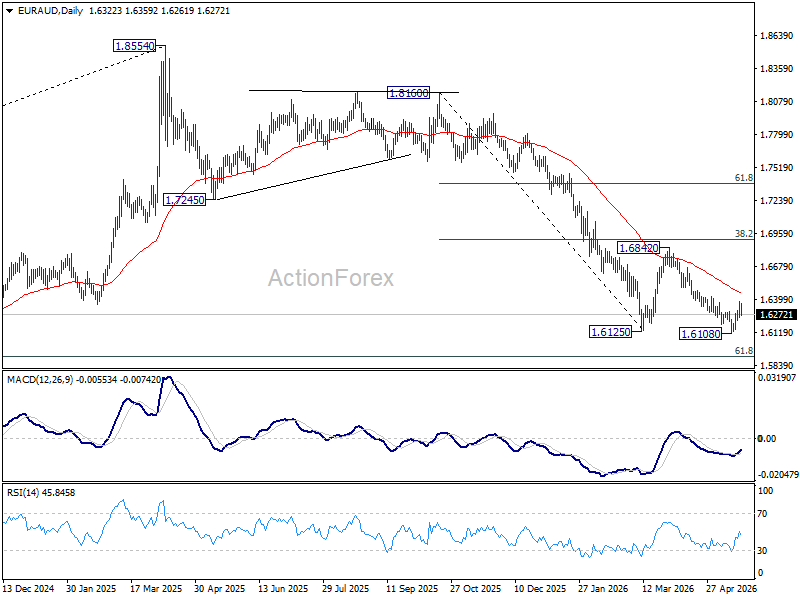
Intraday bias in EUR/AUD is turned neutral first with current retreat. Risk is mildly on the upside as long as 1.6108 support holds. Rise from there is seen as the third leg of the corrective pattern from 1.6125. Above 1.6381 will target 55 D EMA (now at 1.6452). On the downside, break of 1.6108 will resume larger fall from 1.8554 to 1.5913 fibonacci level.
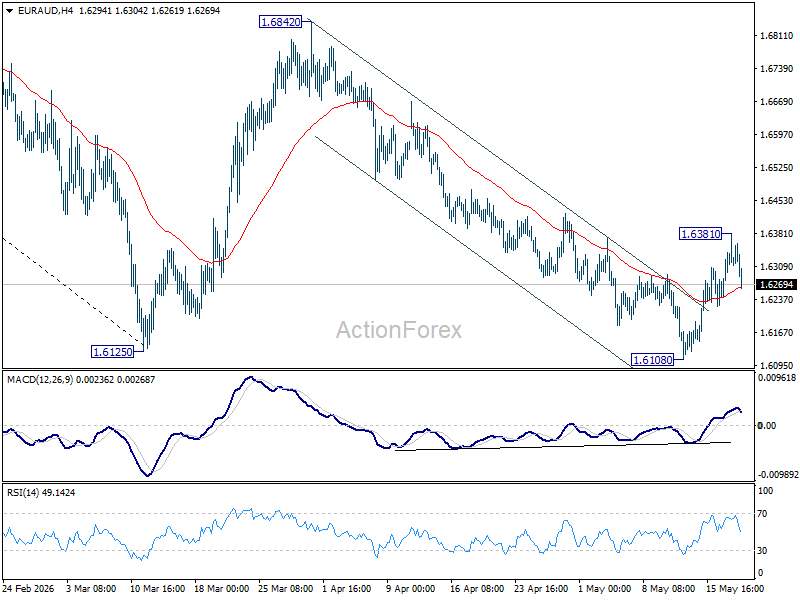
In the bigger picture, fall from 1.8554 (2025 high) is in progress and deeper decline should be seen to 61.8% retracement of 1.4281 to 1.8554 at 1.5913, which is slightly below 1.5963 structural support. Decisive break there will pave the way back to 1.4281 (2022 low). For now, risk will stay on the downside as long as 55 W EMA (now at 1.7012) holds, even in case of strong rebound.
EUR/CHF Daily Outlook
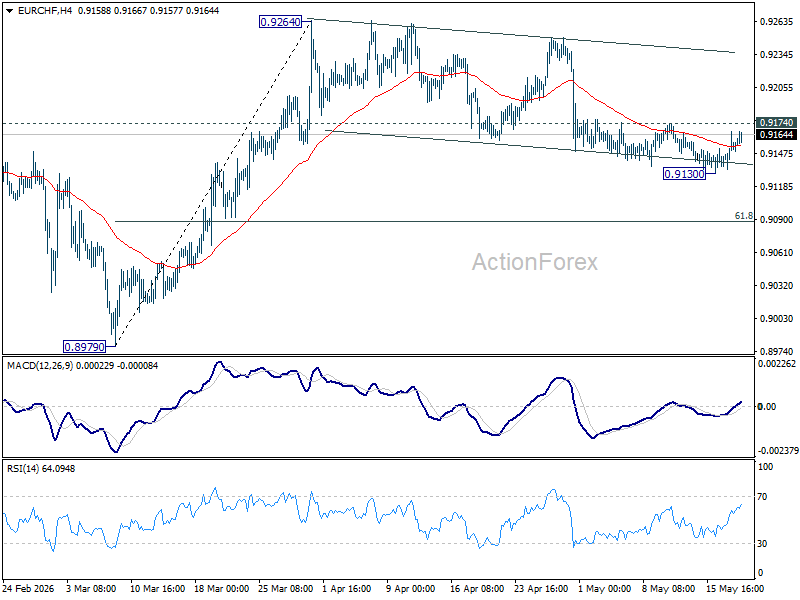
Intraday bias in EUR/CHF is turned neutral first with current recovery On the downside, below 0.9130 temporary low will extend the corrective fall from 0.9264 to 61.8% retracement of 0.8979 to 0.9264 at 0.9088. On the upside, however, break of 0.9174 will turn bias back to the upside for stronger rebound to retest 0.9264 high instead.
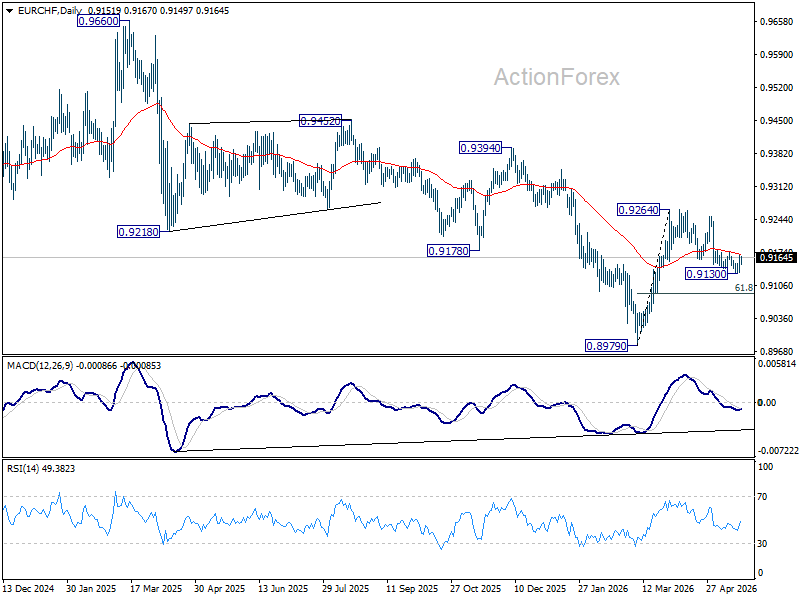
In the bigger picture, considering bullish convergence condition in W MACD, a medium term bottom should be in place at 0.8979. Sustained trading above 55 W EMA (now at 0.9241) will add more credence to this case. Further break of 0.9394 resistance will pave the way to 0.9660 resistance next. However rejection by the 55 W EMA will set up another fall through 0.8979 low at a later stage.
AUD/USD and NZD/USD Fresh Decline Signals More Weakness Ahead
AUD/USD failed to stay in a positive zone and declined below 0.7150. NZD/USD is also moving lower and might extend losses below 0.5800.
Important Takeaways for AUD/USD and NZD/USD Analysis Today
- The Aussie Dollar started a fresh decline from well above 0.7200 against the US Dollar.
- There is a bearish trend line forming with resistance at 0.7120 on the hourly chart of AUD/USD at FXOpen.
- NZD/USD declined steadily from 0.5965 and traded below 0.5880.
- There is a key bearish trend line forming with resistance at 0.5855 on the hourly chart of NZD/USD at FXOpen.
AUD/USD Technical Analysis
On the hourly chart of AUD/USD at FXOpen, the pair struggled to clear 0.7220. The Aussie Dollar started a fresh decline below 0.7150 against the US Dollar.
The pair even settled below 0.7120 and the 50-hour simple moving average. There was a clear move below 0.7100. A low was formed at 0.7081, and the pair is now consolidating losses. There was a minor recovery wave above the 23.6% Fib retracement level of the downward move from the 0.7184 swing high to the 0.7081 low.
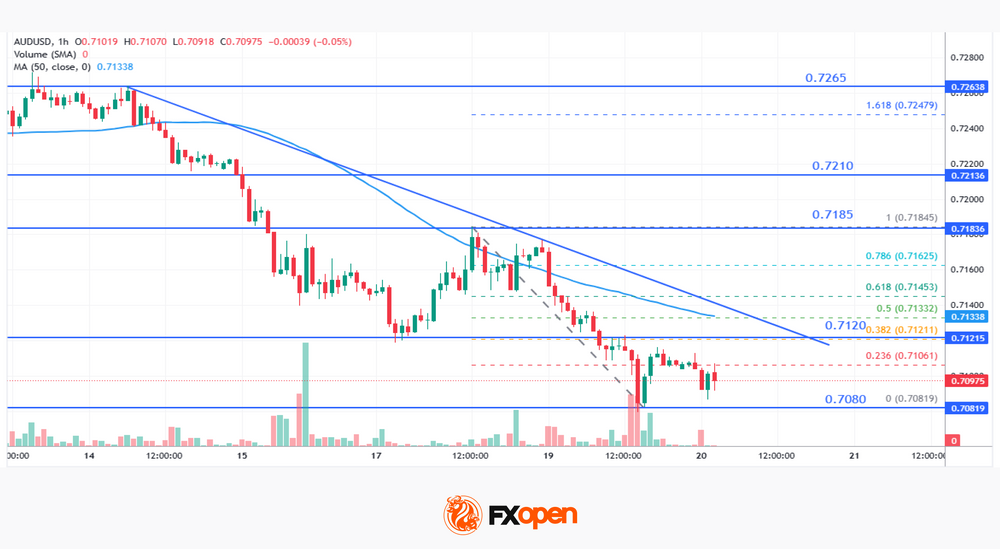
On the upside, the immediate hurdle could be near the 38.2% Fib retracement at 0.7120. There is also a bearish trend line forming with resistance at 0.7120 and the 50-hour simple moving average.
The next major level for the bears could be 0.7185. The main selling point could be 0.7210, above which the price could rise toward 0.7265. Any more gains might send the pair toward 0.7320. A close above 0.7320 could start another steady increase in the near term. In the stated case, the next key resistance on the AUD/USD chart could be 0.7500.
On the downside, initial support could be near 0.7080. The next area of interest might be 0.7040. If there is a downside break below 0.7040, the pair could extend its decline. The next target for the bears might be 0.7000. Any more losses might send the pair toward 0.6920.
NZD/USD Technical Analysis
On the hourly chart of NZD/USD on FXOpen, the pair also followed a similar pattern and declined from the 0.5965 zone. The New Zealand Dollar gained bearish momentum and traded below 0.5920 against the US Dollar.
The pair settled below 0.5880 and the 50-hour simple moving average. Finally, it tested 0.5815 and is currently consolidating losses below the 23.6% Fib retracement level of the downward move from the 0.5882 swing high to the 0.5815 low.
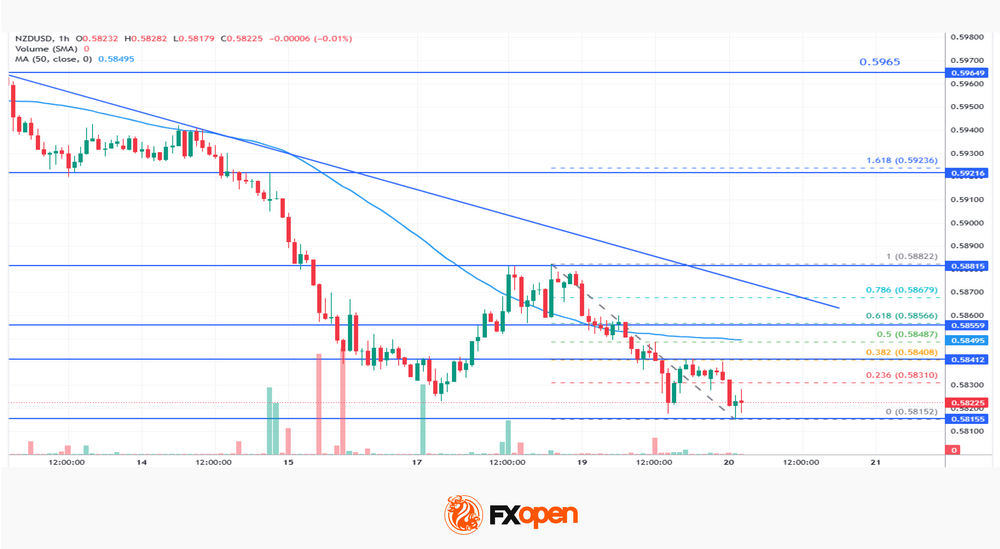
If the pair recovers, it could face hurdles near the 38.2% Fib retracement at 0.5840. The next major barrier could be at 0.5855. There is also a key bearish trend line forming with resistance at 0.5855.
If there is a move above 0.5880, the pair could rise toward 0.5920. Any more gains might open the doors for a move toward 0.5965 in the coming days. On the downside, immediate support on the NZD/USD chart could be 0.5815.
The next major stop for the bears might be 0.5780. If there is a downside break below 0.5780, the pair could extend its decline toward 0.5720. The main target for the bears could be 0.5650.
Trade over 50 forex markets 24 hours a day with FXOpen. Take advantage of low commissions, deep liquidity, and spreads from 0.0 pips (additional fees may apply). Open your FXOpen account now or learn more about trading forex with FXOpen.
This article represents the opinion of the Companies operating under the FXOpen brand only. It is not to be construed as an offer, solicitation, or recommendation with respect to products and services provided by the Companies operating under the FXOpen brand, nor is it to be considered financial advice.
Yields Boosting the Dollar
- Rising Treasury yields are drawing capital away from equities and into the dollar.
- Verbal interventions and expectations of a BoJ rate hike have supported the yen.
The US dollar is gaining ground on the back of increasingly hawkish expectations for the Fed’s rate hikes, pushing up bond yields as investors scale back expectations of a swift end to the conflict in the Middle East. The Strait of Hormuz is closed, and global oil reserves are dwindling. Brent has been trading near the upper end of its range since March, risking a return to an upward trend. Against this backdrop, inflation expectations and Treasury yields are rising. As a result, share valuations are shifting, corporate costs are rising, and profits are falling. The S&P 500’s retreat from record highs is strengthening the greenback.
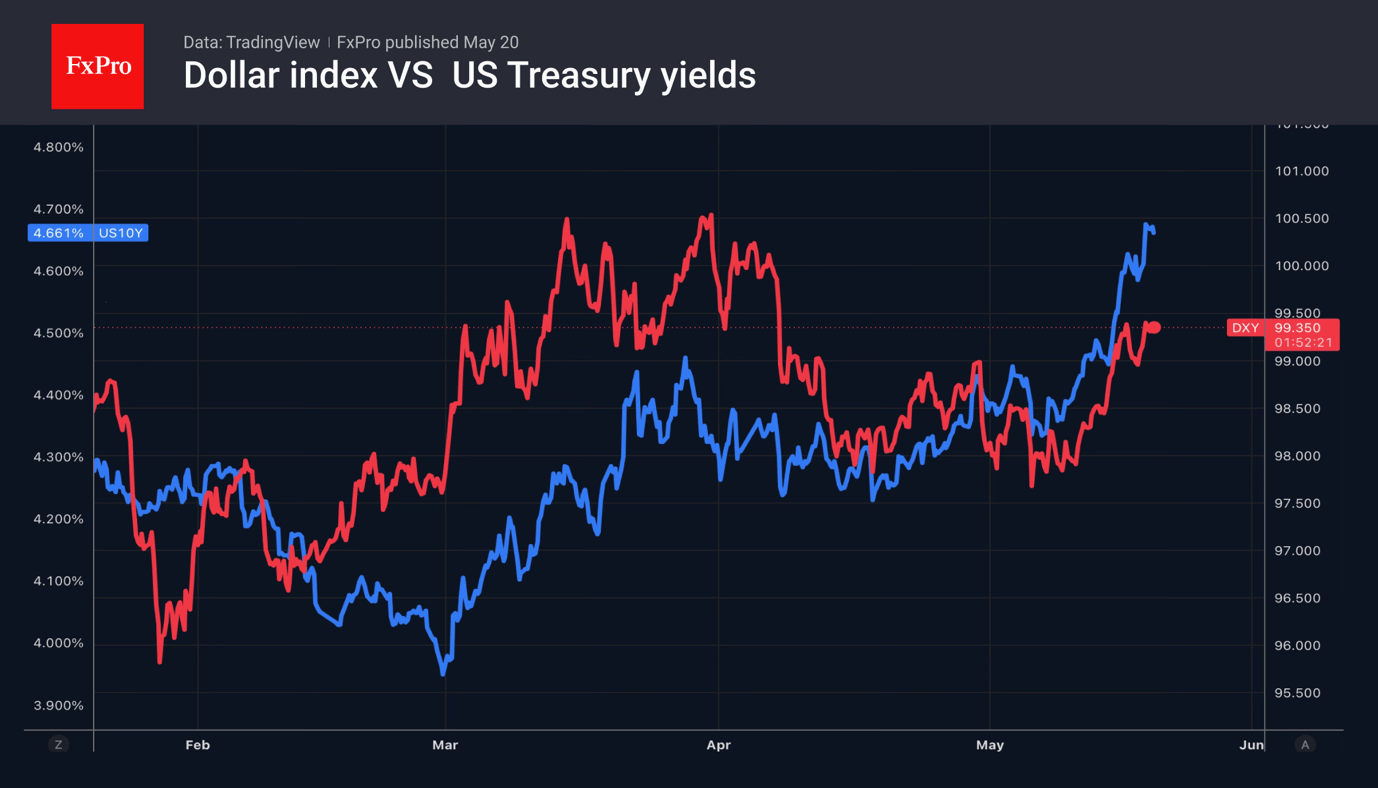
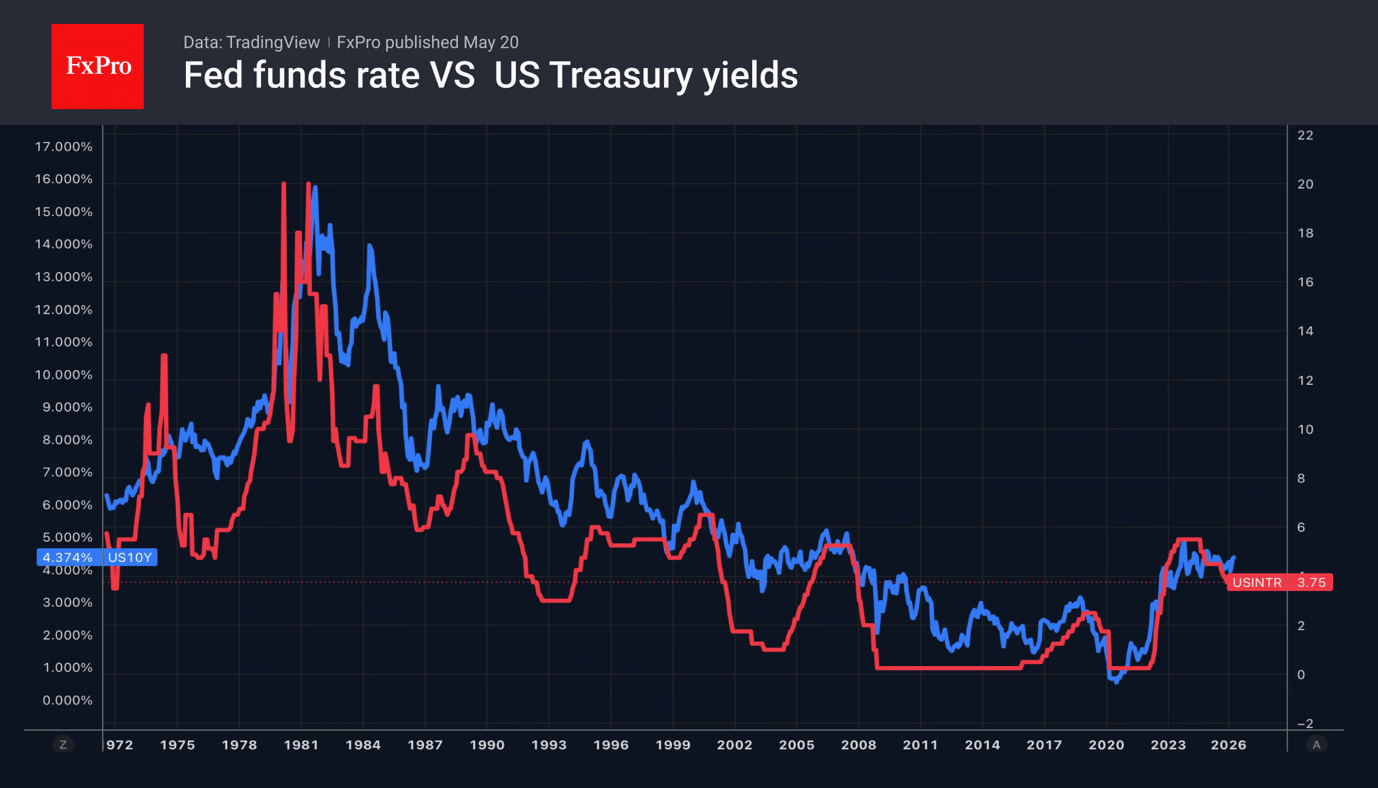
The market is pricing in a 4.65% yield at the 10-year horizon, which is almost 100 basis points above the current Fed rate. The higher inflation rises, the greater the risk premium investors will demand. In such a situation, the Fed needs to adopt a hawkish tone to bring yields down. Only then will the market’s fear that inflation will spiral out of control subside.
However, Anna Paulson, Atlanta Fed President, insists on keeping rates at their current level, describing the current policy as moderately restrictive. Signs of a slowdown in inflation would provide the impetus for a return to rate cuts. Unfortunately, such signs are becoming increasingly scarce. The US economy would have to face a recession for the Fed to cut rates.
This makes Kevin Warsh’s task of easing monetary policy extremely difficult. Donald Trump has previously stated that he would be disappointed if the new Fed chair did not cut rates.
The approach of USDJPY to the 160 mark is forcing the Japanese government to resort to verbal intervention once again. On the sidelines of the G7 finance ministers and central bank governors meeting, Satsuki Katayama stated that the authorities would take bold action as necessary.
Scott Bessent met with BoJ Governor Kazuo Ueda and noted that the strength of the economy allows the Bank of Japan to act decisively. The futures market is pricing in a 77% probability of an overnight rate hike at the June Policy Board meeting, which is supporting the yen.
Bitcoin Holding Above 50-day MA, While Ethereum Has Failed
Market Overview
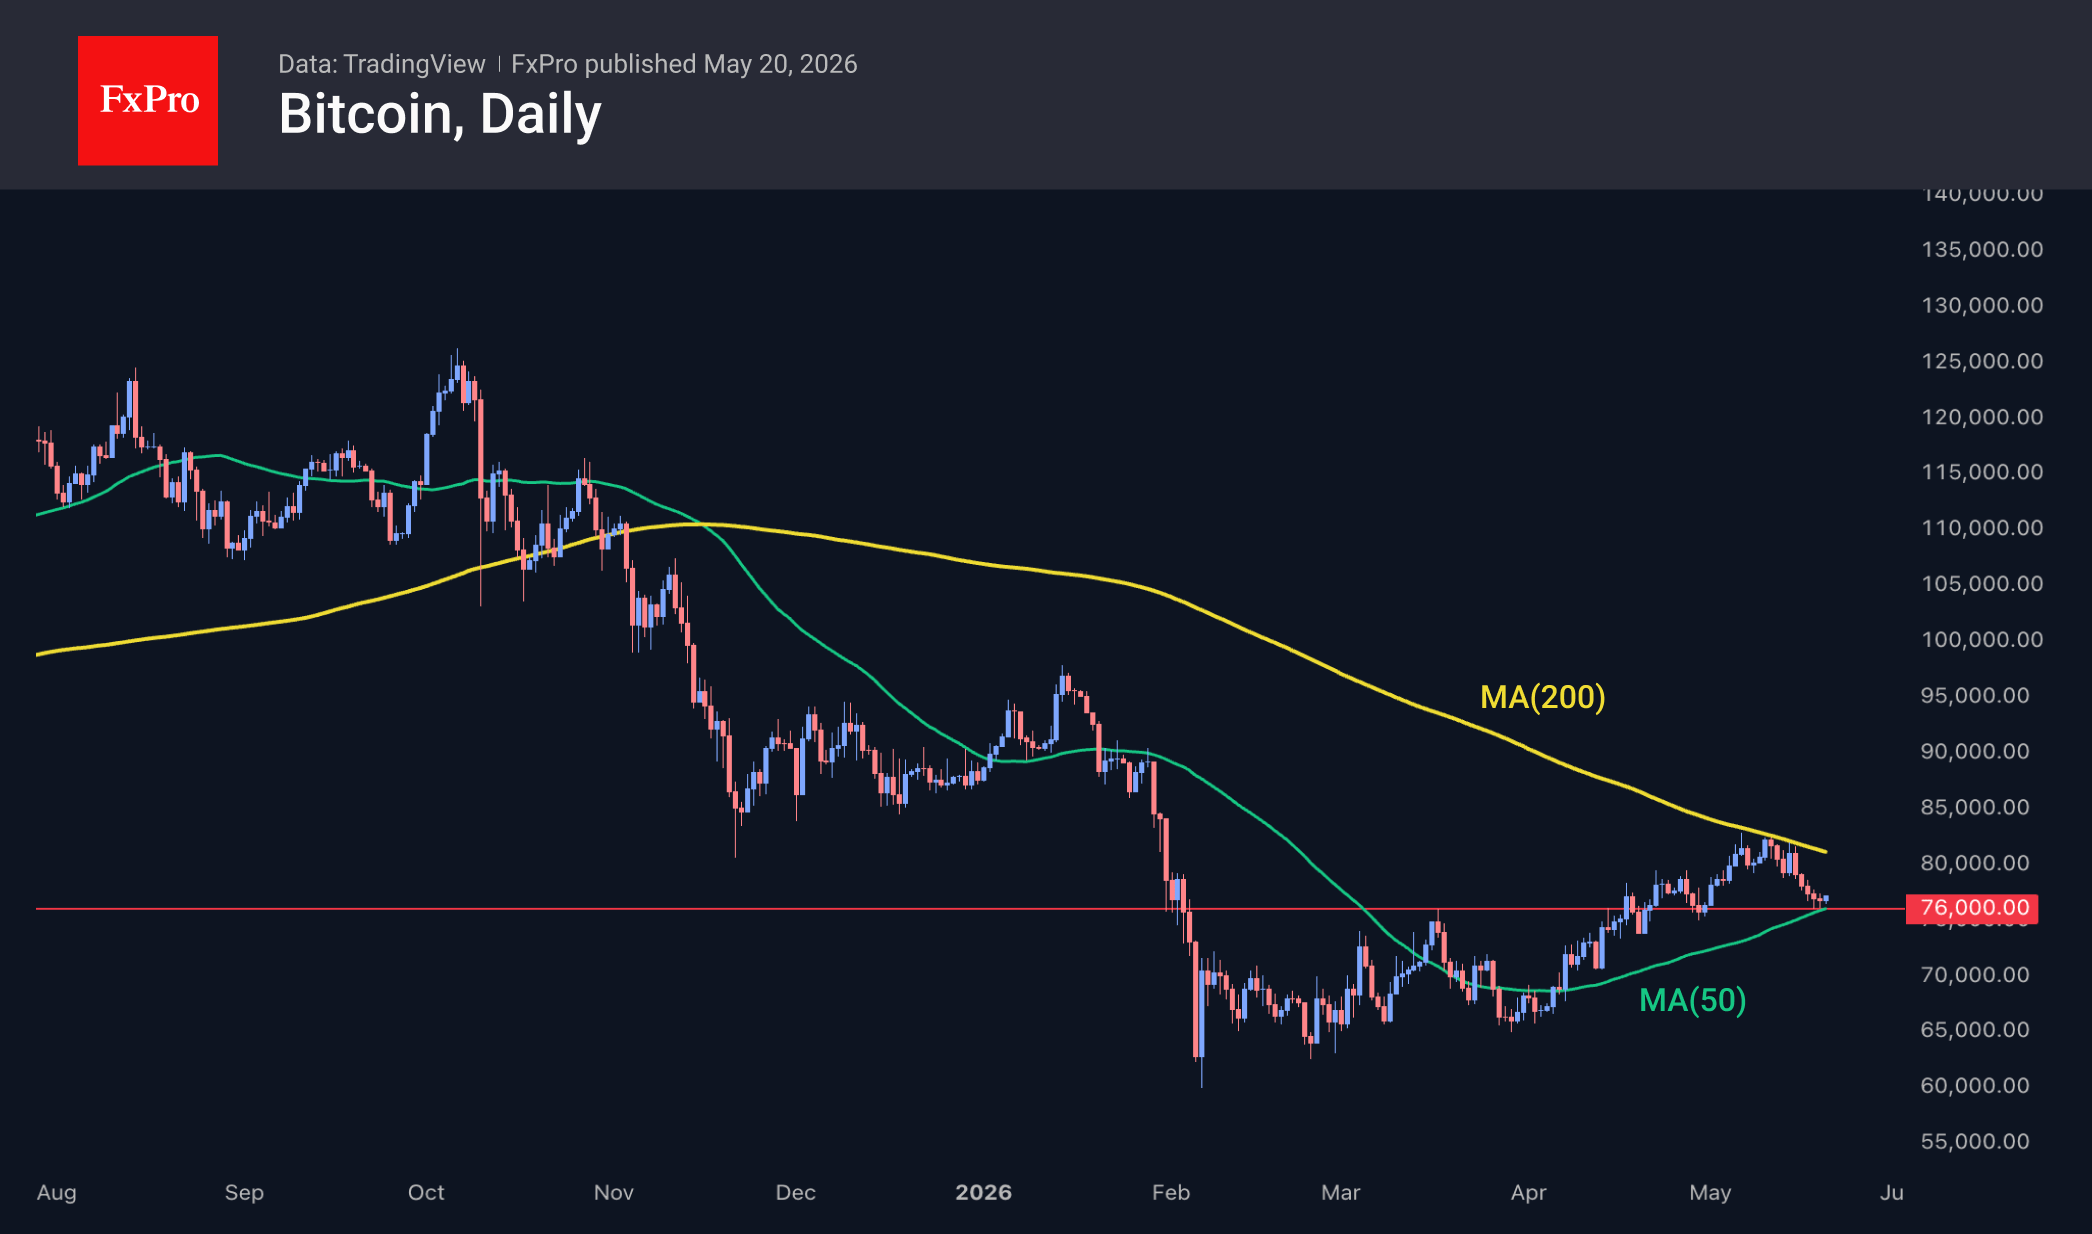
Over the last four days, the crypto market has traded within a very narrow range centred on $2.56 trillion. The market has retreated to the 50-day moving average (MA), which is acting as short-term support despite a rising dollar, falling share prices, and a decline in gold. Among the most popular coins, the day’s leaders were Algorand (+7.1%), Zcash (+2.4%) and Basic Attention (+1.8%). The biggest fallers were Toncoin (-3.9%), Immutable (-3.6%) and Neo (-2.6%).
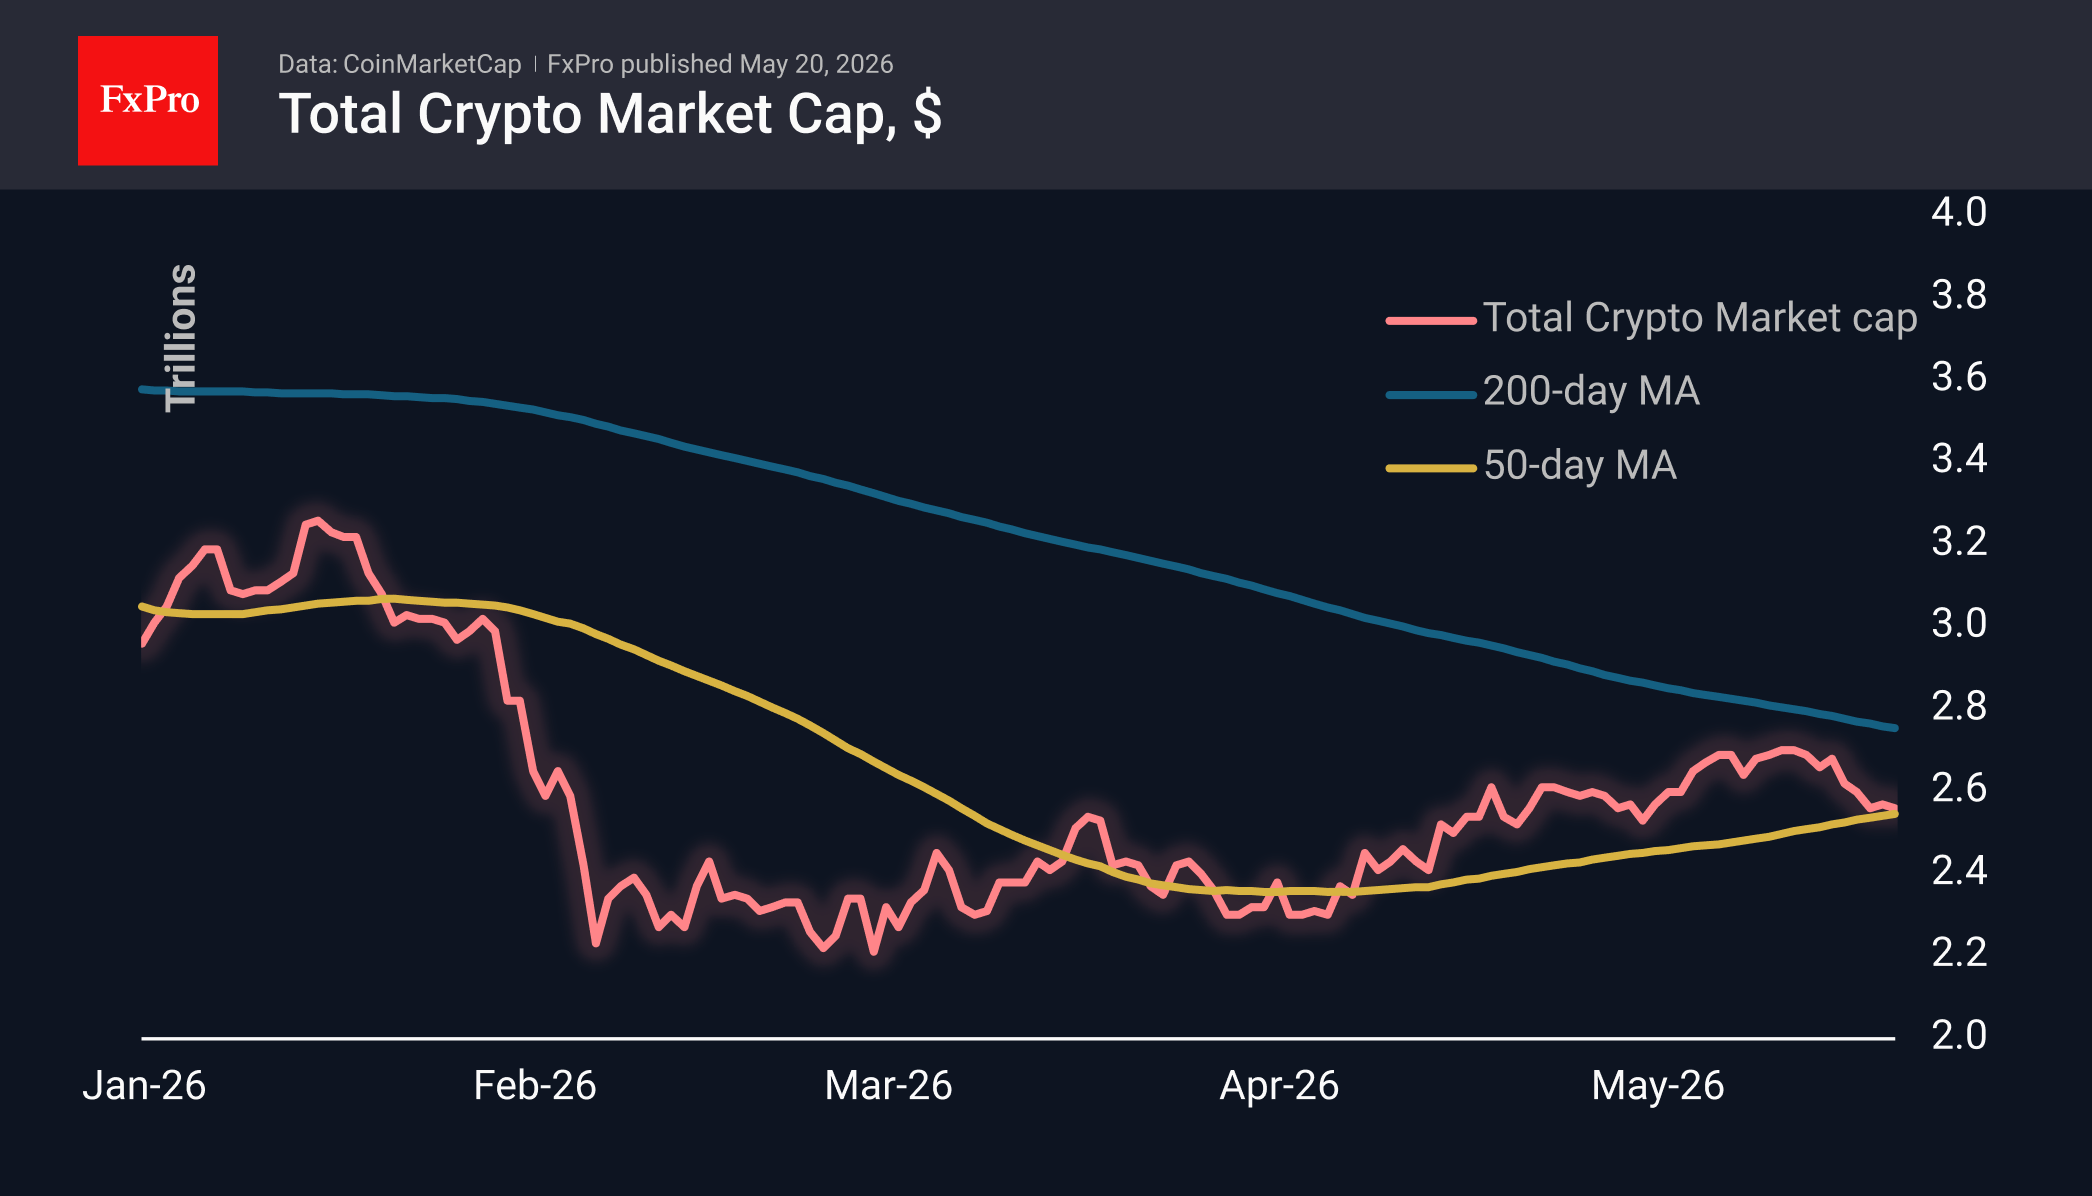
Bitcoin, as of the end of last month, found support on dips to the $76K region. Over the last couple of days, this support has been reinforced by the 50-day MA, as has the market. On the other hand, resistance at the 200-day MA continues to decline, bringing the bulls’ and bears’ red lines closer together and marking the moment when the market will choose its trend for the coming months.
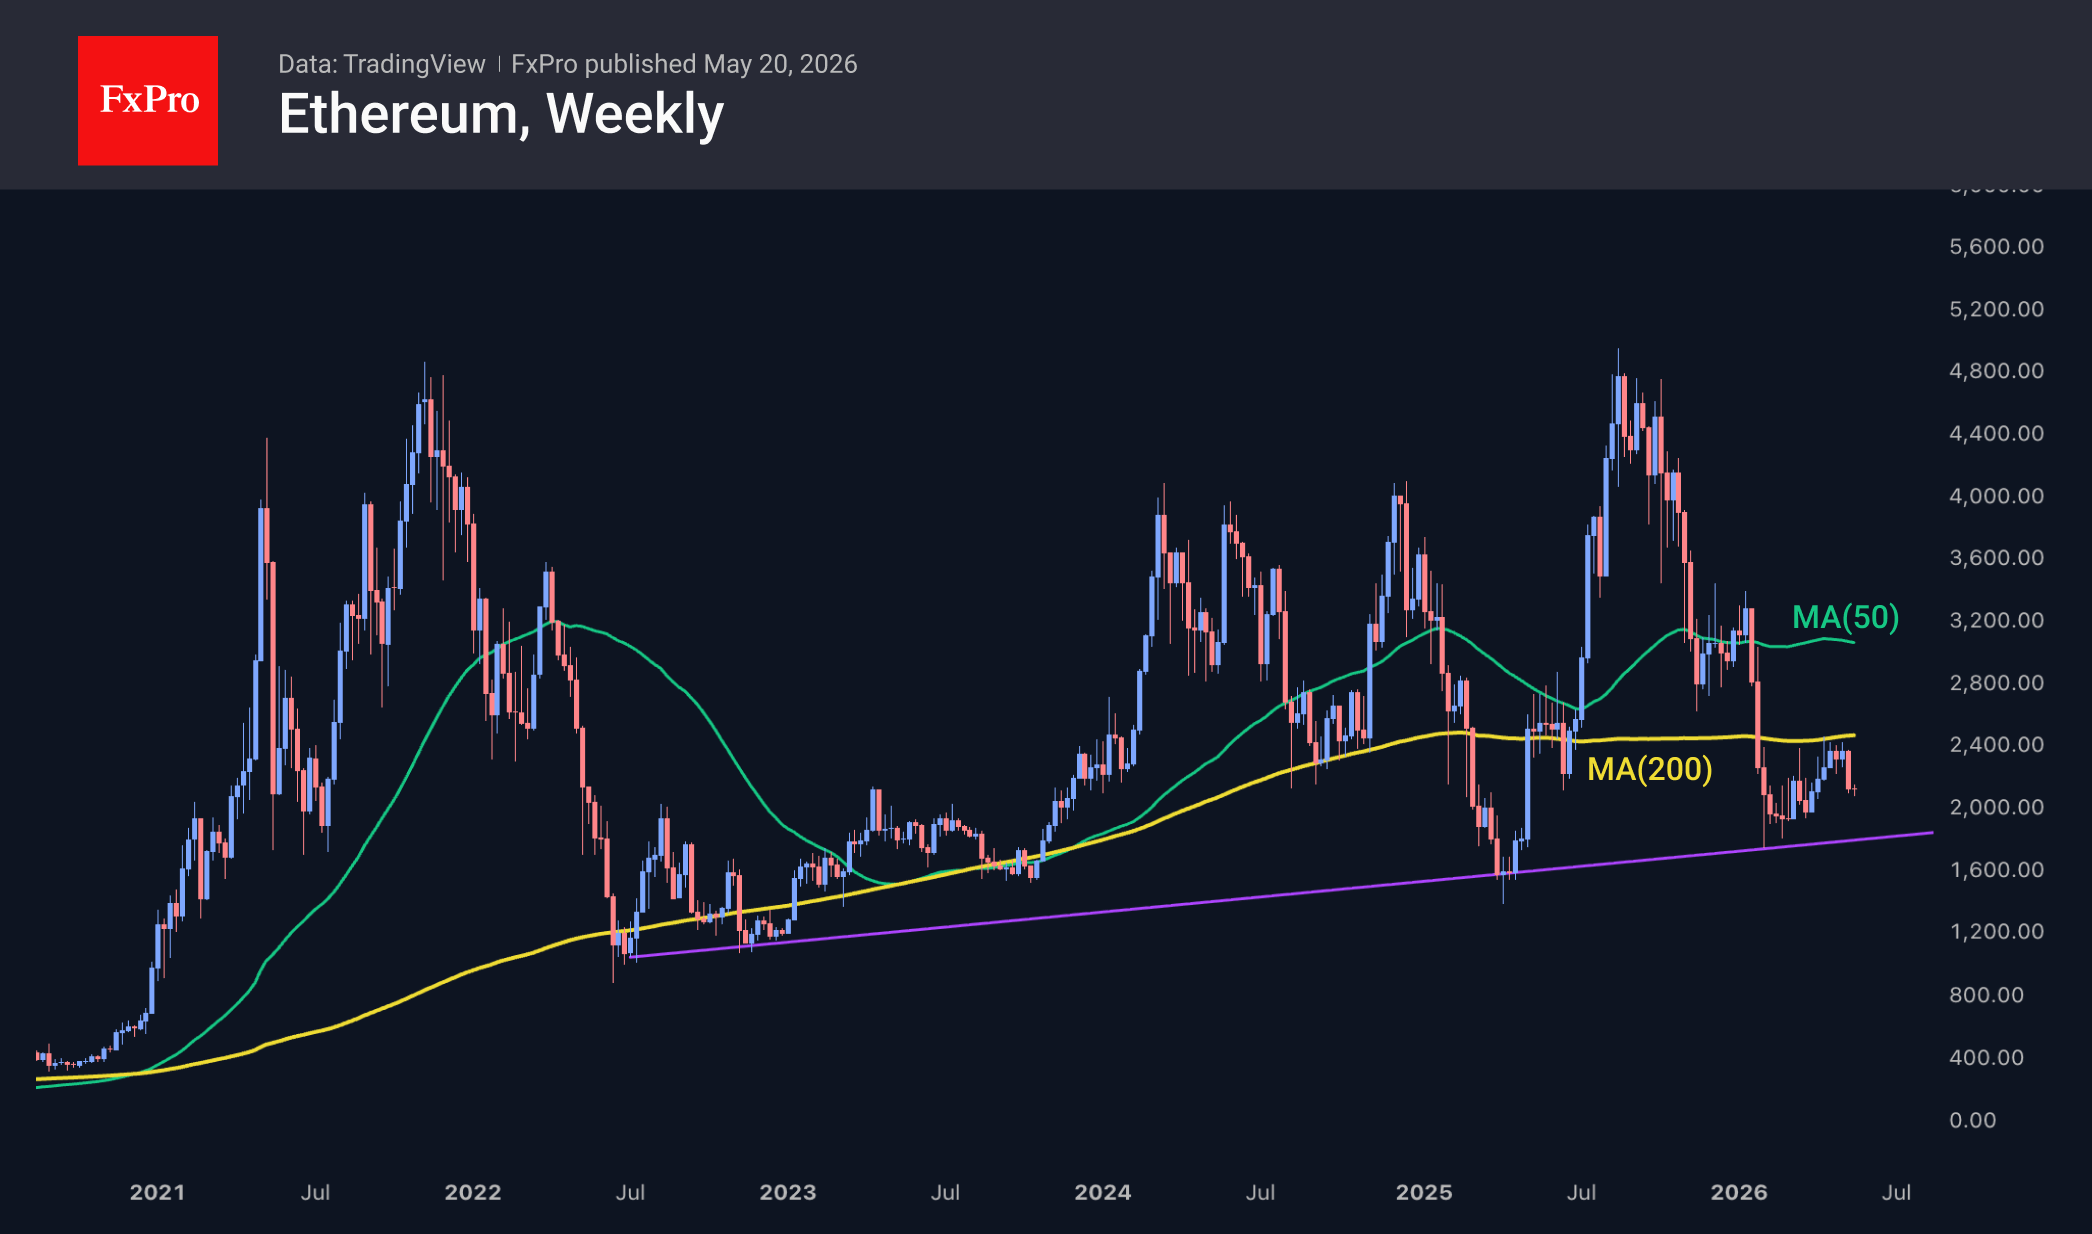
The 50-day moving average, which has become a support level for the market and Bitcoin, has not proved an obstacle for Ethereum sellers, with its price falling back to 2.1K. The second-largest cryptocurrency has remained in a sell-off since the start of the month, encountering more significant resistance at the 200-week MA. Failure to break above this line is a new development for ETH. This is the fifth instance of a dip below this ultra-long-term curve, but previously, a reversal from lows signalled a sustained bull market.
News Background
Retail investor demand for Bitcoin has fallen by 73% over the last 30 days, CryptoQuant notes. The market structure continues to shift towards large capital, whilst small investors are gradually ‘disappearing from observable on-chain activity’.
The total market capitalisation of tokenised assets is set to reach $4 trillion by 2028, according to Standard Chartered Bank. The development of this market will facilitate wider adoption of decentralised finance (DeFi) protocols.
The Bitcoin-focused DeFi protocol Echo has suspended cross-chain operations following an attack on the Monad network bridge. The actual loss amounted to approximately $816,000.
Around 10% of adult US residents have used cryptocurrency for payments or invested in digital assets, according to a Fed report. In 2021, amid the crypto market boom, the figure reached 12%.
Eurozone Inflation Accelerates to 3.0% as Energy Costs Push Headline Higher
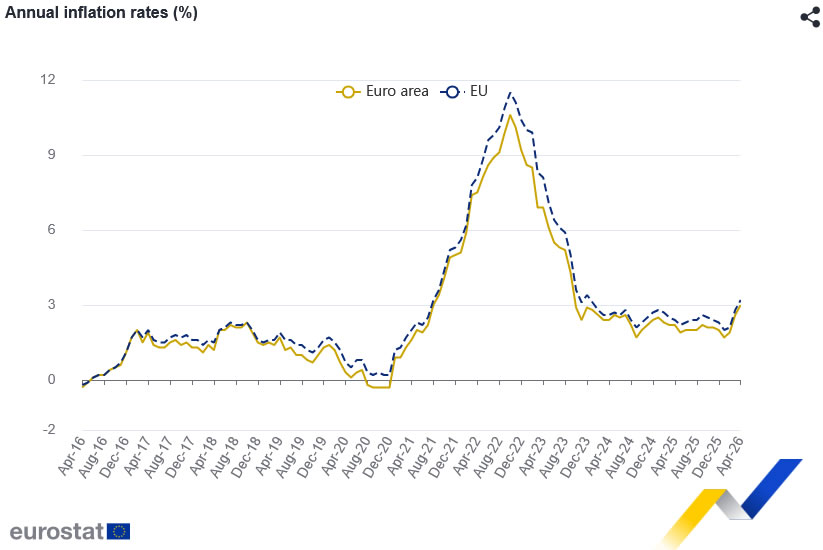
Eurozone inflation accelerated in April as rising energy prices pushed headline CPI higher, though underlying core inflation pressures eased modestly. Final data showed Eurozone CPI rose from 2.6% yoy to 3.0% yoy. Core CPI, excluding energy, food, alcohol and tobacco, slowed slightly from 2.3% yoy to 2.2% yoy.
The rebound in headline inflation was driven primarily by energy and services. Services contributed the largest share to annual inflation at 1.38 percentage points, followed by energy at 0.99 percentage points. Food, alcohol and tobacco added 0.46 percentage points, while non-energy industrial goods contributed 0.20 percentage points. The data reinforce the impact of higher global energy prices linked to the Middle East conflict, even as broader domestic price pressures show some signs of stabilization.
Across the broader European Union, annual inflation was finalized at 3.2% yoy. Inflation pressures remained uneven across the region. Sweden recorded the lowest annual inflation rate at 0.5%, followed by Denmark at 1.2% and Czechia at 2.1%. At the other end, Romania posted the highest inflation rate at 9.5%, ahead of Bulgaria at 6.0% and Croatia at 5.4%. Compared with March, inflation fell in only five EU member states while rising in twenty-one, highlighting the broadening nature of price pressures across Europe.
Eurozone CPI Summary — April 2026:
| Indicator | Previous | Latest |
|---|---|---|
| Eurozone CPI (yoy) | 2.6% | 3.0% |
| Eurozone Core CPI (yoy) | 2.3% | 2.2% |
| EU CPI (yoy) | 2.8% | 3.2% |
Contributions to Eurozone Inflation:
| Component | Contribution (pp) |
|---|---|
| Services | 1.38 |
| Energy | 0.99 |
| Food, Alcohol & Tobacco | 0.46 |
| Non-Energy Industrial Goods | 0.20 |
EUR/USD Near Six-Week Low as Market Tensions Rise
EUR/USD slipped to 1.1598 on Wednesday, keeping the pair at its lowest level in six weeks. The US dollar is supported by the escalating conflict between the US and Iran, which is increasing inflationary risks and raising expectations of potential Federal Reserve tightening.
US President Donald Trump warned that Washington could resume attacks on Iran within “two to three days” if Tehran does not accept the terms of a peace agreement. The ongoing conflict continues to restrict navigation through the Strait of Hormuz, pushing oil prices higher and increasing global inflationary pressures.
Amid this backdrop, market expectations of a Fed rate cut this year have largely evaporated. Investors are increasingly anticipating another rate hike before the end of 2026.
Attention was also drawn to comments from the President of the Federal Reserve Bank of Philadelphia, Anna Paulson. She expressed support for maintaining current interest rates and noted that any reduction in borrowing costs would likely only be feasible with a sustained slowdown in inflation.
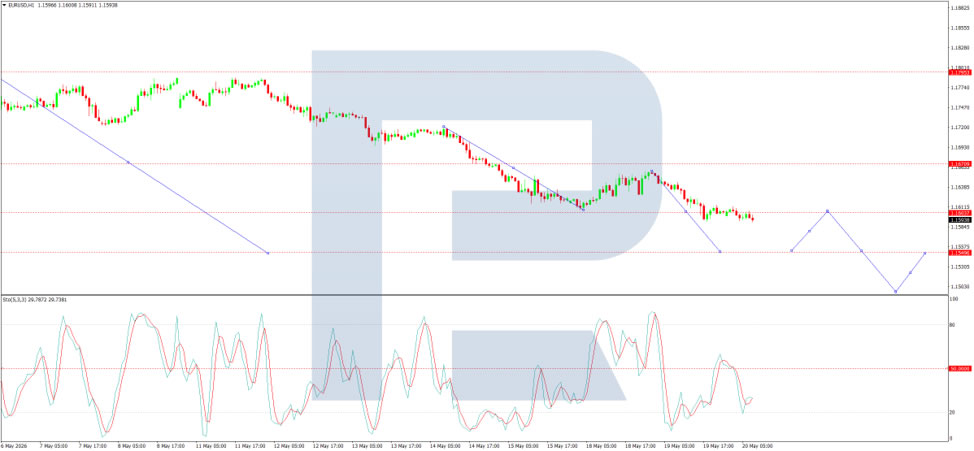
Technical Analysis
On the H4 EUR/USD chart, the pair is trading within a consolidation range around 1.1600, with potential downside towards 1.1550. A corrective rebound to 1.1600 (testing from below) is possible, followed by a further decline towards 1.1460. The MACD indicator confirms this bearish scenario, with its signal line below zero and pointing firmly downwards, reflecting continued downside momentum.
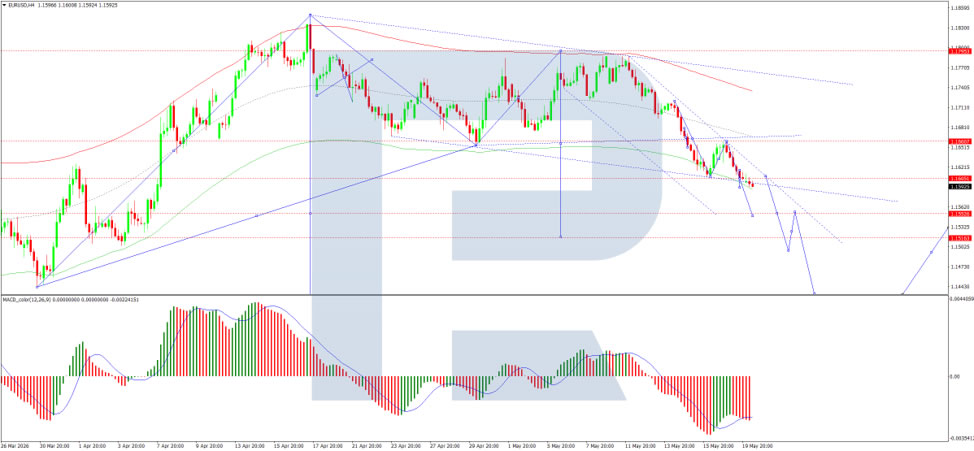
On the H1 chart, EUR/USD has reached 1.1614 and is now moving lower towards 1.1550. A rebound to 1.1615 may follow before a further decline towards 1.1460. The Stochastic oscillator supports this outlook, with its signal line below 50 and pointing firmly downwards.
Conclusion
The EUR/USD pair remains under pressure amid ongoing geopolitical tensions and rising oil prices, supporting the US dollar. Technical indicators suggest further downside is likely, although short-term corrective moves are possible. Market focus will remain on US-Iran developments and upcoming US economic data for guidance.
Commodity Currencies Retreat Ahead of the Release of the FOMC Minutes
AUD/USD is pulling back from local highs, while USD/CAD continues to recover amid a stronger US dollar and ahead of the release of the Federal Reserve minutes. Following an extended rally, commodity-linked currencies have entered a corrective phase, although the current move still appears more like profit-taking and a test of key technical levels than a full trend reversal. Market participants remain cautious ahead of the publication of the FOMC minutes, which could reshape expectations regarding the future path of US interest rates.
Additional investor attention will focus on tomorrow’s batch of Australian economic data, including labour market figures and inflation expectations. These indicators may influence expectations surrounding the Reserve Bank of Australia’s next policy steps. At the same time, the US dollar continues to draw support from rising Treasury yields and a broader decline in risk appetite ahead of key Fed-related releases.
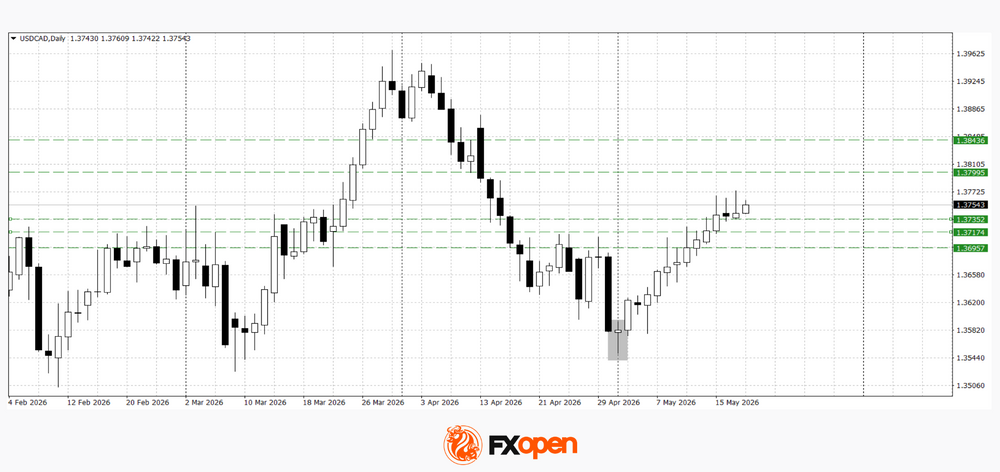
USD/CAD
USD/CAD continues to recover after forming a bullish hammer pattern. Previously highlighted levels have already been tested, and if the 1.3720–1.3730 range turns into support, the pair may continue advancing towards 1.3800–1.3840. At the same time, rejection from current levels accompanied by a bearish reversal pattern could trigger the start of a downward correction.
Key events for USD/CAD:
- today at 16:15 (GMT+3): speech by Federal Reserve Vice Chair for Supervision Michael S. Barr;
- today at 17:30 (GMT+3): US crude oil inventories;
- tomorrow at 15:30 (GMT+3): Philadelphia Fed Manufacturing Index (US).
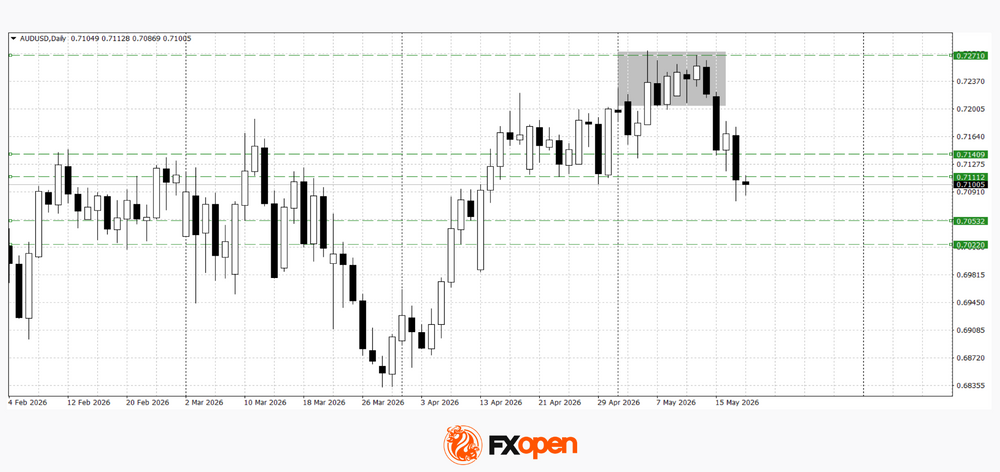
AUD/USD
The failure of AUD/USD buyers to secure a move above 0.7200 resulted in the formation of a bearish tower pattern on the daily timeframe. Technical analysis of AUD/USD points to the potential development of a downward correction towards 0.7020–0.7050. However, if price returns above 0.7140, the bearish correction scenario could be invalidated.
Key events for AUD/USD:
- today at 21:00 (GMT+3): release of the FOMC minutes;
- tomorrow at 02:00 (GMT+3): Australia Services PMI;
- tomorrow at 04:30 (GMT+3): Australian full employment change.
Overall, commodity currencies are entering a corrective phase following a prolonged rally, while the US dollar is receiving support from expectations surrounding the FOMC minutes and rising US Treasury yields. Market reaction to the Fed’s rhetoric will become the key driver for further AUD/USD and USD/CAD price action: more hawkish signals from policymakers could reinforce the current dollar rally, while softer commentary may restore demand for commodity currencies and limit the scope of the correction.
Trade over 50 forex markets 24 hours a day with FXOpen. Take advantage of low commissions, deep liquidity, and spreads from 0.0 pips (additional fees may apply). Open your FXOpen account now or learn more about trading forex with FXOpen.
This article represents the opinion of the Companies operating under the FXOpen brand only. It is not to be construed as an offer, solicitation, or recommendation with respect to products and services provided by the Companies operating under the FXOpen brand, nor is it to be considered financial advice.
Bitcoin Wanted $80K to Be a Launchpad, It Becomes an Exit Door Instead
Bitcoin’s latest rally is starting to look less like the beginning of a new bull run and more like a distribution phase inside a tightening global liquidity environment.
Only weeks ago, markets were hoping that $80K could become the new floor for Bitcoin — a psychological base strong enough to launch another powerful leg higher. Instead, the mood has shifted sharply. Bitcoin has followed the broader risk-off move lower this week as surging Treasury yields, rising Dollar strength, and deteriorating market sentiment increasingly pressure speculative assets across the board.
The institutional flow picture has deteriorated quickly. Bitcoin ETFs were already seeing steady outflows late last week, but the pace accelerated sharply again at the start of this week. Combined outflows have now surpassed $1 billion, abruptly ending a six-week streak of positive inflows that had previously supported the recovery narrative. What was supposed to be fresh breakout momentum is turning into systematic profit-taking.
The timing is not accidental. US Treasury yields are exploding higher as markets rapidly abandon expectations for Federal Reserve rate cuts and begin repricing a much more restrictive higher-for-longer environment. As yields rise toward 5%, Bitcoin faces a difficult reality: investors can suddenly earn near risk-free returns at levels not seen in years. That dramatically weakens the appeal of non-yielding speculative assets, particularly when global liquidity conditions are tightening and broader risk appetite is fading.
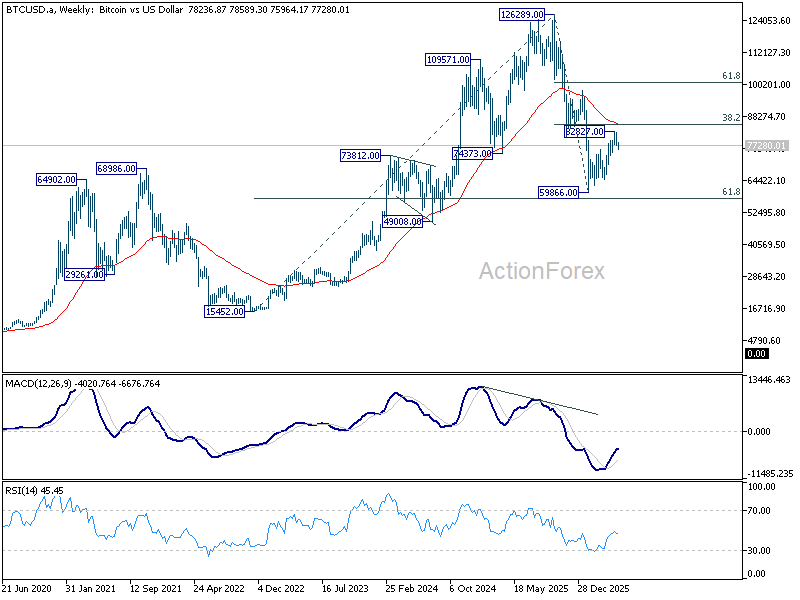
Technically, Bitcoin is facing a major resistance wall above. Price action has already touched the upper boundary of its rising channel near 81,347. There are both the 38.2% retracement of 126,289 to 59,866 at 85,239 and the 55 W EMA near 85,027 ahead. This confluence zone is likely to be extremely difficult to overcome decisively unless broader macro conditions improve materially.
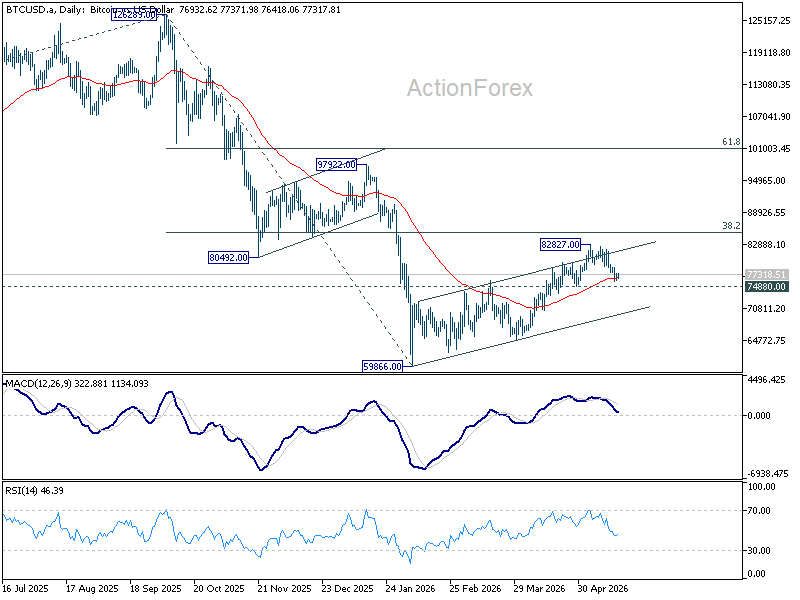
Meanwhile, downside risks are starting to dominate the technical picture. Firm break below 74,880 support would strongly suggest the rebound from 59,866 has already ended as a corrective bounce. In that case, Bitcoin could quickly slide toward the channel floor near 69,616 at least, with risk of revisiting $60k psychological level, as rising Treasury yields continue draining liquidity out of crypto and back into Dollar assets.