
Sample Category Title
Sunrise Market Commentary
Markets
The ‘highest since narrative’ that recently haunted the long end of bond curves in multiple countries yesterday culminated in the US 30-y yield breaking beyond the 5.15%/5.17% 2025/2023 peak levels. The tenor reached the highest level since 2007. Markets reposition as supply disruptions of oil and other commodities/products might cause inflation to stay higher for longer, but that’s only part of the explanation. A yield decomposition learns that the latest upleg in LT (US) yields is at least as much driven by higher real yields alongside the protracted rise in inflation expectations. This suggests a broader rise in (fiscal and other) risk premia which, if lasting, might spread to other markets. Returning to the day-to-day observations, there was again no hard indication yesterday that the US and Iran are moving closer to a solution of the conflict/a workable reopening of Hormuz. US President Trump at least keeps the threat of another “Big Hit” in order to accept US priorities. In this context, Brent oil held in the $109/110 p/b area. Markets at least see these levels as too high to be ignored by most central banks. US yields added between 5.75 bps (30-y) and 9.1 bps (5-y) on a daily basis, the belly of the curve underperforming. US money markets fully embrace the idea of a 25 bps Fed rate hike by the turn of the year. German yields rose between 4.9 bps (5-y) and 2.9 bps (30-y). Market discount a June rate hike (85%) followed by two other steps by the end of the year. Most ECB policy makers avoid specific guidance on the June meeting and hold to a data-dependent approach. Still Austrian ECB member Kocher at least clarified his reaction function, citing that there will be “no alternative” to a June rate hike unless there is an improvement in the Middle East conflict by then. The rise in (real) yields might become a drag on the equity performance. US Indices yesterday eased between 0.5-1%. Risk-off and higher real yields also support the dollar. DXY is testing the 99.34 resistance (end April top). EUR/USD is at risk of falling below the 1.16 big figure.
Asian equity markets remain in risk-off modus this morning. A closely watched 20-y Japanese Bond auction attracted solid investor interest (above average bid-cover) after the recent rise in yields. The 20-y yield at some point declined almost 10 bps (compared to opening levels), but part of that move is currently already reversed. For now there is hardly any positive spill-over to the US treasury market (30-y unchanged at 5.18%). The Japan Fin Min reiterates willingness to intervene to support the yen while US Treasury Secretary Bessent reconfirmed his confidence in BoJ Governor Ueda being able to successful run policy to bring the yen in line with fundamentals. Yen gains, if any, were temporary and limited (USD/JPY 159). Later today, the eco calendar is again thin. The Fed publishes the Minutes of the April policy meeting. UK April CPI inflation, published this morning, printed softer than expected (headline 2.8%Y/Y from 3.3%; core 2.5% from 3.1%; services 3.2% from 4.5%). However output PPI was higher than expected. In a first reaction sterling holds near EUR/GBP 0.866. This afternoon BoE governor Bailey and some of his MPC members will testify before a Parliament committee. After the close, Nvidia results might be interesting to see the market reaction in a context of rising (real) yields.
News & Views
The European Commission in a package unveiled yesterday presented several measures to tackle high prices of crop nutrients as well as secure supplies with the aim of avoiding food price spikes similar to 2022 when farmers have burned through supplies bought before the Iran war erupted. That could happen as soon as the end of the year. Around a third of globally traded fertilizers transited through the now-closed Strait of Hormuz. The Commission will explore stockpiling fertilizer supplies, requiring member states to have seasonal or minimum stocks, and possibly move to joint procurement of fertilizers and their components.
New Zealand households expect inflation to quicken to 5.6% (mean) in the year ahead, the June quarterly survey by the Reserve Bank of New Zealand revealed this morning. This compares to the 5.2% of the March survey. Inflation two years ahead was seen at 4.9%, materially up from 3.4%. The central bank is targeting 1-3% over the medium term but that’s not even reachable, according to households, in five years (4%, from 3.3%). Current inflation stands at 3.1% (Q1 2026) but families are perceiving price increases to the tune of 7.5%.
FOMC Minutes in Focus amid Iran Tensions and Higher Yields
In focus today
In the US, the minutes from FOMC's April meeting will be released tonight. Markets are looking for further forward-looking views after the divided rate decision. We will also keep an eye out for forward guidance on the Fed's balance sheet operations, namely the reserve management purchases of T-bills, which were not discussed in the press release after the meeting.
In the euro area, we receive the final inflation print for April which is expected to confirm the flash release with headline at 3.0% y/y and core at 2.2% y/y. We expect the details to confirm that the inflationary impact of the war in Iran is currently visible only in energy components.
In Denmark, the flash GDP for Q1 will be released. We expect Q1 GDP growth will land at a solid 1% q/q, driven primarily by strong pharma growth, as indicated by recent industrial production figures.
In the UK, CPI inflation for April is released. The UK has been on a continuous disinflationary path until the surge in oil prices. This is now likely to trigger another rebound in inflation, adding pressure on households. The Bank of England (BoE) will look closely for second-round effects, but with the cooling labour market in mind, the recession risk is probably more imminent than the inflation risk.
Overnight, Japanese May PMIs will be released. Q1 GDP showed stronger-than-expected 2.1% annualised growth, but April PMIs signalled softer overall momentum and weaker business confidence. May's readings will be key to see whether resilience is fading further amid higher energy costs, supply chain concerns and ongoing geopolitical uncertainty.
Economic and market news
What happened overnight
In the US-Iran war, conflicting signals are keeping a geopolitical risk premium in oil and natural gas prices. Trump has again threatened to resume strikes, giving Tehran "two to three days" to make a deal and saying the United States is "not leaving Iran yet" and is "going to do it right". Iran's army spokesman has warned that Tehran would open new fronts if attacked. Despite some diplomatic overtures, meaningful progress in peace talks has yet to materialise. Vice President Vance says negotiations have made "a lot of progress" and that neither side wants renewed fighting but also stresses that the US is prepared to act militarily if Iran rejects a nuclear deal. The US Senate has advanced a War Powers Resolution to constrain further escalation.
What happened yesterday
Global bond yields rose as inflation expectations accelerated and markets increasingly priced the next Fed move as a hike rather than a cut. The selloff in US Treasuries continued, with the 30Y yield briefly reaching its highest level since 2007, as fiscal expansion and rising term premia weighed on the long end of the curve. We see a similar move in Europe, with government bond yields rising. In Japan, record-high government bond yields confirm that investors are adjusting to a world of higher interest rates.
In the UK, labour market data softened as payrolls fell by 100k in April and unemployment edged up to 5.0% in March. Wage indicators painted a mixed picture. Underlying regular pay growth (excl. bonuses) eased to 3.4% in March, while average weekly earnings on a three‑month basis rose to 4.1%, above expectations of 3.8%, partly boosted by public sector payments. The BoE's preferred measure, private sector regular pay growth, slowed to 3.0% y/y. Employers stated that in the face of higher payroll taxes and tighter labour rules, they have cut hiring and vacancies. The figures, alongside the drag from the Iran war, prompted investors to scale back BoE rate hike expectations.
In the US, ADP's weekly employment data point to stable job growth, with private employers adding an estimated average of just over 42,250 jobs per week in the four weeks to 2 May 2026. While not usually a market mover, the release does continue the string of solid high-frequence labor market data received over the past weeks.
Equities: Equities sold off again yesterday, with the same narrative that has dominated since late last week: the combination of debt concerns, inflation worries and oil/geopolitics still overriding an otherwise constructive macro and earnings backdrop. That said, yesterday's negative catalyst was not oil. Crude was marginally lower, and the pressure came much more clearly from rates, especially the long end of the curve, led by the US late in the session. The equity rotation was therefore very consistent with a rates-driven risk-off move: defensive value, minimum volatility and energy outperformed. Some pause and reversal in the cyclical/tech trade should not be seen as particularly unusual after the extreme equity returns and very aggressive rotation into cyclicals that we saw from the 30 March lows into mid-May. Still, our base case is not that long-end yields continue to rise on debt fears, just as our base case remains that the Strait of Hormuz reopens relatively soon. It goes without saying, as long as this is the dominating narrative, then we are wrong in our view. This morning, the same dynamics are visible in Asia, with Japanese equities leading the decline, while semiconductors are less under pressure today. European and US futures are also lower this morning.
FI and FX: With the sell-off in global bonds taking another leg yesterday, risk appetite has again turned sour and the USD has strengthened. EUR/USD is now back testing the 1.16-figure while risk sensitive currencies in AUD, MXN and the CEEs have come under renewed pressure. Notably, the Scandies have kept up relatively well so far despite the negative nature behind US bond yields posting new highs, real rates moving higher and curves bear flattening.
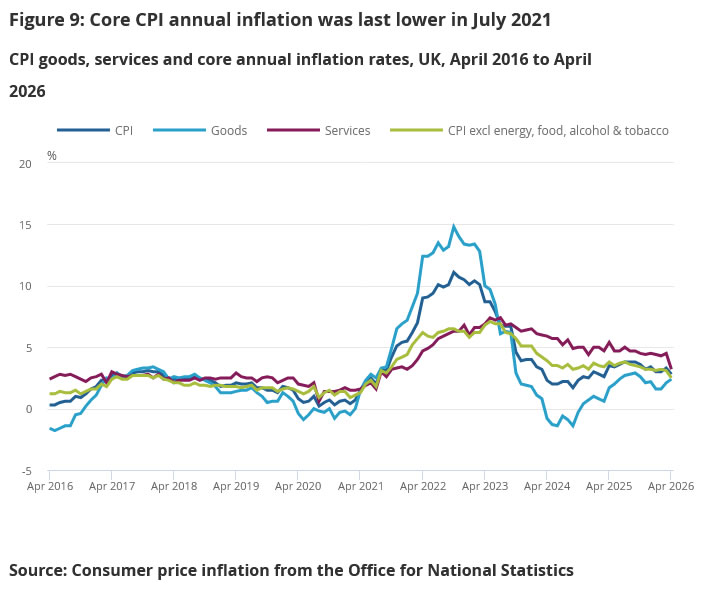
UK Inflation Slows Sharply to 2.8%, Easing Immediate Pressure on BoE
UK inflation slowed more sharply than expected in April, offering the Bank of England some near-term relief as both headline and core price pressures cooled to multi-year lows.
Headline CPI decelerated from 3.3% yoy to 2.8% yoy, below expectations of 3.0% yoy and the lowest level since March 2025. Core CPI, which excludes energy, food, alcohol and tobacco, slowed from 3.1% yoy to 2.5% yoy, undershooting forecasts of 2.7% yoy and marking its lowest reading since July 2021.
The details of the report showed a notable easing in domestic inflation pressures, particularly in the services sector. CPI services inflation fell sharply from 4.5% yoy to 3.2% yoy, a development likely welcomed by policymakers given the BoE’s focus on sticky services prices and wage-driven inflation. Meanwhile, goods inflation edged higher from 2.1% yoy to 2.4% yoy. On a monthly basis, CPI rose 0.7% in April 2026.
Still, the BoE is unlikely to interpret the report as a definitive inflation victory. Much of the downside surprise appears linked to favorable base effects, as this year’s prices were compared against the sharp energy-related increases seen a year earlier. Policymakers are also expected to remain cautious given the recent surge in global oil prices and broader energy costs linked to the Middle East conflict, which could gradually feed back into supply chains and consumer prices in the months ahead.
Even so, today’s data significantly lowers the risk of the BoE delivering another rate hike in the near term and strengthens the case for a patient wait-and-see stance.
| Indicator | Previous | Latest | Expectation |
|---|---|---|---|
| Headline CPI (yoy) | 3.3% | 2.8% | 3.0% |
| Core CPI (yoy) | 3.1% | 2.5% | 2.7% |
| CPI Goods (yoy) | 2.1% | 2.4% | — |
| CPI Services (yoy) | 4.5% | 3.2% | — |
| CPI (mom) | — | 0.7% | 0.9% |
Nvidia Day
It’s the same story, different day. Trump yesterday first called off an attack on Iran, then said he would resume strikes if they can’t agree on a deal. NATO said it could help secure shipping routes around the Strait of Hormuz if disruptions persist into early July. Europeans reportedly eased some sanctions on Russia as energy security concerns remain high.
Alas, geopolitical uncertainties continue. Traffic through the Strait of Hormuz remains at a near standstill, world oil inventories continue tightening, and oil prices keep rising. The latter fuels global inflation expectations and pushes global yields higher on rising bets that central banks may have to fight price pressures despite the worsening economic outlook. The OECD revised its economic outlook lower, factoring in the prolonged Middle East conflict and its global repercussions.
In this context, the US 30-year yield has climbed back to levels last seen before the subprime crisis, while the US 10-year yield approached the 4.70% mark as the Japanese 10-year yield soared toward 2.80% — levels last seen before 2000 — and consolidated near that level this morning.
The gap between US and Japanese yields is approaching an uncomfortable zone — around 190bp for the 10-year spread — increasing the risk of a carry unwind that could send another shockwave across global risk markets. I believe that a move toward the 2.90–3% range in the 10-year JGB yield could trigger a broader reverse carry trade, pulling USDJPY lower along with global equities.
On the FX front, the USDJPY is softer this morning, but not because of the narrowing yield differential — which makes US dollar returns less attractive — but because Japanese officials again warned they could intervene if the pair rises further. This morning, USDJPY is trading between its 50-DMA on the downside and 159.10 on the upside. Any move higher could trigger another intervention and another short-term relief rally for the yen, without necessarily leading to a sustainable bearish shift in USDJPY.
On the equities front, the S&P 500 fell for a third straight day on the back of rising yields, the Nikkei is down more than 1.6% at the time of writing, and the Kospi is retreating nearly 2% as investors’ focus shifts from shiny earnings to geopolitical turmoil.
It’s in this chaotic market — where earnings optimism has started to lose momentum — that Nvidia will announce its Q1 results today, after the bell.
All eyes on Nvidia!
Expectations are, of course, sky high. The company is expected to report around $79bn in revenue — roughly 15% higher than last quarter and nearly 80% above the same quarter last year.
Margins are also expected to remain exceptionally strong, around 75%, confirming that Nvidia still enjoys enormous pricing power despite the massive Blackwell ramp and rising competition.
But Nvidia’s earnings no longer carry the same existential weight they did at the very beginning of the AI craze. Back then, markets were obsessed with training AI models. GPUs became essential because they are incredibly efficient at handling thousands of calculations simultaneously — exactly what AI training requires. Imagine trying to get from point A to B by simultaneously testing millions of possible paths through C, D, F, X, Y or Z. GPUs are built for that kind of parallel processing power. CPUs, on the other hand, are designed for sequential computations.
As such, once the models are trained with GPUs, the focus increasingly shifts toward inference — running the trained model — where TPUs and CPUs can also play a major role, while memory chips are needed to store and process information efficiently.
That’s why GPUs say more about the raw power and evolution of AI models, while CPUs and memory chips increasingly say more about real-world AI adoption and scaling. This growing importance of CPUs and memory infrastructure is also why traditional CPU and memory chip makers have taken over part of the AI narrative — and why Nvidia is developing its own CPU technologies within its next-generation Vera Rubin platform.
Investors will therefore closely watch whether the company can maintain strong margins while scaling production and preparing the transition toward the next-generation Vera Rubin platform — designed for the next phase of AI focused on massive-scale inference, reasoning and AI “factories.”
And the competition for running models efficiently at lower cost is fierce. Besides traditional chipmakers like AMD and Intel, Nvidia’s biggest clients — Big Tech companies like Amazon, Google and Meta — are all working on their own in-house chips to build the most energy- and cost-efficient alternatives to Nvidia’s ultra-powerful premium products.
Nvidia closed near $220 per share yesterday, around $16 below the all-time high reached last week. Options markets are currently pricing an implied move of roughly 6% to 8% in either direction following the earnings announcement. But the direction is difficult to predict. Expectations are now so elevated that even a solid beat may not trigger the euphoric rallies seen during the early AI boom.
Regardless of the strength of Nvidia’s results, three risks are piling up as Big Tech companies continue to trade at near-perfect valuations:
- Prospects of tighter financial conditions linked to the Middle East conflict, which could slow AI adoption and scale back revenue expectations
- Capacity constraints due to supply chain disruptions, which could limit production, increase costs and weigh on profit expectations
- Rising competition, which could eat into margins.
And that’s why even great results from Nvidia may not prevent profit-taking that would feel healthy at current valuations.
Surging 30-Year Bond Yield Flirts with 5.20% as Market Eyes NVIDIA and Bank of England Dilemma
Key Takeaways
- Surging global bond yields intensified pressure on equity markets as the US 30-year Treasury yield approached the critical 5.20% level, reinforcing fears that the Federal Reserve may shift toward future rate hikes instead of cuts.
- Markets are highly focused on NVIDIA earnings, with options markets implying a massive post-results valuation swing that could determine the near-term direction of AI-related equities and the broader Nasdaq 100.
- Asia-Pacific markets are mixed due to rising yields and currency stress in today's Asia opening session.
- Chart of the day: Gold (XAU/USD) bearish breakdown from 1-month range, eyeing next intermediate supports at $4,415 and $4,319.
Top Macro Headlines
- Inflation worries fuel massive global bond sell-off: Wall Street fell on Tuesday for the third consecutive session as intensifying inflation panic pushed long-dated US bond yields to their highest levels since 2007. The 30-year US Treasury yield is flirting with the critical 5.20% threshold.
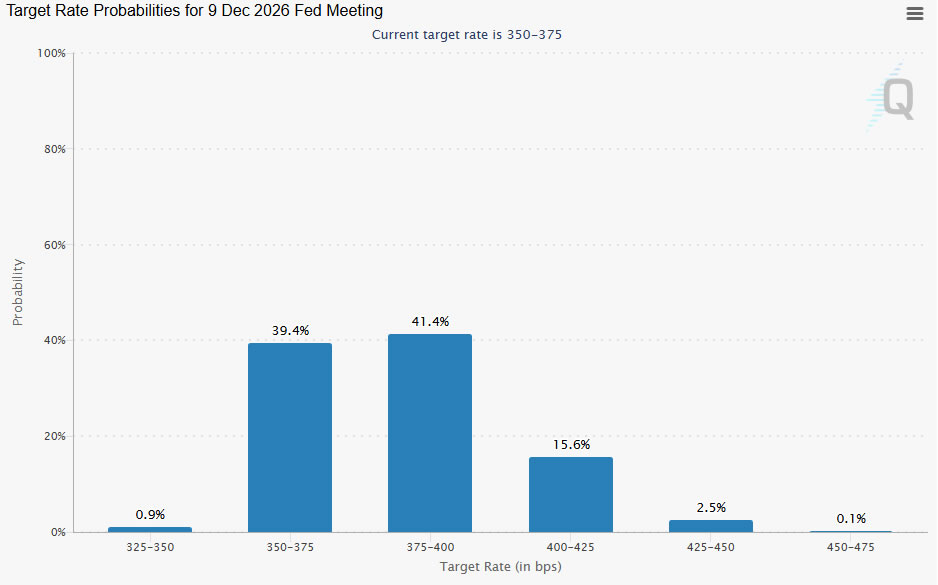
- Fed rate hike pressures intensify: The massive bond rout reflects a structural shift in monetary policy expectations. US futures are now indicating a greater than 50% probability of a Federal Reserve interest rate hike later this year, effectively eliminating previous hopes for a rate cut.
- Bessent outlines hardline Iran stance: US Treasury Secretary Scott Bessent called on global allies to forcefully disrupt Iran's financing networks. He announced a comprehensive review of the US sanctions list to make it easier for financial institutions to root out sophisticated terrorist financing schemes. Concurrently, oil markets saw a brief reprieve after J.D. Vance cited progress in US-Iran peace talks, leading President Trump to hold off on a scheduled attack.
- Japan cranks up FX intervention warnings: With the Japanese Yen sliding through 159 per USD toward the critical 160 level, Finance Minister Satsuki Katayama delivered a harsh warning at the G7 meeting in Paris, stating that Tokyo is fully prepared to step back in to defend the currency.
- NVIDIA earnings loom amid options-driven swings: Markets are bracing for NVIDIA’s highly anticipated quarterly earnings report on Wednesday. Options data indicate that the chipmaker is set for a staggering $350 billion market cap price swing following the release.
Key Macro Themes
- The sovereign yield storm vs. tech valuations: Soaring bond yields are driving up discount rates, directly threatening the present value of future earnings for high-growth tech firms. This yield breakout comes at an incredibly vulnerable moment, as hyperscalers take on record debt to fund an estimated $700 billion in AI capital expenditure this year.
- Central bank “rock and a hard place” scenarios: Multi-year macro shocks are pushing central banks into intense policy trade-offs. For example, the brutal UK labor data, showing a 100,000 drop in April payrolls, directly conflicts with Wednesday's impending hot inflation data, leaving the Bank of England with a choice between supporting growth and containing prices.
- Diminishing returns on FX intervention: Sources suggest Japan has already deployed roughly 10 trillion yen since late April to defend its currency. The yen's quick relapse to 159 per USD underscores that massive intervention capital is failing to buy central banks' sustainable breathing room against the widening US yield advantage.
Global Market Impact
Equities: Wall Street pulled back, with the S&P 500 and Dow Jones dropping 0.7% and the Nasdaq falling 0.8%. Decliners were led by communication services, consumer discretionary, and materials, down 1.3% to 2.3%.
Fixed Income: Sovereign debt markets faced a violent sell-off. The long end of the curve buckled under inflation fears, sending the 30-year US yield flirting with 5.20%, its highest point since 2007.
FX: The US Dollar Index remained dominant. The Japanese Yen slipped past 159 per USD to print an intraday high of 159.25 on Tuesday, 19 May, entering the acute intervention danger zone. India's Rupee slumped further, printing a record closing low for the sixth consecutive session to hit a record low of 96.52 per USD in today’s Asia opening session.
Commodities: WTI and Brent crude oil remained firm in the past 24 hours, recording gains of 1% on Tuesday, 19 May. Non-yielding precious metals plunged on yield pressures, with spot Gold dropping 1.8% and silver cratering 5%.
Asia Pacific Impact
- Regional equity bloodbath except Singapore: Asia-Pacific stock markets absorbed severe shocks. South Korea's KOSPI suffered a brutal 3.3% sell-off on Tuesday, 19 May, leading regional losses as the tech-heavy gauge reacted to rising risk-free rates and structural hardware supply-chain vulnerabilities. Meanwhile, Singapore’s Straits Times Index bucked the trend, surging by 1.5% to a new record high, supported by defensive dividend stocks. However, rising bond yields triggered profit-taking today, with STI dropping by 0.7% at the open and steep losses seen in the Nikkei 225, down 1.2%, ASX 200, down 0.8%, and Hang Seng Index, down 0.6%. Meanwhile, KOSPI traded almost unchanged, and China A50 rose by 0.2%.
- Currency degradation and intervention tensions: The broad surge in the greenback and global yields forced intense pressure onto regional currencies. The multi-day record lows for the Indian Rupee and the Yen's collapse past 159 per USD are stoking severe cross-border capital flight risks.
Top 3 Events to Watch Today
- UK CPI and PPI (Apr) - 2.00 pm SGT Impact: GBP/USD, GBP crosses, FTSE 100, UK gilts
- FOMC Minutes - 2.00 am SGT Impact: All asset classes
- NVIDIA Q1 Earnings Release - after close of US session Impact: NVIDIA shares, Nasdaq 100, S&P 500, semiconductor and AI-related stocks
Chart of the Day: Gold Bearish Breakdown from 1-Month Range Support
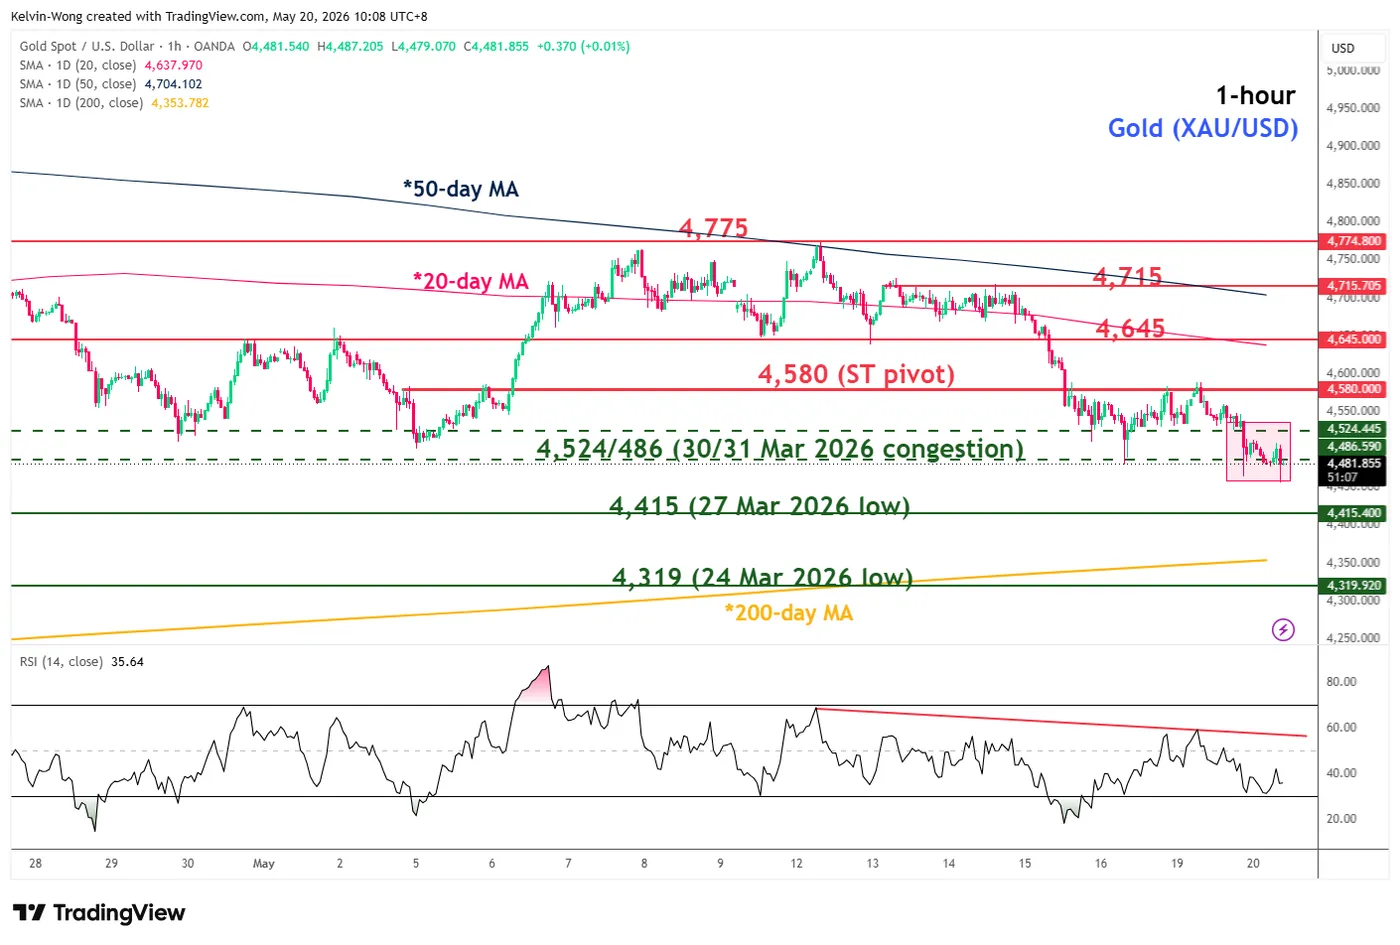
Fig. 1: Gold (XAU/USD) minor trend as of 20 May 2026. Source: TradingView.
Gold (XAU/USD) has staged a bearish breakdown from its former one-month range support at $4,486. In addition, the hourly RSI momentum indicator has continued to exhibit bearish momentum conditions below the 50 level.
Watch the $4,580 key short-term pivotal resistance to maintain the minor bearish trend for the next intermediate supports to come in at $4,415 and $4,319, also close to the key 200-day moving average.
However, a clearance and an hourly close above $4,580 negates the bearish tone for a potential corrective rebound to retest the next intermediate resistances at $4,645 and $4,715, also the 20-day and 50-day moving averages.
Gold Sees Heavy Selling Ahead Of Key FOMC Minutes Event
Key Highlights
- Gold started a fresh decline below the $4,600 support.
- A major bearish trend line is forming with resistance at $4,660 on the 4-hour chart.
- WTI Crude Oil regained traction and climbed above $105.
- EUR/USD could continue to move down toward 1.1550.
Gold Price Technical Analysis
Gold failed to surpass $4,800 and trimmed gains against the US Dollar. The price dipped below $4,700 and $4,600 to enter a bearish zone.
The 4-hour chart of XAU/USD indicates that the price even declined below $4,550, the 100 Simple Moving Average (red, 4 hours), and the 200 Simple Moving Average (green, 4 hours). A low was formed at $4,480, and the price is now consolidating losses.
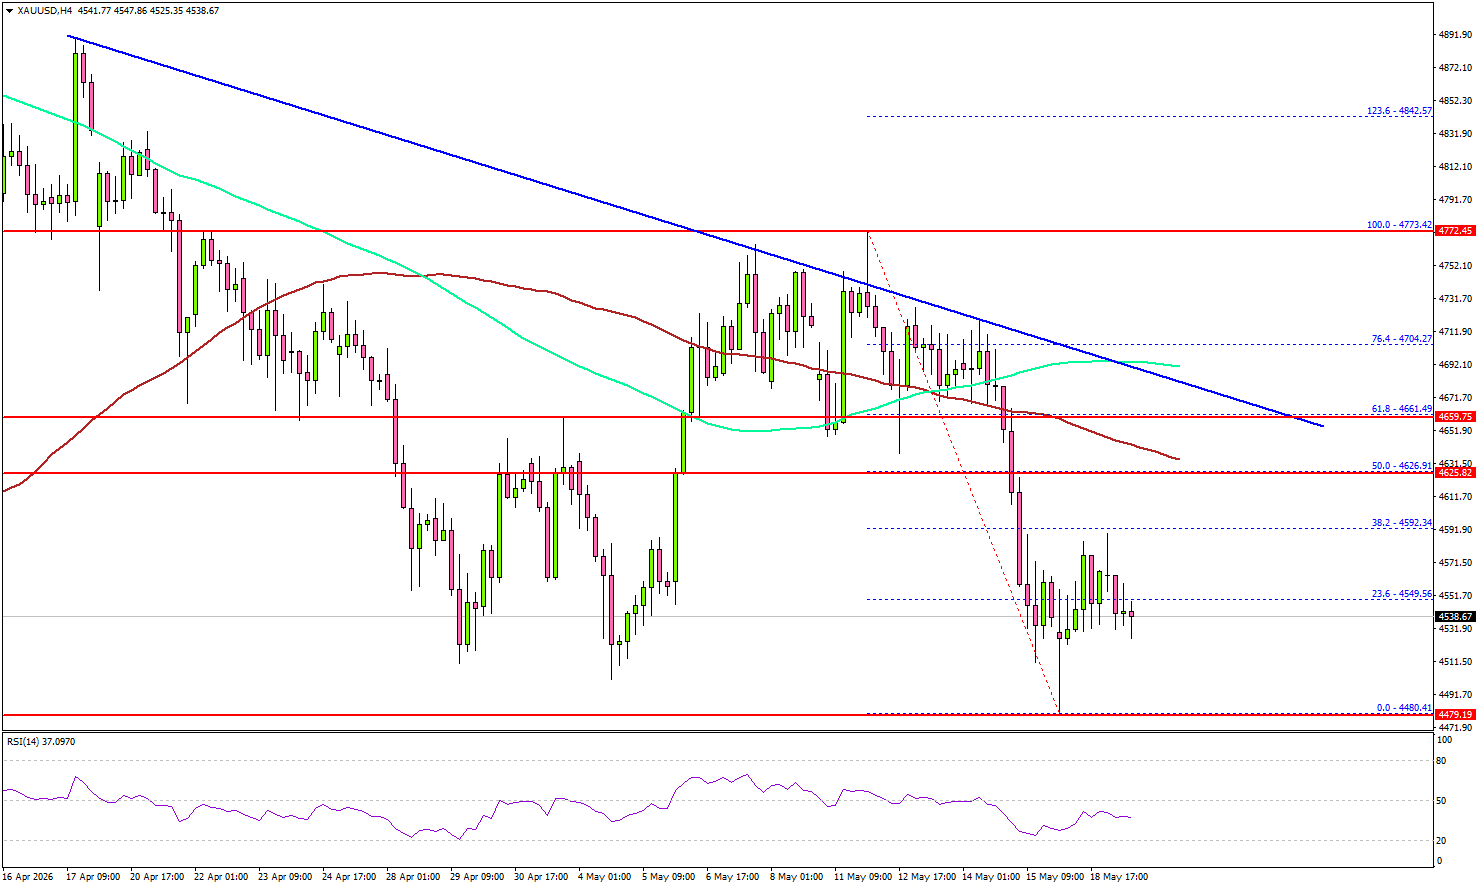
On the upside, immediate resistance is $4,590. The next major resistance sits near $4,625. The main resistance could be near $4,660 and the 61.8% Fib retracement level of the downward move from the $4,773 swing high to the $4,480 low.
There is also a major bearish trend line forming with resistance at $4,660. A clear move above $4,660 could open the doors for more upside. In the stated case, the bulls could aim for a move toward $4,700 or even $4,720.
If there is another decline, Gold might find bids near the $4,480 level. The first major support sits at $4,450. The next support could be $4,400, below which the price might slide to $4,320. The main support sits at $4,200. Any more losses might call for a test of $4,065 or even $4,000 in the coming days.
Looking at WTI Crude Oil, the price regained bullish momentum above $105 and might continue to rise in the short term.
Economic Releases to Watch Today
- FOMC Meeting Minutes.
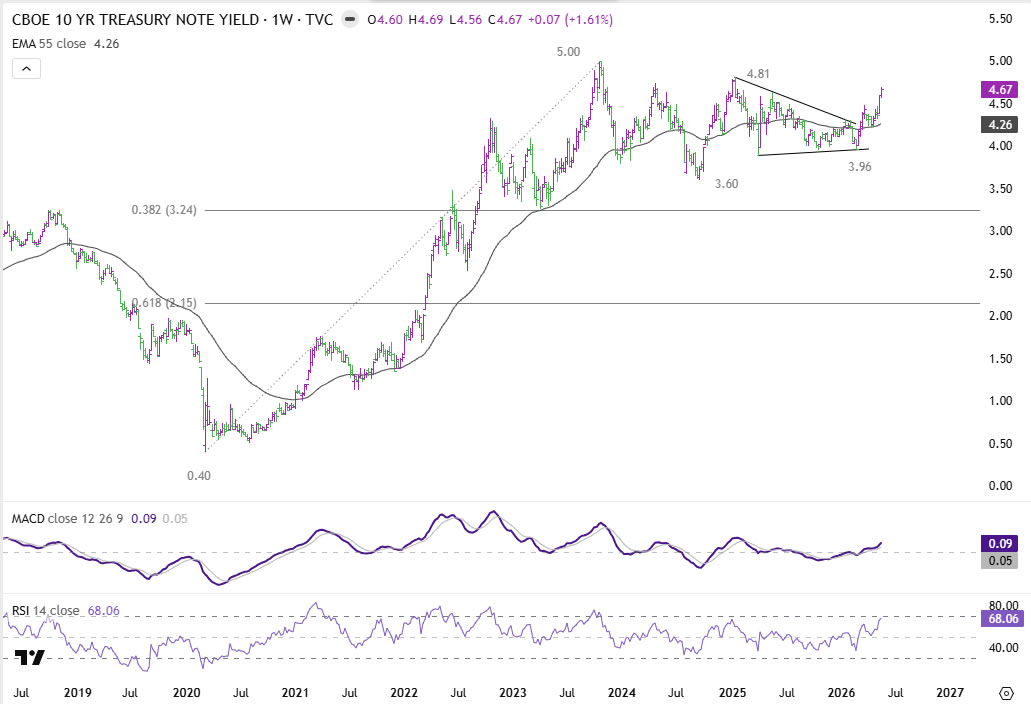
10-Year Yield Eyes 4.75 After Violent Breakout, Opening Risk Toward 5%
This week, US 10-year Treasury yield has surged through its March-April range in a violent breakout that has pushed yields to fresh 52-week highs and their highest levels since early 2025. This is not just another inflation scare. Markets are beginning to reprice the entire higher-for-longer story all over again — and this time, the move is being fueled by geopolitics, oil, and a rapidly shifting acceptance that the Federal Reserve may need to revert to tightening.
The turning point came after President Donald Trump returned from China without securing a breakthrough on Iran. Markets had hoped Beijing might use its leverage to help pressure Tehran into ending the conflict and reopening the Strait of Hormuz. Instead, Trump appeared to leave empty-handed, leaving oil markets firmly convinced the energy shock is not ending anytime soon. Brent crude has remained pinned near $110, keeping inflation fears elevated and destroying confidence that price pressures will cool quickly enough for the Fed to ease policy.
That has cornered the Federal Reserve. Recent CPI and PPI reports already showed inflation remaining stubbornly resilient even before the latest oil surge fully feeds through the economy. Now traders are rapidly capitulating on earlier expectations for rate cuts and instead confronting the possibility that rates may need to stay elevated well into next year — or even rise further. Fed fund futures are now pricing around a 60% probability of another Fed hike before year-end.
The implications are becoming increasingly dangerous for other asset classes. Equities have managed to ignore higher yields for months thanks to AI enthusiasm and resilient earnings. But a risk-free rate approaching 5% changes the valuation equation dramatically. At the same time, soaring Treasury yields are acting like a global vacuum cleaner for capital, sucking money back into Dollar assets and placing enormous strain on emerging market currencies and global liquidity conditions. The Indian Rupee’s collapse to record lows is looking less like an isolated event and more like an early warning sign.
Technically, the next key focus for 10-year yield is 100% projection of 3.96 to 4.48 from 4.23 at 4.75. That level now represents a major near-term line in the sand.
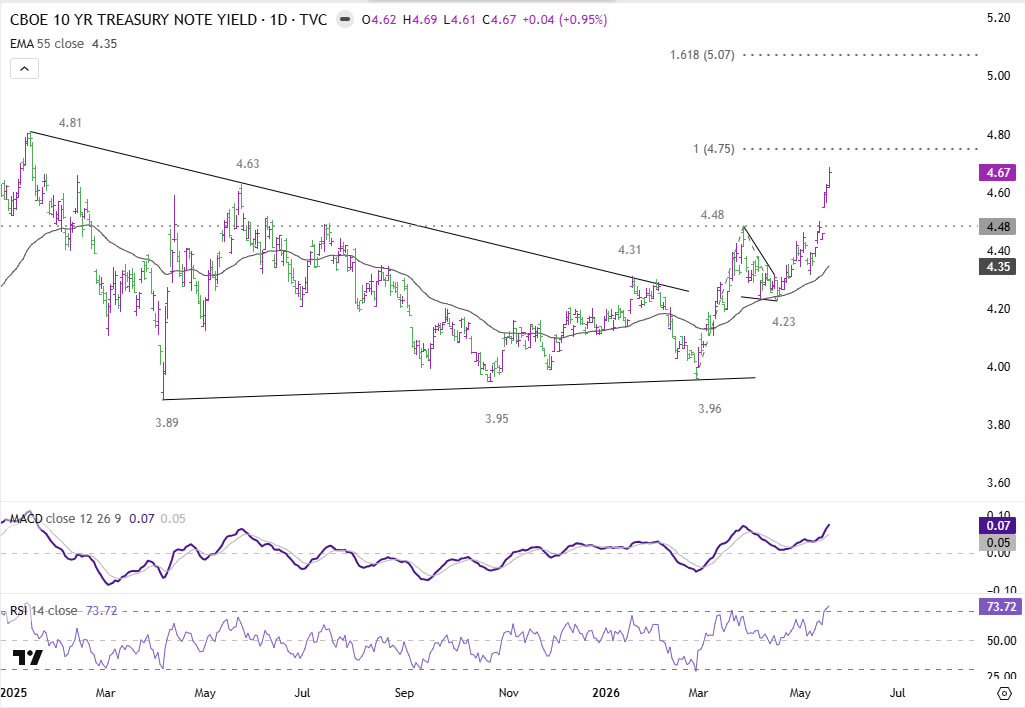
Decisive break above 4.75 could quickly accelerate the move toward 161.8% projection at 5.07, a level dangerously close to the multi-decade highs seen in 2023 and one that could significantly intensify pressure across equities, currencies, and global financial conditions more broadly.
For now, near-term bias remains firmly to the upside as long as 4.48 resistance-turned-support continues holding on any pullback.
China’s PBoC Holds Key Lending Rates Steady as Policymakers Avoid Rush to Ease
The People’s Bank of China left its benchmark lending rates unchanged in May, extending its policy pause to a full year as authorities signaled little urgency to deliver additional monetary easing despite slowing domestic momentum. The 1-year loan prime rate was held at 3.00%, while the 5-year LPR, widely used as a reference for mortgage pricing, remained at 3.50%, matching market expectations.
The decision highlights Beijing’s cautious approach toward broad-based stimulus. Although recent Chinese data have shown renewed weakness in consumption, investment, and lending demand, policymakers appear comfortable maintaining current settings for now. Interbank liquidity conditions remain ample, while the tone of the PBoC’s latest quarterly report suggested officials are still prioritizing financial stability and measured policy support over aggressive easing.
The cautious stance also reflects the increasingly difficult external environment. Rising global energy prices and ongoing geopolitical tensions are complicating policy decisions across Asia, while rate cuts could add pressure on the Yuan at a time when Dollar strength and higher US yields are already tightening global financial conditions.
Fed’s Paulson Says It’s “Healthy” for Markets to Consider Further Tightening
Philadelphia Fed President Anna Paulson signaled support for keeping interest rates steady while also validating market expectations that rates could remain elevated for much longer than previously anticipated.
Speaking on Tuesday, Paulson also welcomed the recent shift in market pricing away from aggressive rate-cut expectations. “The way the market has moved in reaction to economic news over the last few months largely aligns with my own thinking,” she said. While emphasizing that policy was currently “in a good place,” Paulson added it was “healthy” for investors to consider scenarios where rates remain unchanged for an extended period, “as well as scenarios where further tightening becomes necessary.”
Still, Paulson did not suggest the Fed was preparing to hike imminently, noting that longer-term inflation expectations remain relatively well anchored and growth continues near potential. Markets continue expecting the Fed to keep rates unchanged at the June meeting, though officials increasingly appear comfortable allowing investors to price a much more restrictive policy path than markets expected earlier this year.
Metals Suffer from Their Upside Fake-Out: Silver (XAG/USD) and Gold (XAU/USD) Outlook
- Silver, Gold, and other metals completely faked out to the upside in the past week and are now suffering from their weak tops.
- Long yields are exploding, and this adds further pressure to the non-yielding precious commodities.
- Intraday timeframe analysis for XAG/USD and XAU/USD.
Precious metals surged higher last week, only to quickly reverse and drop due to weak price levels. It looked like metals were gaining control, with strong rallies reaching new two-month highs. But this momentum turned out to be a classic bull trap.
The main reason for this big reversal is the fast rise of the Warsh trade. After Kevin Warsh was confirmed as the next Federal Reserve Chairman, markets quickly adjusted for a major tightening of monetary policy. This change led to a strong, lasting increase in the US Dollar and a sharp drop in bond prices.
As a result, long-term Treasury yields are rising quickly. This big jump in yields makes interest-bearing assets much more appealing to large investors. Because gold and silver do not pay interest, they are under heavy pressure.
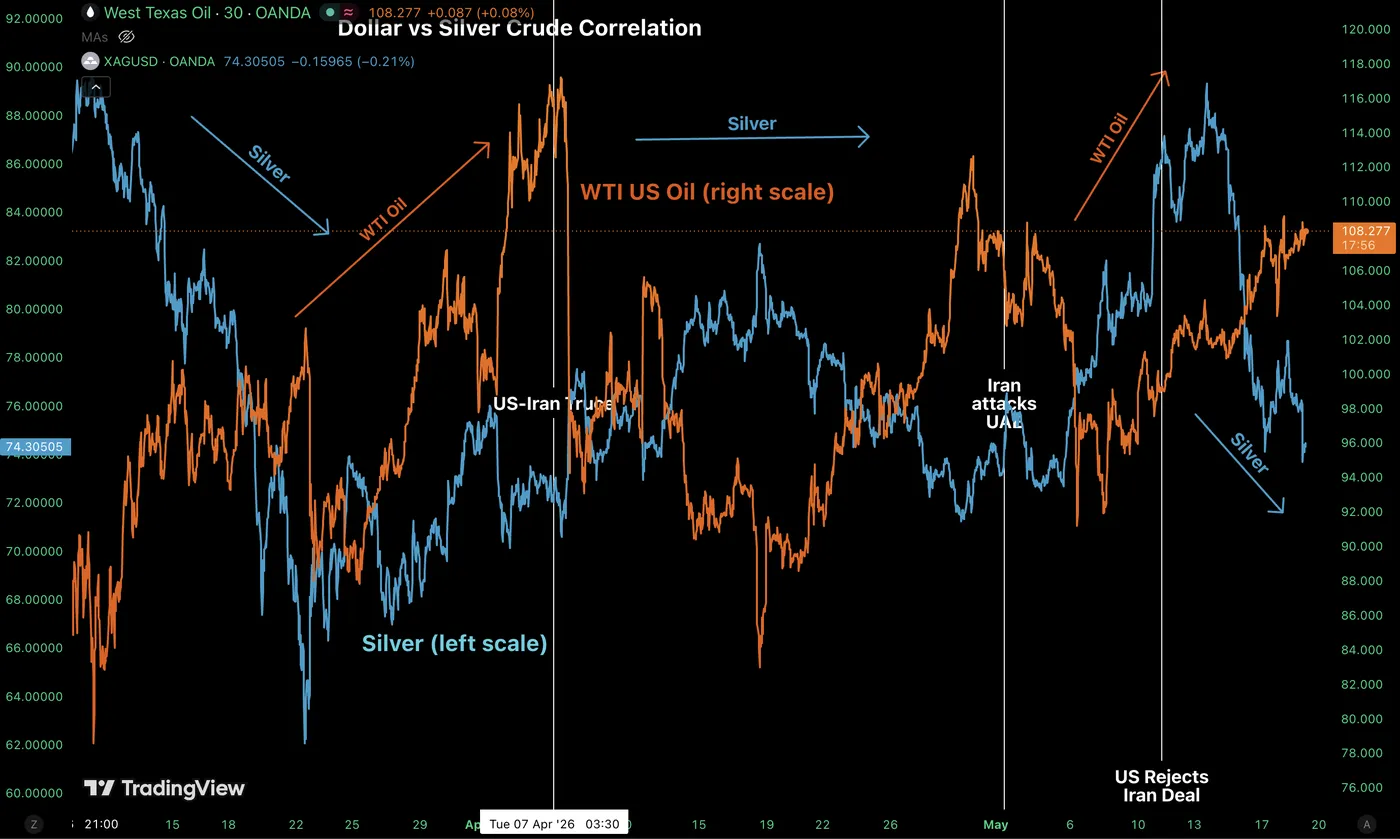
Silver vs WTI crude inverse correlation. Source: TradingView, May 19, 2026.
Why hold a zero-yield metal when government paper is offering increasingly rising risk-free returns?
Looking ahead, if the Middle Eastern geopolitical landscape remains frustratingly cloudy and deadlocked, Gold may still see occasional safe-haven demand to cushion its downside.
However, higher-beta, industrial-leaning alternatives like Copper and Silver may continue struggling under the sheer weight of a surging US Dollar and restrictive financial conditions. Crucial, trend-defining price action is rapidly approaching for the entire asset class.
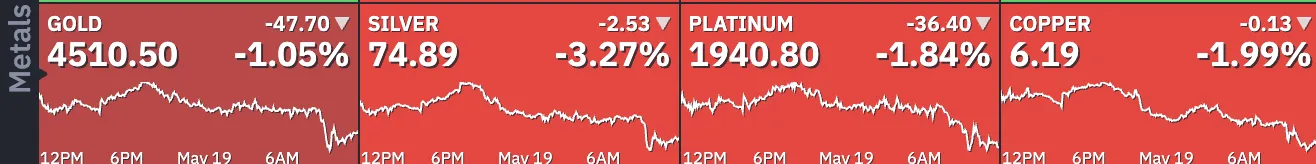
Daily market performance, May 19, 2026. Source: Finviz.
Let's explore the recent shifts in an intraday timeframe analysis of Gold (XAU/USD) and Silver (XAG/USD) to identify the key levels to watch for the action ahead.
Gold (XAU/USD) 4H Chart and Levels
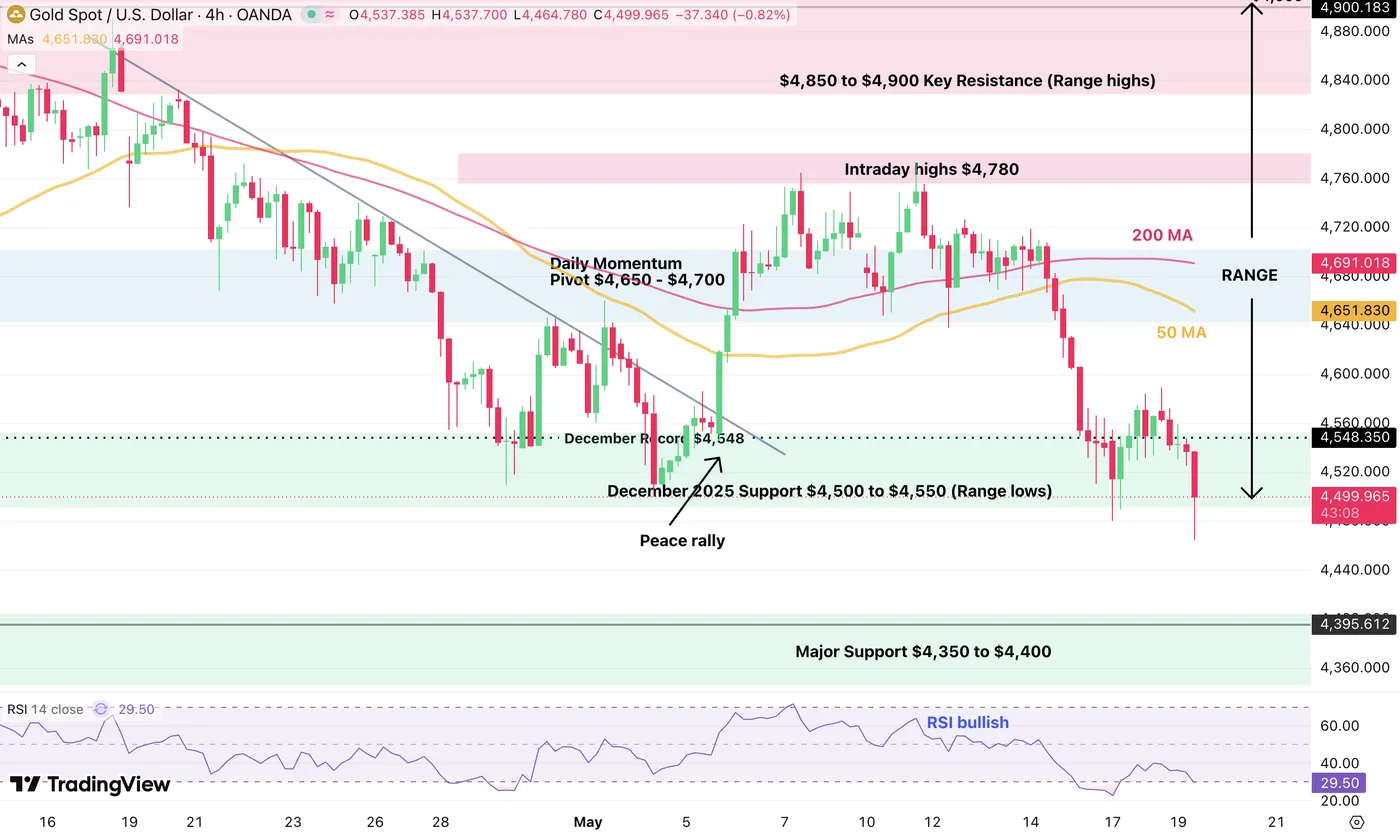
Gold is rejecting its resistance and now struggling at the $4,500 support. With the descending RSI, the odds are towards a support break.
Any break back above $4,600 on momentum would undo the bearish outlook.
Intraday timeframe levels to watch for Gold (XAU/USD):
Resistance Levels:
- Daily momentum pivot: $4,650 to $4,700
- $4,850 to $4,900 major resistance, bullish above
- $5,100 pivotal resistance
- $5,400 mini-resistance
Support Levels:
- December 2025 support: $4,500 to $4,550, testing and bearish below
- Pivotal support: $4,325 to $4,400
- Main channel lows support: $4,100
- Next support: $3,880 to $4,000
Silver (XAG/USD) 4H Chart and Levels
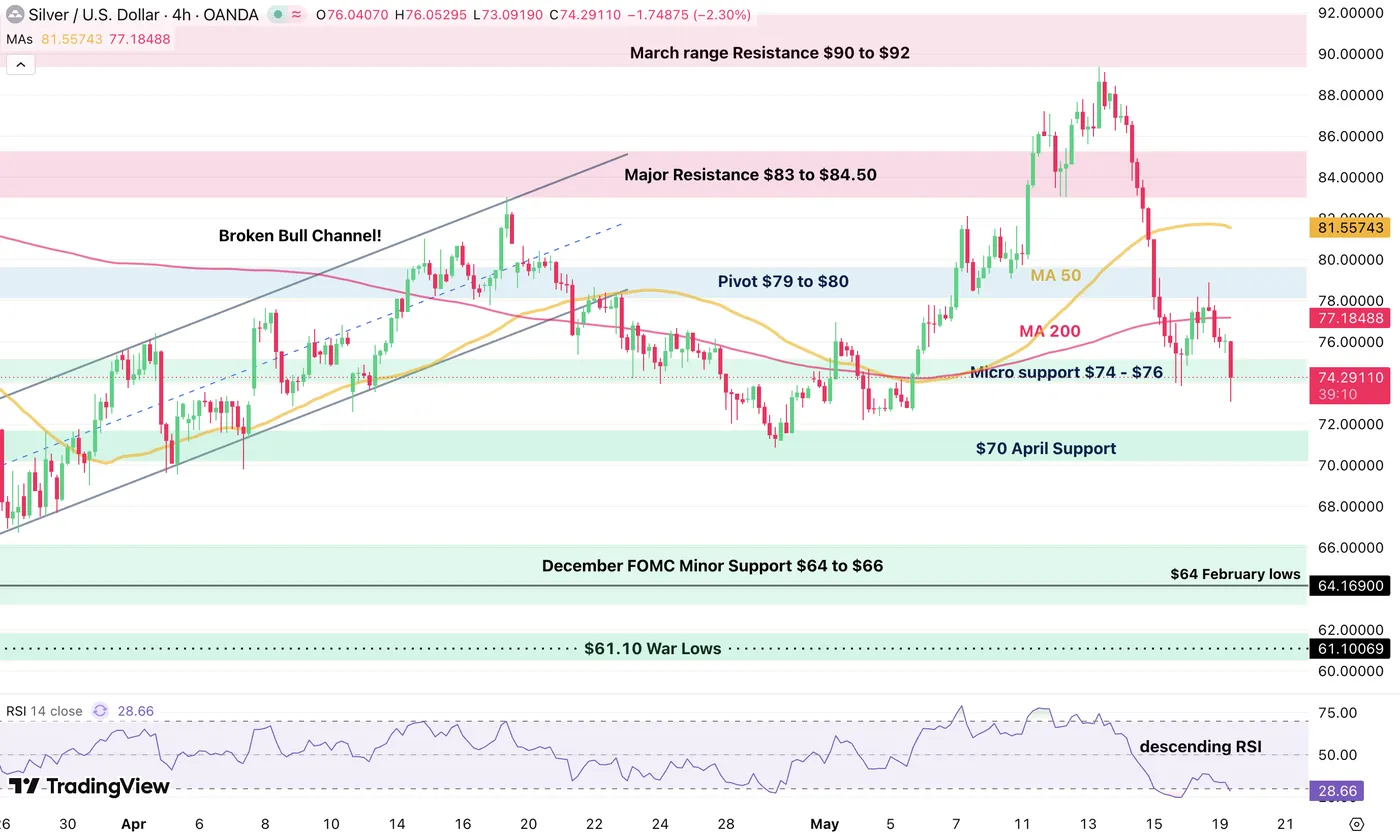
Source: TradingView, May 19, 2026.
Silver completely erased its past week's progress and is back right within its longer-run $70 to $84 range.
Buyers are weakly stepping in at the $74 support, but with the descending RSI and weak candles, odds for a break lower are high.
Higher timeframe levels to watch for Silver (XAG/USD):
Resistance Levels:
- Pivot: $79 to $80
- Major resistance: $83 to $84.50
- Key range resistance: $90 to $92
- $96.47 March highs, higher odds of all-time highs if break above
- Current record: $121.67
Support Levels:
- Micro support: $74 to $76
- $70 to $71.50 April support, bearish below
- December FOMC minor support: $64 to $66
- $61.10 past session lows
- $50 to $55 October resistance now major support
- Silver's 2011 all-time highs: $49.81
Safe trades.