Sample Category Title
Sunset Market Commentary
Markets
The protracted sell-off in (especially ultra-long) bonds since the start of the US-Iran war took a breather today. Two ‘anecdotical topics’ maybe helped to at least temporarily ease pressure. A Japanese 20-y government bond auction received above average investor interest. It’s much too early to draw any conclusion whether LT Japanese bonds have found some kind of acceptable equilibrium. Even so, it muted one of the canaries in the bond coalmine. The Japanese 20-y yield eased 4.5 bps (to 3.72%). The 30-y ceded 6.7 bps (to a still lofty 4.1%). Next to Japan, UK bond markets often also worked as a barometer on inflationary, and even more fiscal related market stress. Here, April UK inflation data also brought some ‘comforting news’. Headline (0.7% M/M; 2.8% Y/Y from 3.3%), core (2.5% Y/Y from 3.1%) and even more services inflation (3.2% from 4.5%) all printed well below market expectations. Headline inflation even dropped to the lowest level since March 2025. The declined was for an important part due to favourable bases effects and measures to mitigate consumers’ utility bills easing the Y/Y figure for housing and consumer related services. Goods CPI rose from 2.1% Y/Y to 2.4%. The April CPI improvement is expected to be reversed later due upward price pressure in commodities and other goods. Even so, the better than expected starting point brought some relieve to the UK bond market too. Markets see it as providing the BOE additional time to finetune its reaction. UK yields are easing between 10 bps (2-y) and 8 bps (30-y). Markets further reduced the probability of a BoE rate hike in June and end July to about 15% and 65% respectively. Interestingly, the UK government today also announced to delay a planned hike in motor fuel duty that was to start in September. This kind of inflation relief evidently comes with a fiscal cost. At the time of writing this report BoE governor Bailey and other MPC members testify before a Parliament Treasury Committee. First comments indeed suggest that the BoE will take time to assess further developments as removal of rate cut expectations tightened financial conditions.
On broader markets some calm also returned after the ‘risk- repositioning’ of the previous days. This at least wasn’t support by any news on the US and Iran coming closer to an agreement. Iran today reacted to threats from President Trump on a new strike with a warning that it might retaliate beyond the Middle East. Despite this ongoing deadlock, the Brent oil price eased slightly (Brent $108 p/b). Evidently, this doesn’t change the broader picture on inflation. Still, US yields ease 1-2 bps across the curve. Bunds even sightly outperform with yields declining from 5 bps (5-10 y) to 3.5 bps (30-y). Still, these moves are ‘insignificant’ in the wake of recent repositioning. On FX markets, the dollar holds recent gains with DXY testing the 99.35 resistance and EUR/USD slipping below the 1.16 big figure. USD/JPY stays locked near 159 despite more MoF warnings on potential JPY interventions. Sterling also reacts constructive to the lower than expected inflation and lower yields. EUR/GBP is losing a few ticks near EUR/GBP 0.8655. Equities also enjoy some relief going into the Nvidia earnings later today (Nasdaq +0.5%, Eurostoxx 50 +0.8%)
News & Views
Belgian consumer confidence continued to weaken in May. The headline index slipped from -9 to -10, the lowest level since April 2025, and extending the decline to 4 consecutive months coming from a 4-yr high at 4 in January. The long term average (2006-2025) is running around -7. The May decline was mainly due to less optimistic expectations concerning unemployment (14 from 6). Compared to March (-45) and April (-43), consumers turned less pessimistic about the general economic situation in Belgium (-37). Households expect a slight improvement in their own financial situation (-4 from -5) but have once again revised downwards their savings intentions (14 from 18; lowest since early 2024) for the coming twelve months.
Bank Indonesia lifted its policy rate by more than expected The first hike since 2022 raised the key rate from 4.75% to 5.25%. This compares to a post-Covid peak rate of 6.25%. Governor Warjiyo called the decision a follow-up step to strengthen the stabilization of the rupiah (after some $10bn of interventions earlier this year) against the impact of heightened global volatility stemming from the Middle East conflict, as well as a preemptive step to ensure inflation in 2026 and 2027 remains within the target range of 1.5%-3.5%. Continued FX interventions and the supervision of banks and corporations with high dollar-purchasing activities are also part of BI’s toolbox. In today’s hawkish shift, BI prioritizes stability and external resilience over economic growth, although it still expects GDP to be within the earlier 4.9%-5.7% projection for this year. INR recovered from an all-time low against the dollar at 17748 to currently 17650. USD/INR changed hands at 16750 before the start of the Middle East conflict.
Sentiment Stabilizes, but Treasury Yields Remain Near Dangerous Zone Ahead of FOMC Minutes
Risk sentiment stabilized somewhat today as Brent crude eased back below $109 and US equity futures pointed to a modest recovery at the open. Still, the broader market mood remains tense as investors continue grappling with elevated global bond yields and persistent uncertainty surrounding the Middle East conflict. While oil prices stepped back temporarily, Treasury yields remained firmly near cycle highs, signaling that underlying financial conditions continue tightening aggressively.
The bond market is increasingly becoming the dominant macro concern. US 10-year Treasury yield recently surged above 4.65%, while the 30-year yield pierced 5.15%, reaching its highest level since 2007. Some market participants warn that if the 10-year yield breaks decisively above 4.75%, markets could enter a deeper structural rotation phase, with capital shifting more aggressively out of equities and into bonds. Near-5% risk-free yields would significantly challenge the valuation support behind recent equity resilience, particularly in growth and AI-related sectors.
There is also growing concern that the bond market itself may begin forcing policy adjustments. A sustained move toward 5% on the 10-year yield could increase pressure on the Federal Reserve to abandon any lingering easing bias and potentially reopen discussions about further tightening if inflation remains sticky. At the same time, elevated yields and persistently high oil prices could intensify pressure on the White House to pursue a diplomatic resolution to the Middle East conflict in order to cool energy markets and ease broader inflation risks.
Meanwhile, attention now turns to the release of FOMC minutes from the April meeting later today. Markets are bracing for a notably hawkish tone following the unusually divided decision to keep rates steady at 3.50%–3.75%. One Fed member, Governor Stephen Miran dissented in favor of a cut. Three influential regional presidents — Neel Kashkari, Lorie Logan, and Beth Hammack — opposed the statement’s easing bias. Investors will closely examine whether concerns about inflation persistence and elevated energy prices were more widespread within the committee than previously understood.
If the minutes confirm that a growing faction inside the Fed is shifting toward a neutral or even hawkish bias, the recent bond rout could extend further. Higher Treasury yields would likely strengthen Dollar further while weighing on equities, Gold, and other non-yielding assets. Nvidia earnings later today also add another layer of importance, particularly given the technology sector’s sensitivity to rising discount rates.
In currency markets, Sterling is currently the strongest performer of the week so far despite softer-than-expected UK CPI data, suggesting markets still expect the Bank of England to maintain a relatively restrictive stance. Kiwi and Dollar also outperformed, while Swiss Franc lagged sharply as rising global yields reduced the attractiveness of low-yielding safe havens. Aussie also remained weak, signaling that broader risk appetite has yet to fully recover despite today’s modest stabilization.
On the trade front, markets received some constructive news after the European Union finalized the legislative text of its long-delayed trade agreement with the United States. The breakthrough reduces the risk of an escalating transatlantic trade conflict after US President Donald Trump had threatened major tariffs if Brussels failed to implement the deal before the July 4 deadline. European Commission President Ursula von der Leyen said the agreement would help ensure “stable, predictable, balanced, and mutually beneficial transatlantic trade.”
Bitcoin Wanted $80K to Be a Launchpad, It Becomes an Exit Door Instead
Bitcoin’s attempt to turn $80K into a new launchpad is fading as Treasury yields surge toward 5% and ETF outflows exceed $1 billion, raising fears that tightening liquidity conditions are starting to hit crypto markets hard. Read More.
10-Year Yield Eyes 4.75 After Violent Breakout, Opening Risk Toward 5%
Treasury yields are no longer rising gradually. The breakout toward 4.75 is increasingly threatening a retest of the 2023 highs near 5%, with growing pressure spreading across stocks, currencies, and global liquidity. Read More.
Eurozone Inflation Accelerates to 3.0% as Energy Costs Push Headline Higher
Eurozone inflation accelerated to 3.0% in April as energy prices continued climbing, though softer core CPI suggested underlying domestic inflation pressures are still gradually easing. Read More.
UK Inflation Slows Sharply to 2.8%, Easing Immediate Pressure on BoE
UK inflation slowed more sharply than expected in April, with core CPI falling to its lowest level since 2021 and services inflation cooling sharply, reducing immediate pressure for another Bank of England rate hike. Read More.
China’s PBoC Holds Key Lending Rates Steady as Policymakers Avoid Rush to Ease
The PBoC held its benchmark lending rates steady as ample liquidity conditions and concerns over Yuan stability reduced pressure for immediate monetary easing. Read More.
AUD/USD Daily Report
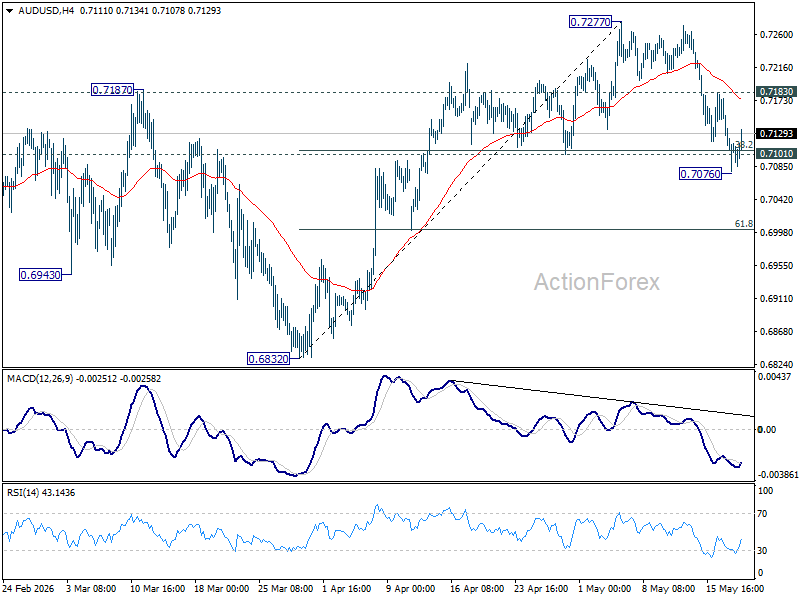
AUD/USD dipped to 0.7076 but quickly recovered. Intraday bias stays neutral first. On the upside, above 0.7183 minor resistance will suggest that pullback from 0.7277 has completed. Intraday bias will be back on the upside for retesting this high. However, decisive break of 0.7076 will bring deeper decline back towards 0.6832 support.
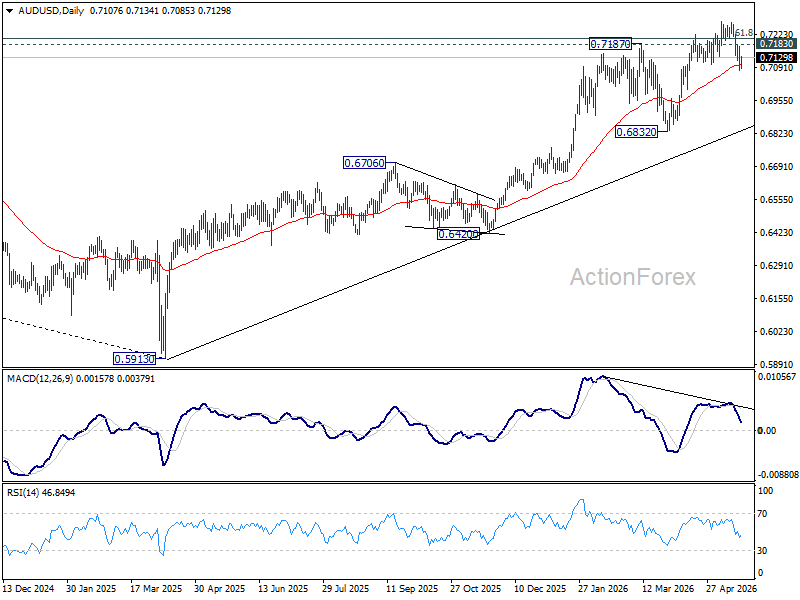
In the bigger picture, rise from 0.5913 (2024 low) is still in progress. Decisive break of 61.8% retracement of 0.8006 to 0.5913 at 0.7206 will solidify the case that it's already reversing the down trend from 0.8006 (2021 high). Further rally should then be seen to retest 0.8006. For now, outlook will remain bullish as long as 0.6832 support holds, in case of pullback.
EUR/USD Daily Outlook
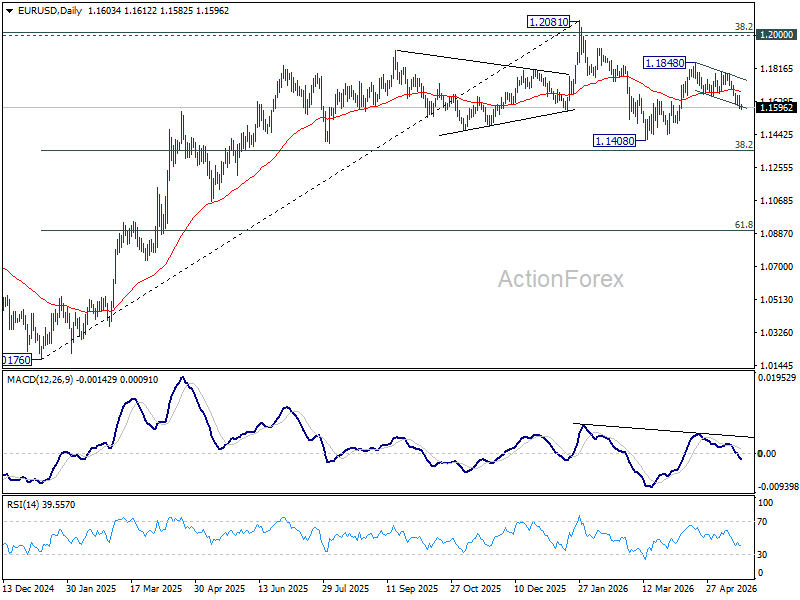
EUR/USD's fall from 1.1848 resumed after brief consolidations. Intraday bias is back on the downside. As noted before, rebound from 1.1408 could have completed as a corrective three-wave move. Deeper fall should be seen to retest 1.1408 low. For now, risk will stay on the downside as long as 55 4H EMA (now at 1.1668) holds.
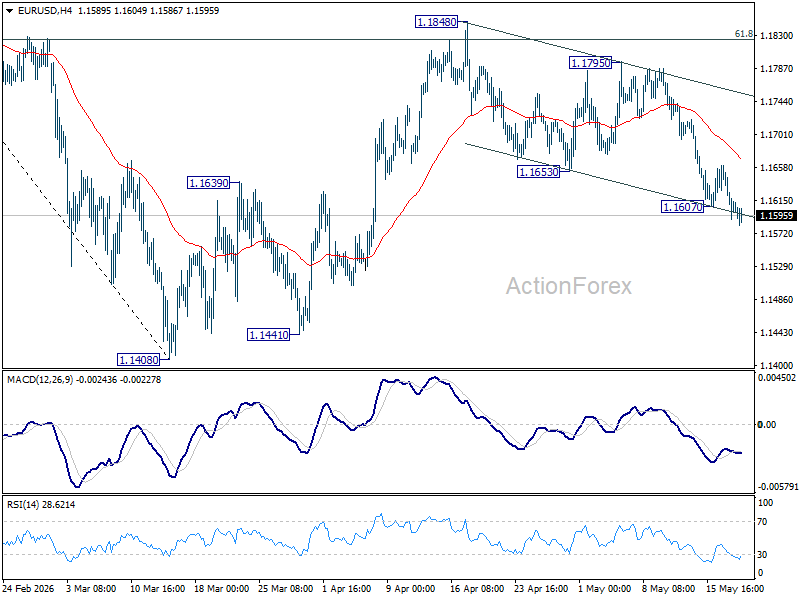
In the bigger picture, the strong support from 38.2% retracement of 1.0176 to 1.2081 at 1.1353 suggests that the pullback from 1.2081 is more likely a corrective move. Strong support was also found in 55 W EMA (now at 1.1542). Focus is back on 1.2 key cluster resistance level. Decisive break there will carry long term bullish implications. Nevertheless, break of 1.1408 support will revive the case of medium term bearish trend reversal.
USD/JPY Daily Outlook
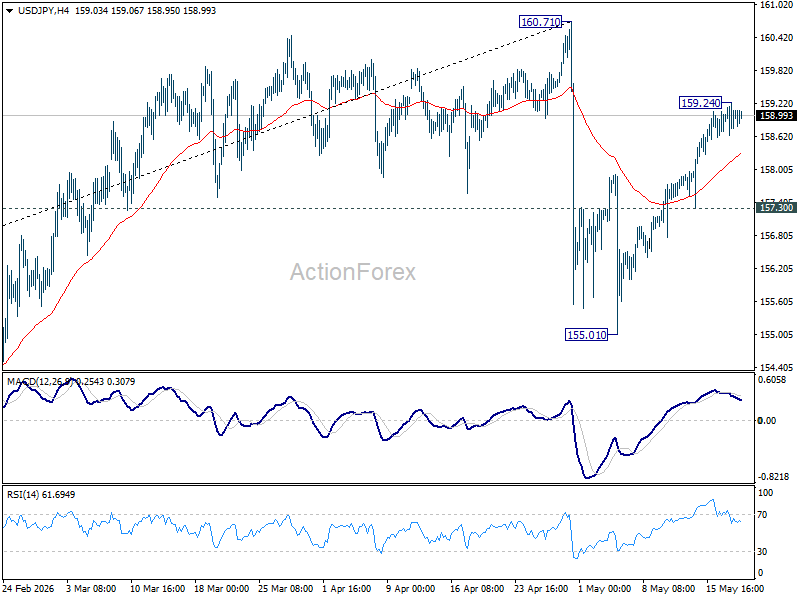
Intraday bias in USD/JPY is turned neutral first with current retreat. Above 159.24 will target 160.71 high. Strong resistance is expected from there to start the third leg of the near term corrective pattern. On the downside, break of 157.30 support will turn bias to the downside for retesting 155.01.
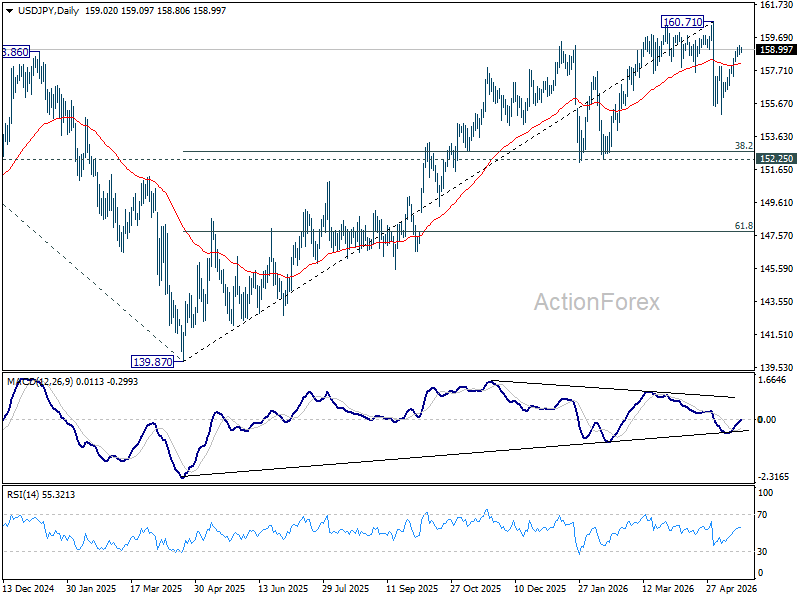
In the bigger picture, for now, corrective pattern from 161.94 (2024 high) is still seen as completed at 139.87. Rise from there is seen as resuming the long term up trend. So, break of 161.94 is expected at a later stage to resume the long term up trend. However, sustained break of 55 W EMA (now at 154.36) will dampen this view and bring deeper fall back towards 139.87 to extend the pattern from 161.94.
GBP/USD Daily Outlook
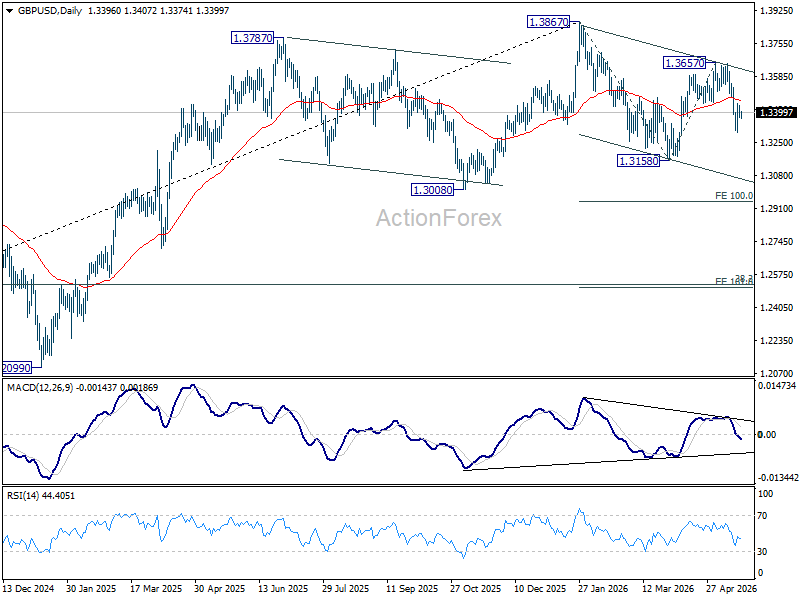
Intraday bias in GBP/USD remains neutral at this point, and some more consolidations could be seen first. Further fall is expected as long as 55 4H EMA (now at 1.3454) holds. Below 1.3300 will target a retest on 1.3158 support first. However, sustained break of the EMA will dampen the bearish case and turn bias back to the upside for 1.3657 resistance instead.
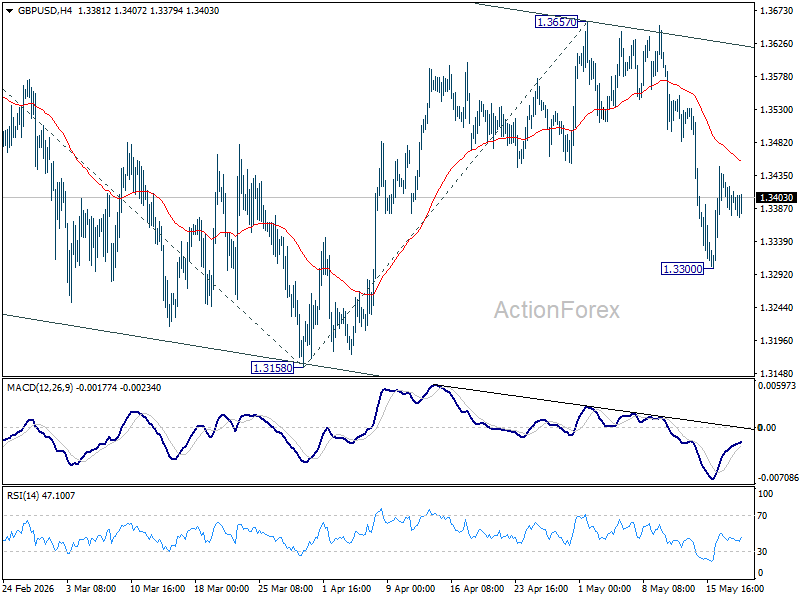
In the bigger picture, current development suggests that price actions from 1.3867 are merely a corrective pattern within the broader up trend from 1.0351 (2022 low). With 1.3008 support intact, medium term bullishness is maintained and break of 1.3867 is in favor for a later stage, towards 1.4248 key resistance (2021 high). However, firm break of 1.3008 will at least bring deeper fall to 38.2% retracement of 1.0351 to 1.3867 at 1.2524, with increased risk of bearish reversal.
USD/CHF Daily Outlook
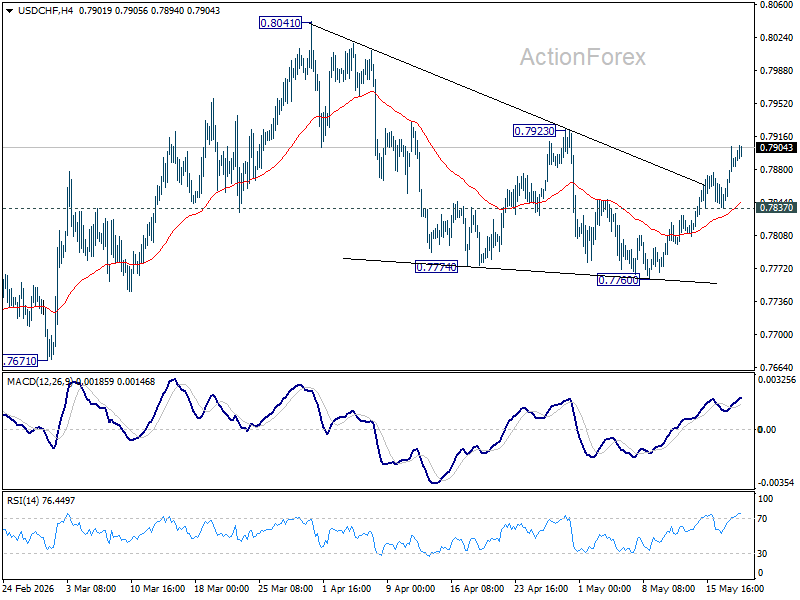
Intraday bias in USD/CHF remains on the upside as rise from 0.7760 is in progress. Firm break of 0.7823 resistance will argue that fall from 0.8041 has completed as a three wave correction, and bring further rise to retest this high. On the downside, below 0.7837 minor support will turn intraday bias neutral again.
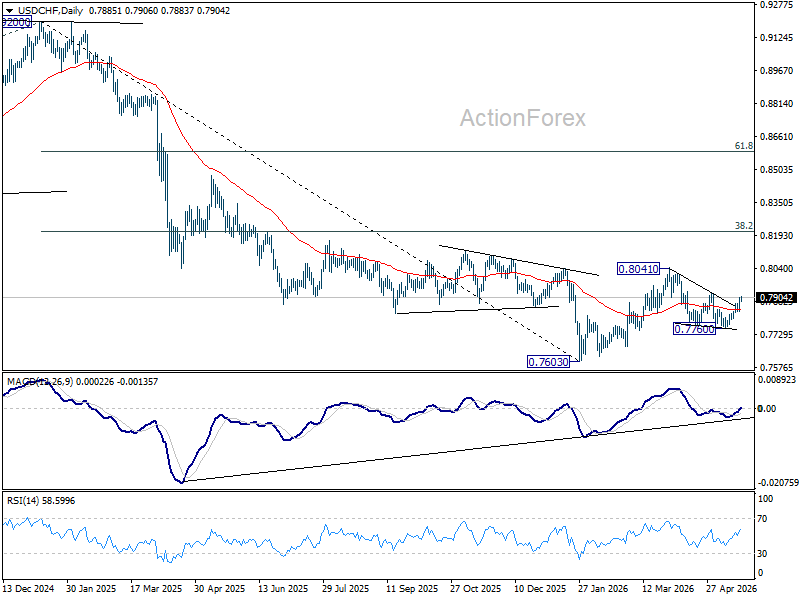
In the bigger picture, as long as 55 W EMA (now at 0.8035) holds, fall from 0.9200 is expected to continue, as part of the larger down trend. Firm break of 0.7603 will target 100% projection of 1.0146 (2022 high) to 0.8332 from 0.9200 at 0.7382.
AUD/USD Daily Report
AUD/USD dipped to 0.7076 but quickly recovered. Intraday bias stays neutral first. On the upside, above 0.7183 minor resistance will suggest that pullback from 0.7277 has completed. Intraday bias will be back on the upside for retesting this high. However, decisive break of 0.7076 will bring deeper decline back towards 0.6832 support.
In the bigger picture, rise from 0.5913 (2024 low) is still in progress. Decisive break of 61.8% retracement of 0.8006 to 0.5913 at 0.7206 will solidify the case that it's already reversing the down trend from 0.8006 (2021 high). Further rally should then be seen to retest 0.8006. For now, outlook will remain bullish as long as 0.6832 support holds, in case of pullback.
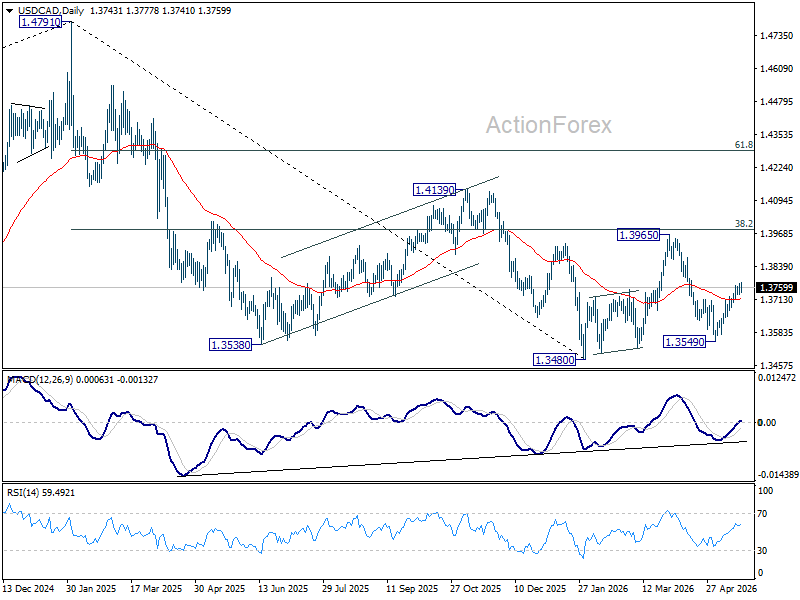
USD/CAD Daily Outlook
No change in USD/CAD's outlook and intraday bias stays mildly on the upside. Rebound from 1.3549 is seen as the third leg of the corrective pattern from 1.3480. Further rise would be seen towards 1.3965 resistance. On the downside, below 1.3729 minor support will turn intraday bias neutral first.
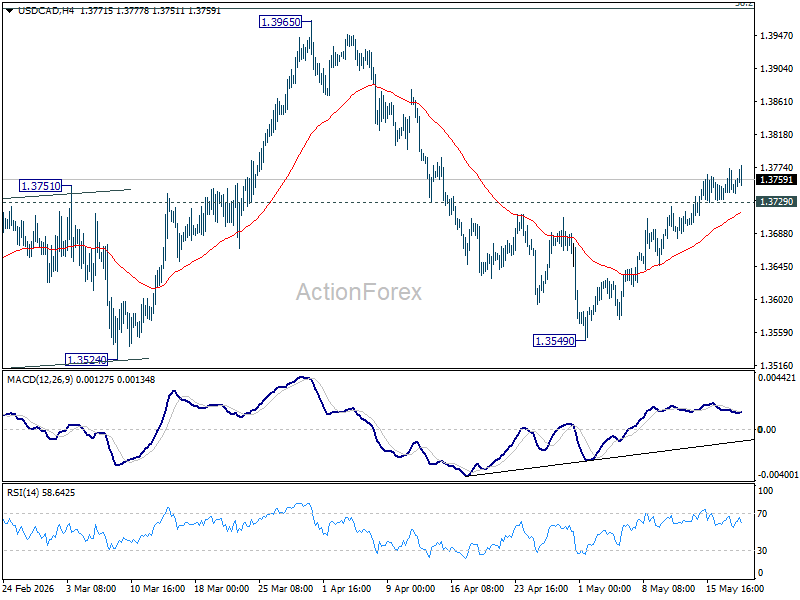
In the bigger picture, price actions from 1.4791 are seen as a corrective pattern to the whole up trend from 1.2005 (2021 low). Deeper fall could be seen, as the pattern extends, to 61.8% retracement of 1.2005 to 1.4791 at 1.3069. However, decisive break of 38.2% retracement of 1.4791 to 1.3480 at 1.3981 will argue that the correction has completed with three waves down to 1.3480 already.
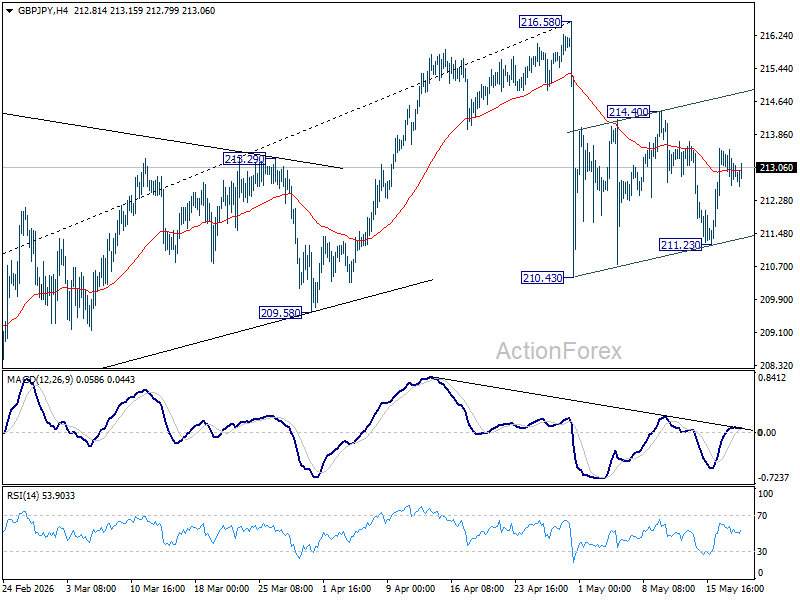
GBP/JPY Daily Outlook
Intraday bias in GBP/JPY remains neutral as range trading continues. Consolidations from 210.43 is extending with another rising leg. On the downside, firm break of 210.43 will resume the corrective fall from 21658. However, sustained break of 214.40 will bring stronger rise back to retest 216.58 high instead.
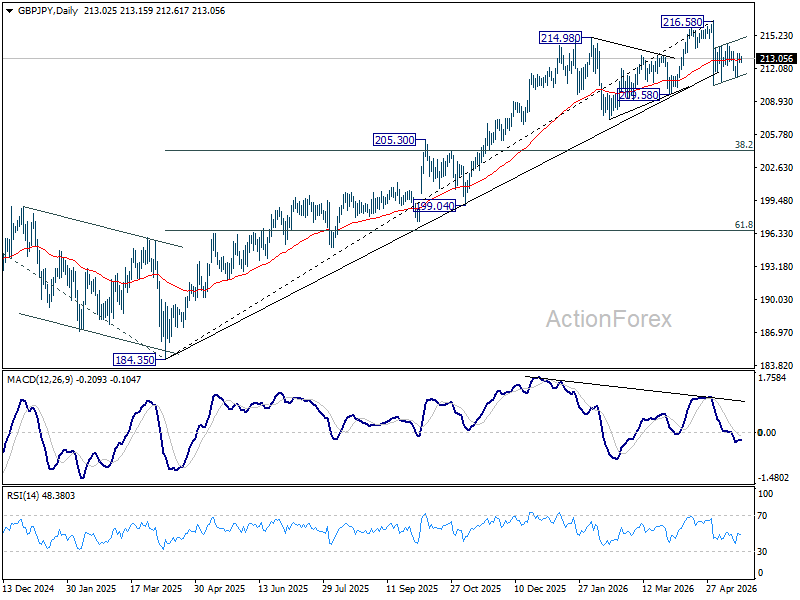
In the bigger picture, while the fall from 216.58 is steep, there is no clear sign of trend reversal yet. The long term up trend could still extend to 61.8% projection of 148.93 (2022 low) to 208.09 (2024 high) from 184.35 at 220.90 on resumption. However, sustained break of 55 W EMA (now at 205.91) will argue that it's already in medium term down trend for 184.35 support.
EUR/JPY Daily Outlook
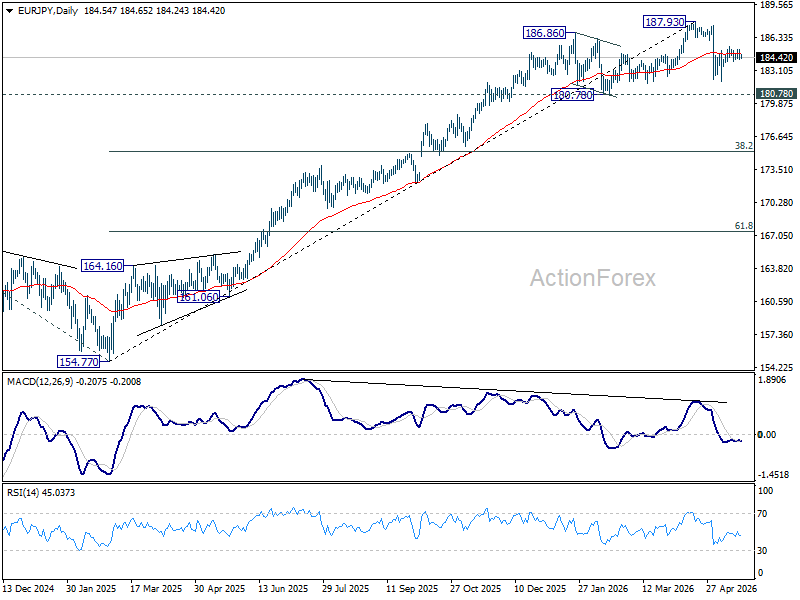
Range trading continues in EUR/JPY and intraday bias remains neutral. . As noted before, pullback from 187.93 could have completed at 182.01 already. Further rise is in favor as long as 184.02 minor support holds. Above 185.44 will target a retest on 187.93 high. Nevertheless, break of 184.02 minor support will turn bias back to the downside towards 182.01 again.
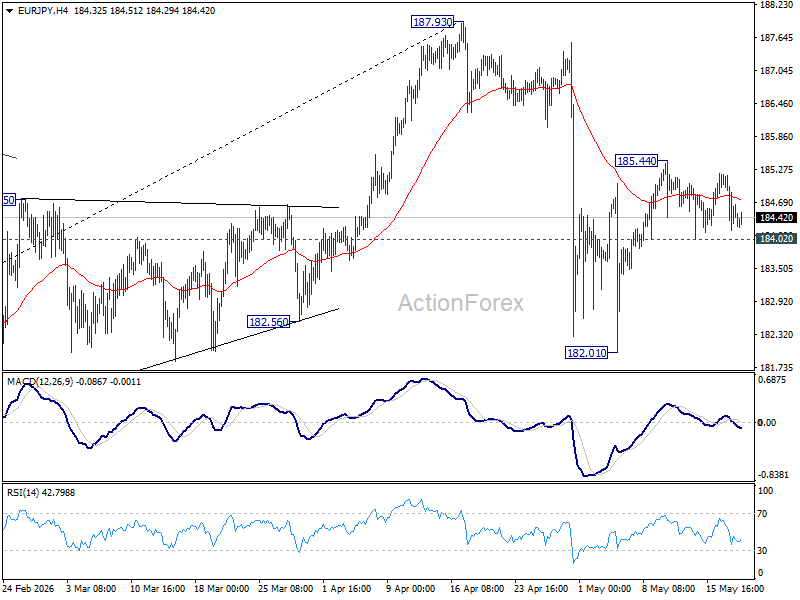
In the bigger picture, the pullback from 187.93 is steep, there is no sign of reversal yet. Uptrend from 114.42 is still expected to resume at a later stage to 78.6% projection of 124.37 (2022 low) to 175.41 (2025 high) from 154.77 at 194.88. However, sustained break of 55 W EMA (now at 178.27) will argue that it's already in a medium term down trend to 175.41 resistance turned support and below.