Sample Category Title
The Warsh Trade and the US Dollar: EUR/USD, GBP/USD and Dollar Index Overview
The US Dollar is back on a strong path higher since last week, already looking to erase some of its April softness.
Kevin Warsh was confirmed as the next Federal Reserve Chairman after a lengthy, unpredictable political process and financial markets are already experiencing significant changes.
The Warsh trade is slowly being priced in, reinforcing the idea of a more austere monetary policy. Ongoing supply chain disruptions caused by conflict and rising oil prices make near-term rate cuts unlikely, signalling a major shift from what investors were awaiting throughout the past year.
At the heart of this market shift is the idea of a smaller Federal Reserve balance sheet, suggesting a level of monetary restraint not seen since before the Great Financial Crisis.
Unlike typical quantitative tightening, this approach may aim to reduce the central bank's balance sheet far more aggressively.
Since Warsh is President Trump's nominee, traders are still unsure if he will pursue such an independent and hawkish policy, but his past views suggest he might.
As a result, investors are anxious to hear Warsh's first public comments, with his swearing-in set for this Friday.
Even before he speaks, expectations of a reduction in liquidity are boosting the US Dollar, which is rising sharply against other currencies.
The dollar's strength reflects how foreign exchange markets are adjusting to wider yield gaps and the prospect of a potentially tighter monetary policy.
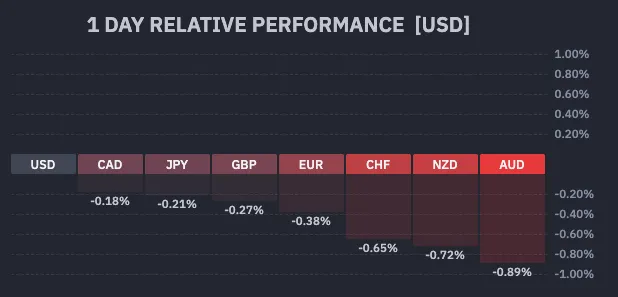
Current session's FX performance. Source: Finviz, May 19, 2026.
We will look at the Dollar Index, EUR/USD, and GBP/USD to spot how the Warsh trade has already impacted the FX market and where to look next.
Dollar Index 4H Chart
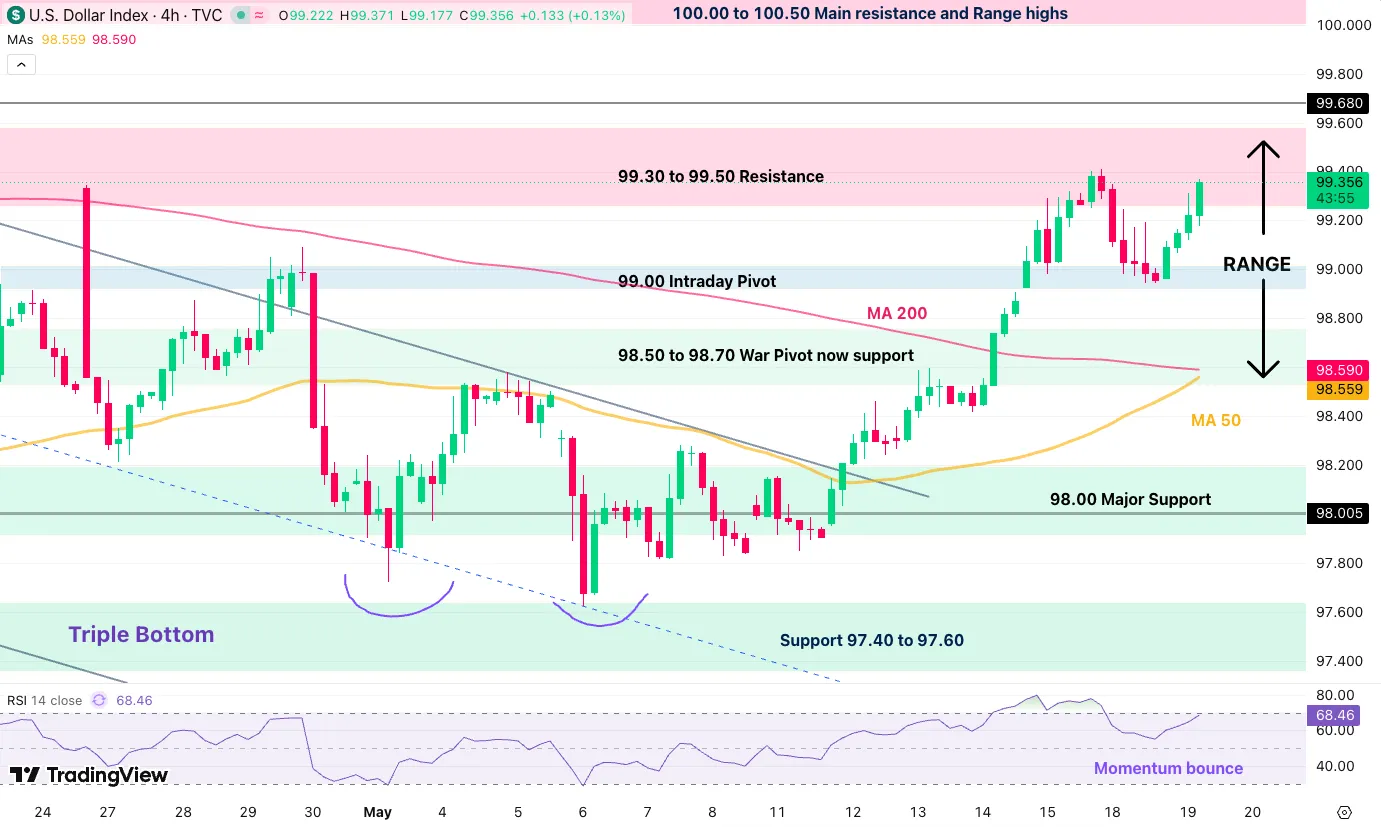
Dollar Index 4H chart. Source: TradingView, May 19, 2026.
The US Dollar bulls are attacking the key 99.50 resistance area, which served as a top to last week's initial explosion.
Current bull candles are showing a strong push that could easily retake the 99.415 top, with the formation of a tight bull channel, also following an upward trendline.
Above 99.50, expect a fast-paced continuation towards 100.00. Below 99.00, however, the price action provides a more rangebound picture, hence immediate reactions and today's close will be essential to watch.
Levels of interest for the Dollar Index:
Resistance Levels
- 99.40 to 99.50 resistance, past week highs 99.415
- Initial war spike 99.68
- 100.00 to 100.50 main resistance zone
- War highs 100.544
Support Levels
- 99.00 intraday pivot
- 98.50 to 98.70 war pivot now support
- Support 97.40 to 97.60, triple bottom
- 2025 lows 96.40 to 96.80 support
- Range lows at early 2022 consolidation just below 96.00
GBP/USD 4H Chart and Technical Levels
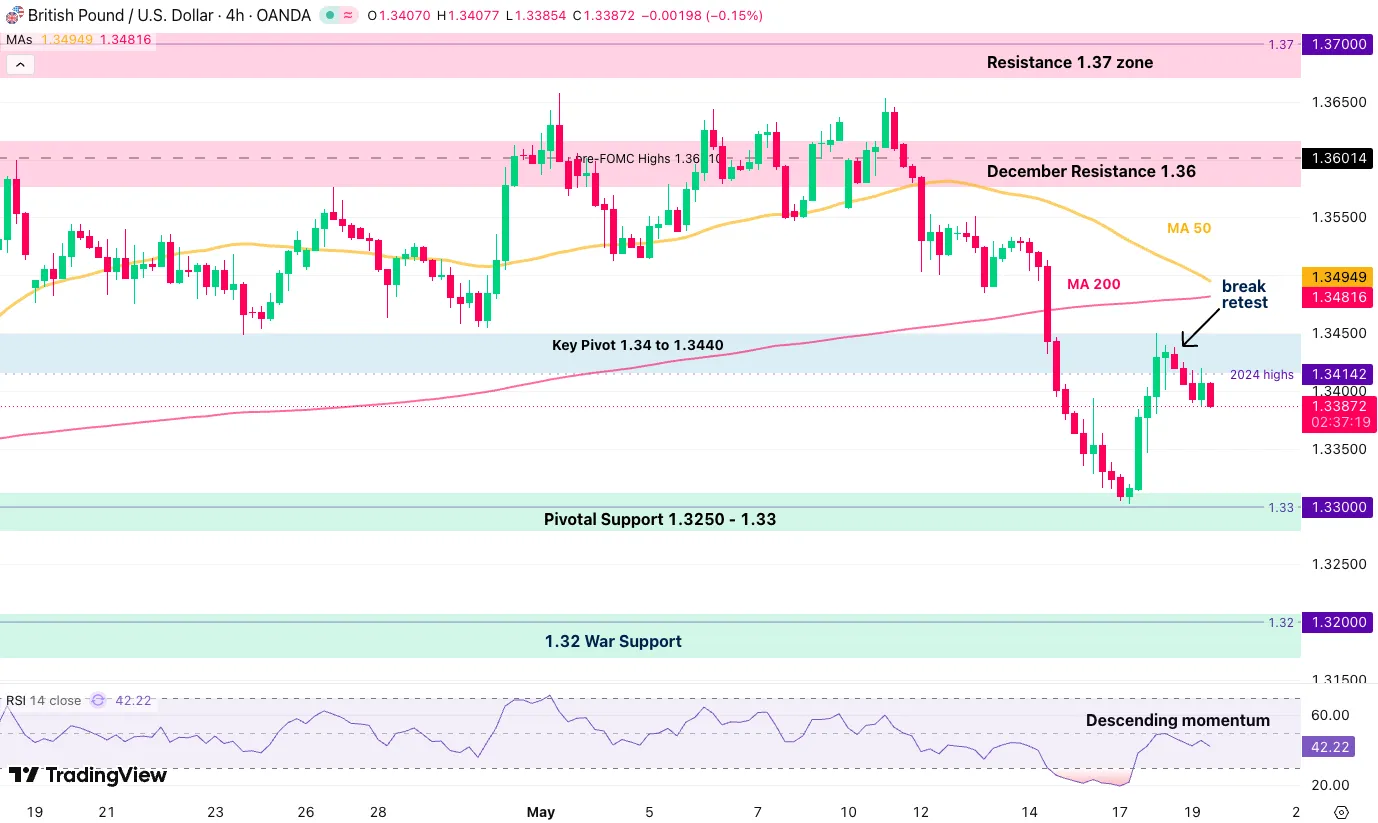
GBP/USD 4H chart. Source: TradingView, May 19, 2026.
Since our last analysis of the major FX pair, the price action completely reversed. Having rejected the 1.36 major resistance on a fakeout, sellers quickly took control of the action.
This weekly open allowed a pullback right at the 1.34 to 1.3450 pivot zone, and the ongoing rejection points to a highly probable retest of the 1.33 level.
A break below would be plausible, with no clear support areas until 1.32 after that, the war lows.
Levels of interest for GBP/USD:
Resistance Levels
- Key pivot 1.34 to 1.3450
- December resistance 1.36, range highs
- Pre-FOMC highs 1.36010
- Resistance 1.37 zone
- 2025 resistance around 1.38
Support Levels
- Pivotal support 1.3280 to 1.33
- 1.32 war support
EUR/USD 4H Chart and Technical Levels
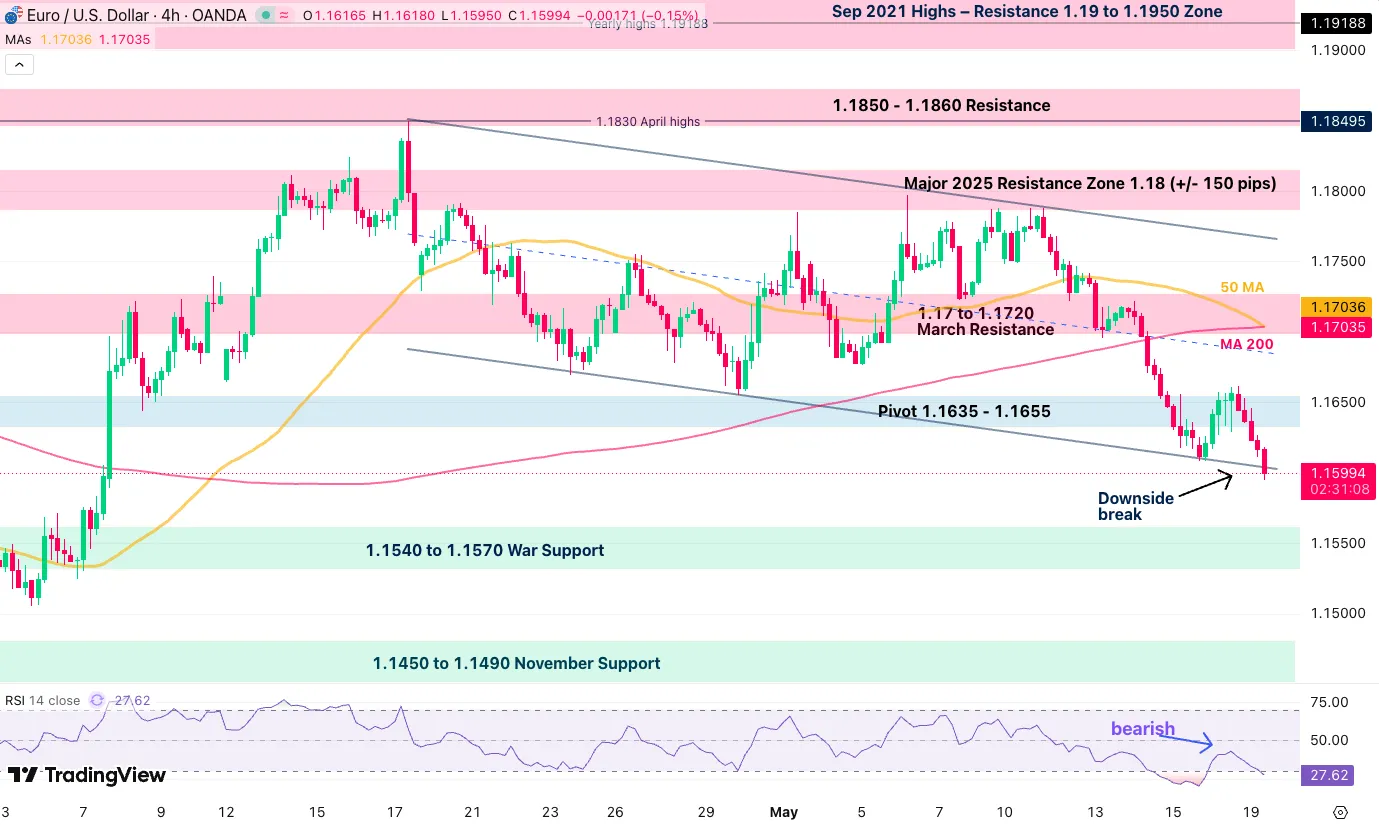
EUR/USD 4H chart. Source: TradingView, May 19, 2026.
EUR/USD has been under heavy pressure since last week, with sellers leading a 2,000-pip move lower in an attempt to break the low-slope descending channel. Add to it a death cross, with the 50-period MA crossing below the 200 MA, and the action is decisively bearish.
While the price action is strong, the pair is reaching some oversold levels, hence an immediate break could be less strong. Watch if the action closes below 1.16 to confirm a downside break.
The next target for bears is the 1.1540 to 1.1570 war support.
Levels to place on your EUR/USD charts:
Resistance Levels
- Pivot 1.1635 to 1.1655
- 1.17 to 1.1720 March resistance
- Resistance zone around 1.18, +/- 150 pips
- 1.1830 June 2025 highs
Support Levels
- 1.1540 to 1.1570 war support
- 1.1475 to 1.15 November support
- War lows 1.1410
Safe trades.
Is the Stock Market Rally Over? Dow Jones, Nasdaq and S&P 500 Intraday Levels
- After their ceaseless rally, semiconductors and Mag 7s are pulling back, imposing a stop in stock market euphoria.
- Feeling the pressure of the spike in yields, the Warsh trade could prove more dangerous for overextended tech-heavy stock markets.
- Exploring technical levels for the Dow Jones, Nasdaq and S&P 500.
Stock markets have surged since the peak of the US-Iran conflict, but this strong trend is finally starting to slow down. After weeks of pushing the market higher, semiconductor giants and the Magnificent 7 are now pulling back, putting a sudden stop to the recent Wall Street excitement.
Geopolitical tensions are still unresolved, and the market's optimism is fading. Even though yesterday saw a big relief rally after news broke that planned US military attacks on Iran were halted, investors could not keep up the positive momentum today.
The lack of immediate conflict is no longer enough to hide changing economic conditions, particularly when it comes to Fed expectations.
Now, stocks are under pressure from a sharp rise in bond yields. The new Warsh trade is especially risky for tech-heavy sectors that have grown too quickly.
With Kevin Warsh confirmed to become the next Federal Reserve Chairman and likely to reduce the central bank's balance sheet, less liquidity is causing investors to rethink the current extreme pricing of high-growth assets. We will learn more on his views this Friday, the date he will be sworn in.
As a result, the strong upward trend that has kept the Nasdaq and S&P 500 rising since early April is now breaking down. But for now, the correction remains quite contained.
With the main drivers of the rally now leading the decline, traders are left wondering if the big peace rally has come to an end.
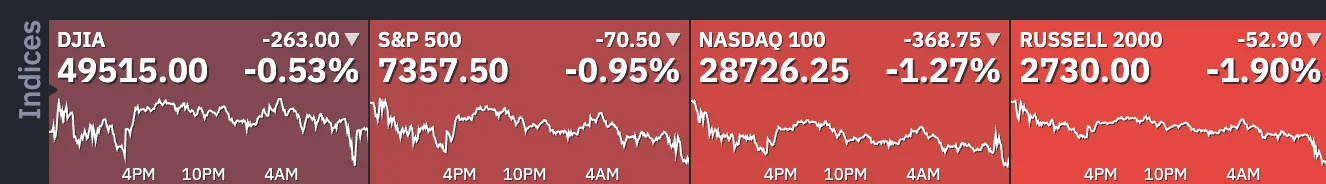
Daily market performance, May 19, 2026. Source: Finviz.
Breaking news: The US President mentioned that he could potentially lean back into attacks on Iran. Make sure to track the latest narrative on the conflict throughout the week.
Let's get ready for potentially rocky action ahead by diving into intraday charts and trading levels for the Dow Jones Industrial Average, Nasdaq Composite, and S&P 500.
Current Session's Stock Heatmap
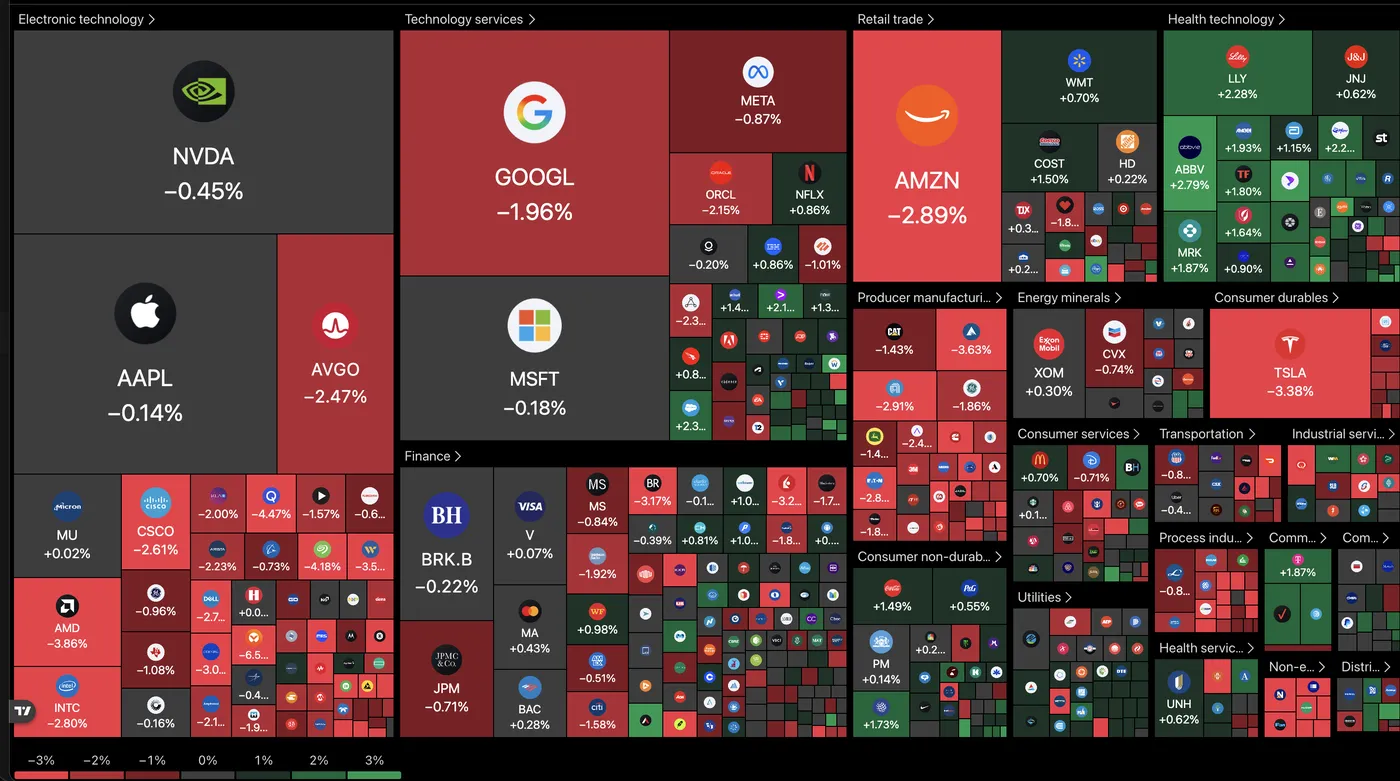
Current picture for the stock market, 11:05. Source: TradingView, May 19, 2026.
As you can see, the stock market split continues, with ongoing rebalancing and profit-taking from semiconductors, tech, and Magnificent 7s, leading the pullback in Nasdaq and S&P 500, while healthcare remains the most bid sector, helping the DJIA to resist the selloff with more tenacity than its peers.
Dow Jones 2H Chart and Trading Levels
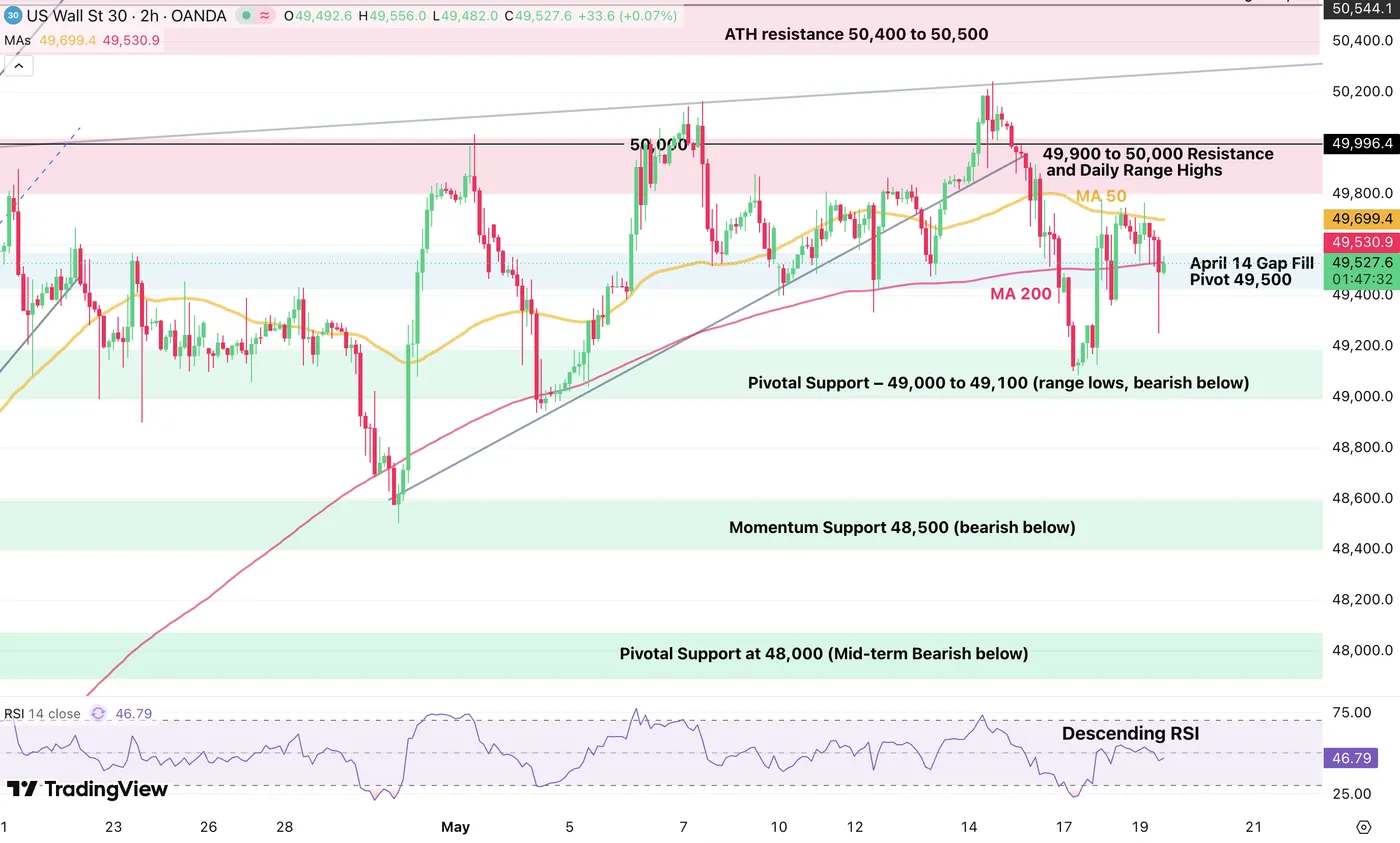
Dow Jones CFD 2H chart. Source: TradingView, May 19, 2026.
After the latest Trump comments, the action in stocks showed a quick wick to the downside, but bulls quickly re-entered to fade the move, before a selling wave made a quick reappearance.
TACO or not, the threat remains a large one for stock markets, particularly traditional sectors. It will be important to keep track of the latest war narratives to see if these are only words or the prelude to something much worse.
Still, the Dow Jones maintains its solid range between 49,000 and 49,900, largely resilient to the outflows seen in other indexes. Keep a close eye on the two range bounds for potential breakouts, with stop orders being a potentially interesting way to enter any buying or selling wave.
Dow Jones technical levels for trading:
Resistance Levels
- 2H 200-MA: 49,500
- 49,900 to 50,000 resistance and early 2026 highs, range top
- ATH resistance: 50,400 to 50,500
- All-time highs: 50,544
Support Levels
- Major pivot: 49,000 to 49,100, range lows
- Momentum support: 48,500
- Pivotal support at 48,000, mid-term bearish below
- Mini support: 47,400 to 47,600
Nasdaq 2H Chart and Trading Levels
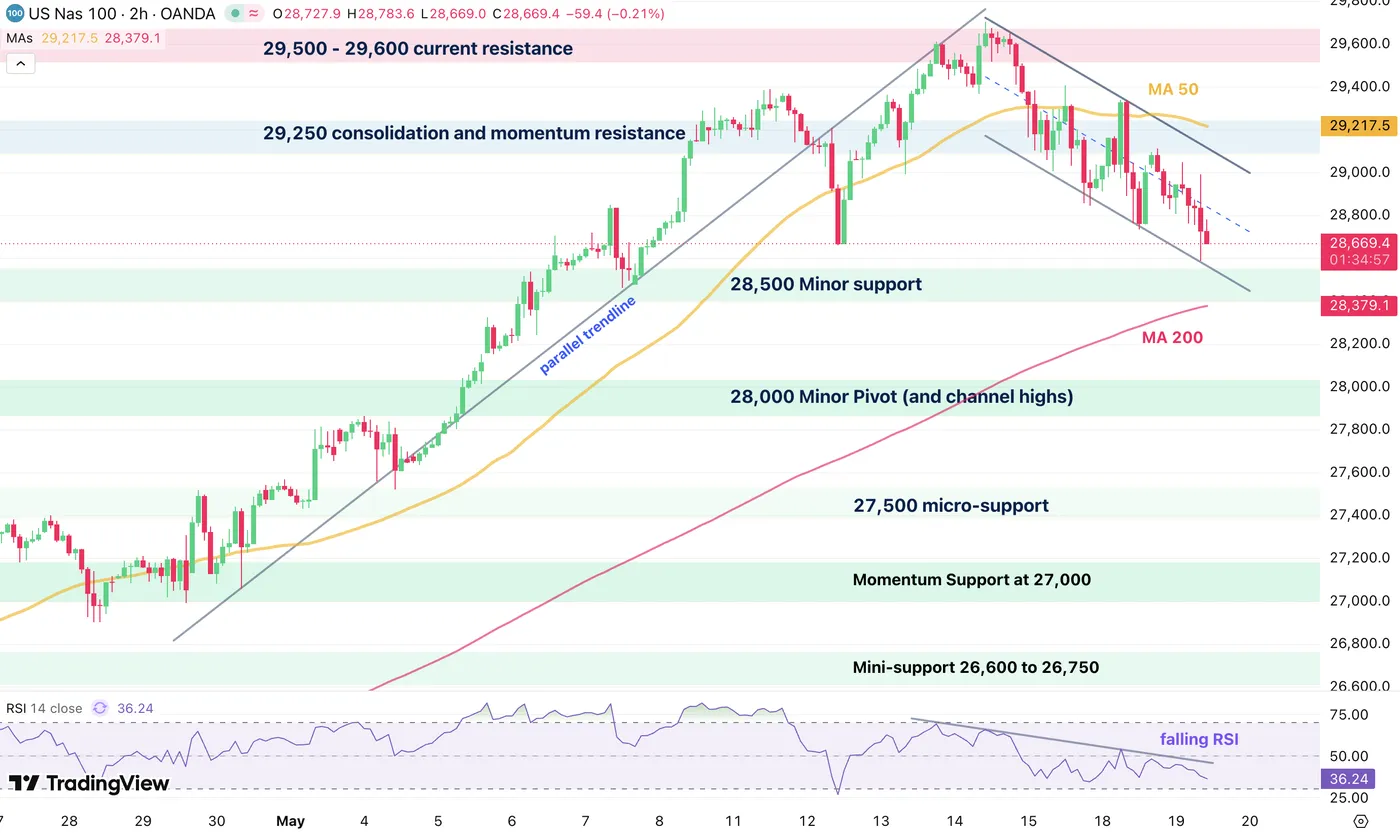
Nasdaq CFD 2H chart. Source: TradingView, May 19, 2026.
Nasdaq is now embarking on a more significant pullback, forming a bear channel in its latest action.
Still, the pullback technically looks healthy for now, so bulls will want to watch reactions at the 28,500 support.
Any break of that support, however, could open the way for a larger correction, around 26,300, the past ATH, particularly if the mood sours until then.
Nasdaq technical levels of interest:
Resistance Levels
- 28,900 mini intraday resistance
- 29,250 consolidation and momentum pivot
- 29,218 2H 50-period MA
- 29,500 to 29,600 current resistance, ATH
Support Levels
- 28,500 minor support
- 28,000 major psychological resistance now pivot, and channel highs
- 27,500 micro-support
- Prior ATH support: 26,200 to 26,300
S&P 500 2H Chart and Trading Levels
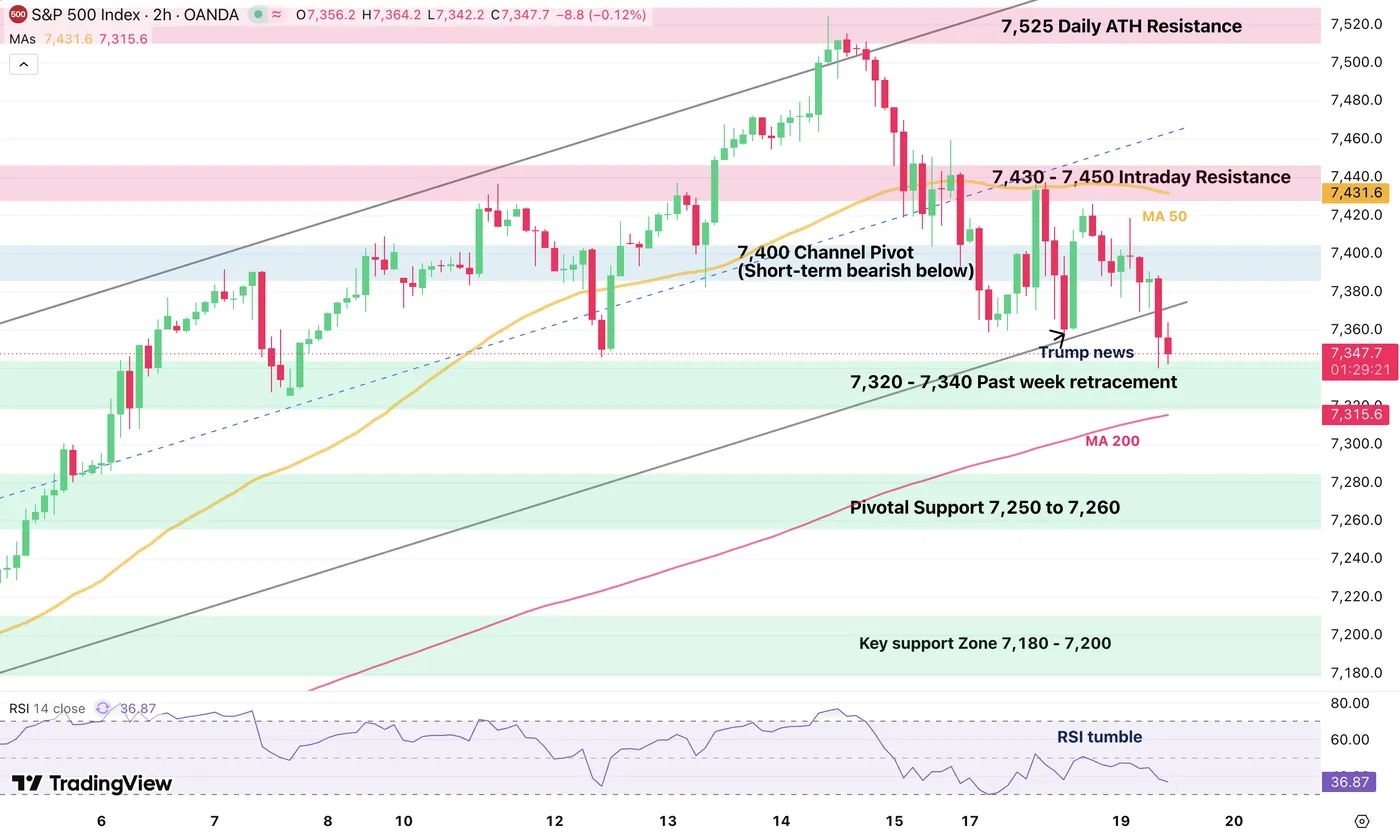
S&P 500 CFD 2H chart. Source: TradingView, May 19, 2026.
After the past week's fake-out above the key bull channel, the S&P 500 is breaking to the downside.
Buyers are stepping in right at the past week's support and attempting a push, but the action still looks quite unsure around current levels.
To get a better idea of where to look next, traders will want to see:
- A bullish impulse and 4H close above 7,380 for the bulls to retake the channel.
- For bears, either a rejection of the support, with a break below 7,320, or a break-retest of the channel, meaning a rejection of 7,370.
S&P 500 technical levels of interest:
Resistance Levels
- 7,400 channel pivot, short-term bearish below
- 7,430 to 7,450 intraday resistance
- 7,525 daily ATH resistance
Support Levels
- 7,320 to 7,340 past week retracement, and channel lows
- Pivotal support: 7,250 to 7,260
- Prior ATH pivot: 7,000 to 7,020
- Minor support: 6,880 to 6,900
- Pivotal support: 6,750 to 6,770
- 6,300 psychological level, war lows
Keep track of WTI crude and the latest headlines throughout the week to stay ahead of the game.
Safe trades.
Dollar Index Probes Again Through Key Barriers after Consolidation
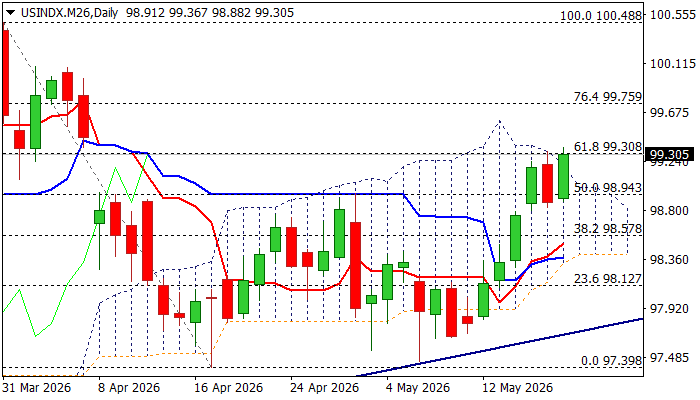
The dollar regained traction on Tuesday, after significant drop previous day and attacks again key barriers at $99.20/30 (Fibo 61.8% of 100.48/$97.40 descend / daily Ichimoku cloud top) where the action was repeatedly capped in past two sessions.
Persisting uncertainty from geopolitical side and recent shift in Fed policy outlook (rising inflation fuels expectations for rate hike in coming months) offer good support to the greenback.
The dollar advanced almost 0.5% until the mid-US session on Tuesday, on track to generate strong bullish signal on close above these barriers, as well as signal of bullish continuation, after a two-day pause.
Next targets lay at $99.75 (Fibo 76.4%) and $100 (psychological), while daily cloud top reverts to immediate support, followed by $98.94 (broken Fibo 50%) and $98.80 (higher base, reinforced by 55DMA).
Formation of bull-crosses of 10/20DMAs over 100/200DMA’s adds to bullish structure, along with strengthening positive momentum, though with slight warning from overbought Stochastic.
Res: 99.75; 100.00; 100.26; 100.48
Sup: 99.20; 98.80; 98.58; 98.35
Eco Data 5/20/26
| GMT | Ccy | Events | Act | Cons | Prev | Rev |
|---|---|---|---|---|---|---|
| 01:15 | CNY | 1-y Loan Prime Rate | 3.00% | 3.00% | 3.00% | |
| 01:15 | CNY | 5-y Loan Prime Rate | 3.50% | 3.50% | 3.50% | |
| 06:00 | EUR | Germany PPI M/M Apr | 1.20% | 1.00% | 2.50% | |
| 06:00 | EUR | Germany PPI Y/Y Apr | 1.70% | 1.50% | -0.20% | |
| 06:00 | GBP | CPI M/M Apr | 0.70% | 0.90% | 0.70% | |
| 06:00 | GBP | CPI Y/Y Apr | 2.80% | 3.00% | 3.30% | |
| 06:00 | GBP | Core CPI Y/Y Apr | 2.50% | 2.70% | 3.10% | |
| 06:00 | GBP | RPI M/M Apr | 0.70% | 1.40% | 0.80% | |
| 06:00 | GBP | RPI Y/Y Apr | 3.00% | 3.70% | 4.10% | |
| 06:00 | GBP | PPI Input M/M Apr | 2.40% | 1.10% | 4.40% | 4.30% |
| 06:00 | GBP | PPI Input Y/Y Apr | 7.70% | 5.90% | 5.40% | 5.30% |
| 06:00 | GBP | PPI Output M/M Apr | 1.40% | 0.90% | 0.90% | 1.40% |
| 06:00 | GBP | PPI Output Y/Y Apr | 4.00% | 2.80% | 2.60% | |
| 06:00 | GBP | PPI Core Output M/M Apr | 0.70% | 0.20% | ||
| 06:00 | GBP | PPI Core Output Y/Y Apr | 2.40% | 2.00% | 3.00% | |
| 09:00 | EUR | Eurozone CPI Y/Y Apr F | 3.00% | 3.00% | 3.00% | |
| 09:00 | EUR | Eurozone Core CPI Y/Y Apr F | 2.20% | 2.20% | 2.20% | |
| 14:30 | USD | Crude Oil Inventories (May 15) | -7.9M | -2.5M | -4.3M | |
| 18:00 | USD | FOMC Minutes |
| 01:15 | CNY |
| 1-y Loan Prime Rate | |
| Actual | 3.00% |
| Consensus | 3.00% |
| Previous | 3.00% |
| 01:15 | CNY |
| 5-y Loan Prime Rate | |
| Actual | 3.50% |
| Consensus | 3.50% |
| Previous | 3.50% |
| 06:00 | EUR |
| Germany PPI M/M Apr | |
| Actual | 1.20% |
| Consensus | 1.00% |
| Previous | 2.50% |
| 06:00 | EUR |
| Germany PPI Y/Y Apr | |
| Actual | 1.70% |
| Consensus | 1.50% |
| Previous | -0.20% |
| 06:00 | GBP |
| CPI M/M Apr | |
| Actual | 0.70% |
| Consensus | 0.90% |
| Previous | 0.70% |
| 06:00 | GBP |
| CPI Y/Y Apr | |
| Actual | 2.80% |
| Consensus | 3.00% |
| Previous | 3.30% |
| 06:00 | GBP |
| Core CPI Y/Y Apr | |
| Actual | 2.50% |
| Consensus | 2.70% |
| Previous | 3.10% |
| 06:00 | GBP |
| RPI M/M Apr | |
| Actual | 0.70% |
| Consensus | 1.40% |
| Previous | 0.80% |
| 06:00 | GBP |
| RPI Y/Y Apr | |
| Actual | 3.00% |
| Consensus | 3.70% |
| Previous | 4.10% |
| 06:00 | GBP |
| PPI Input M/M Apr | |
| Actual | 2.40% |
| Consensus | 1.10% |
| Previous | 4.40% |
| Revised | 4.30% |
| 06:00 | GBP |
| PPI Input Y/Y Apr | |
| Actual | 7.70% |
| Consensus | 5.90% |
| Previous | 5.40% |
| Revised | 5.30% |
| 06:00 | GBP |
| PPI Output M/M Apr | |
| Actual | 1.40% |
| Consensus | 0.90% |
| Previous | 0.90% |
| Revised | 1.40% |
| 06:00 | GBP |
| PPI Output Y/Y Apr | |
| Actual | 4.00% |
| Consensus | 2.80% |
| Previous | 2.60% |
| 06:00 | GBP |
| PPI Core Output M/M Apr | |
| Actual | 0.70% |
| Consensus | |
| Previous | 0.20% |
| 06:00 | GBP |
| PPI Core Output Y/Y Apr | |
| Actual | 2.40% |
| Consensus | |
| Previous | 2.00% |
| Revised | 3.00% |
| 09:00 | EUR |
| Eurozone CPI Y/Y Apr F | |
| Actual | 3.00% |
| Consensus | 3.00% |
| Previous | 3.00% |
| 09:00 | EUR |
| Eurozone Core CPI Y/Y Apr F | |
| Actual | 2.20% |
| Consensus | 2.20% |
| Previous | 2.20% |
| 14:30 | USD |
| Crude Oil Inventories (May 15) | |
| Actual | -7.9M |
| Consensus | -2.5M |
| Previous | -4.3M |
| 18:00 | USD |
| FOMC Minutes | |
| Actual | |
| Consensus | |
| Previous | |
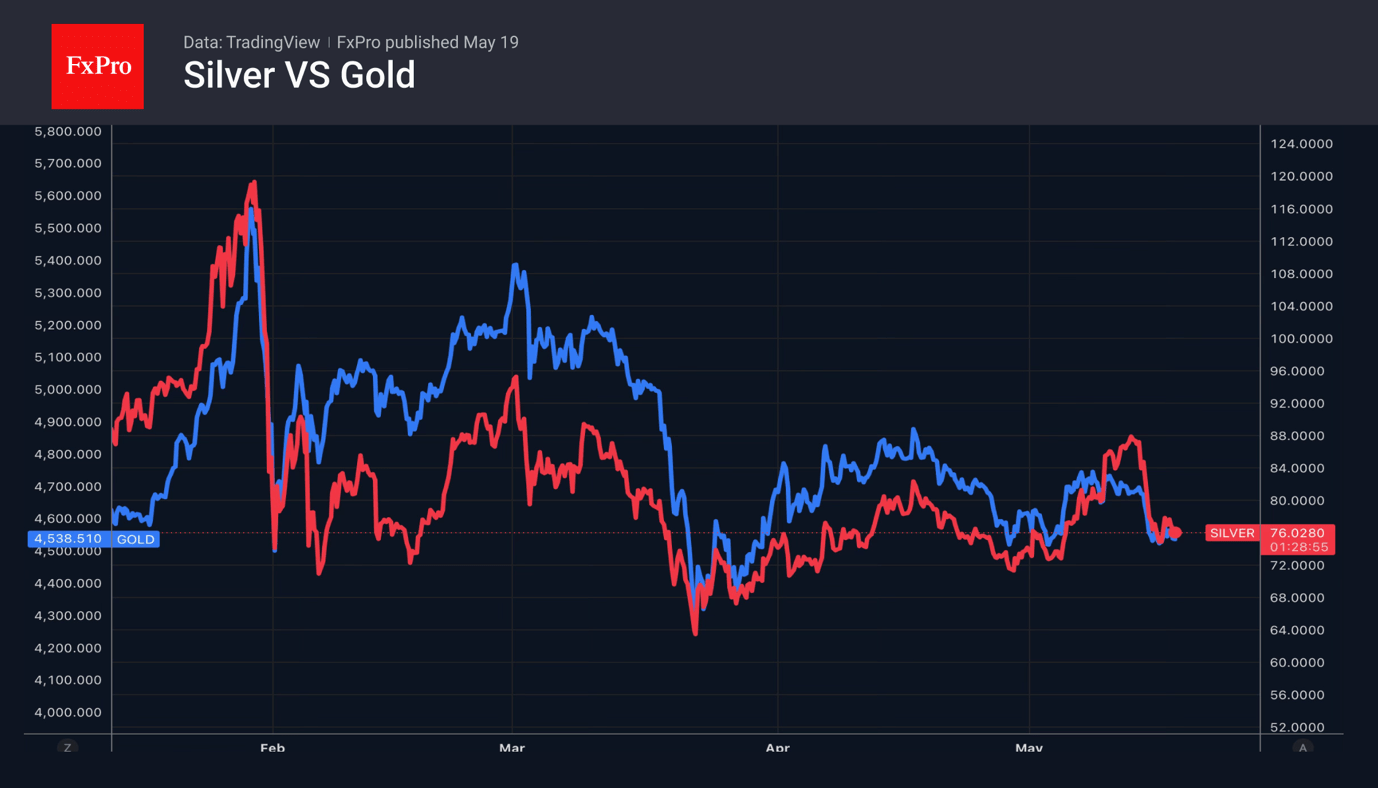
Silver Caught in a Price Trap
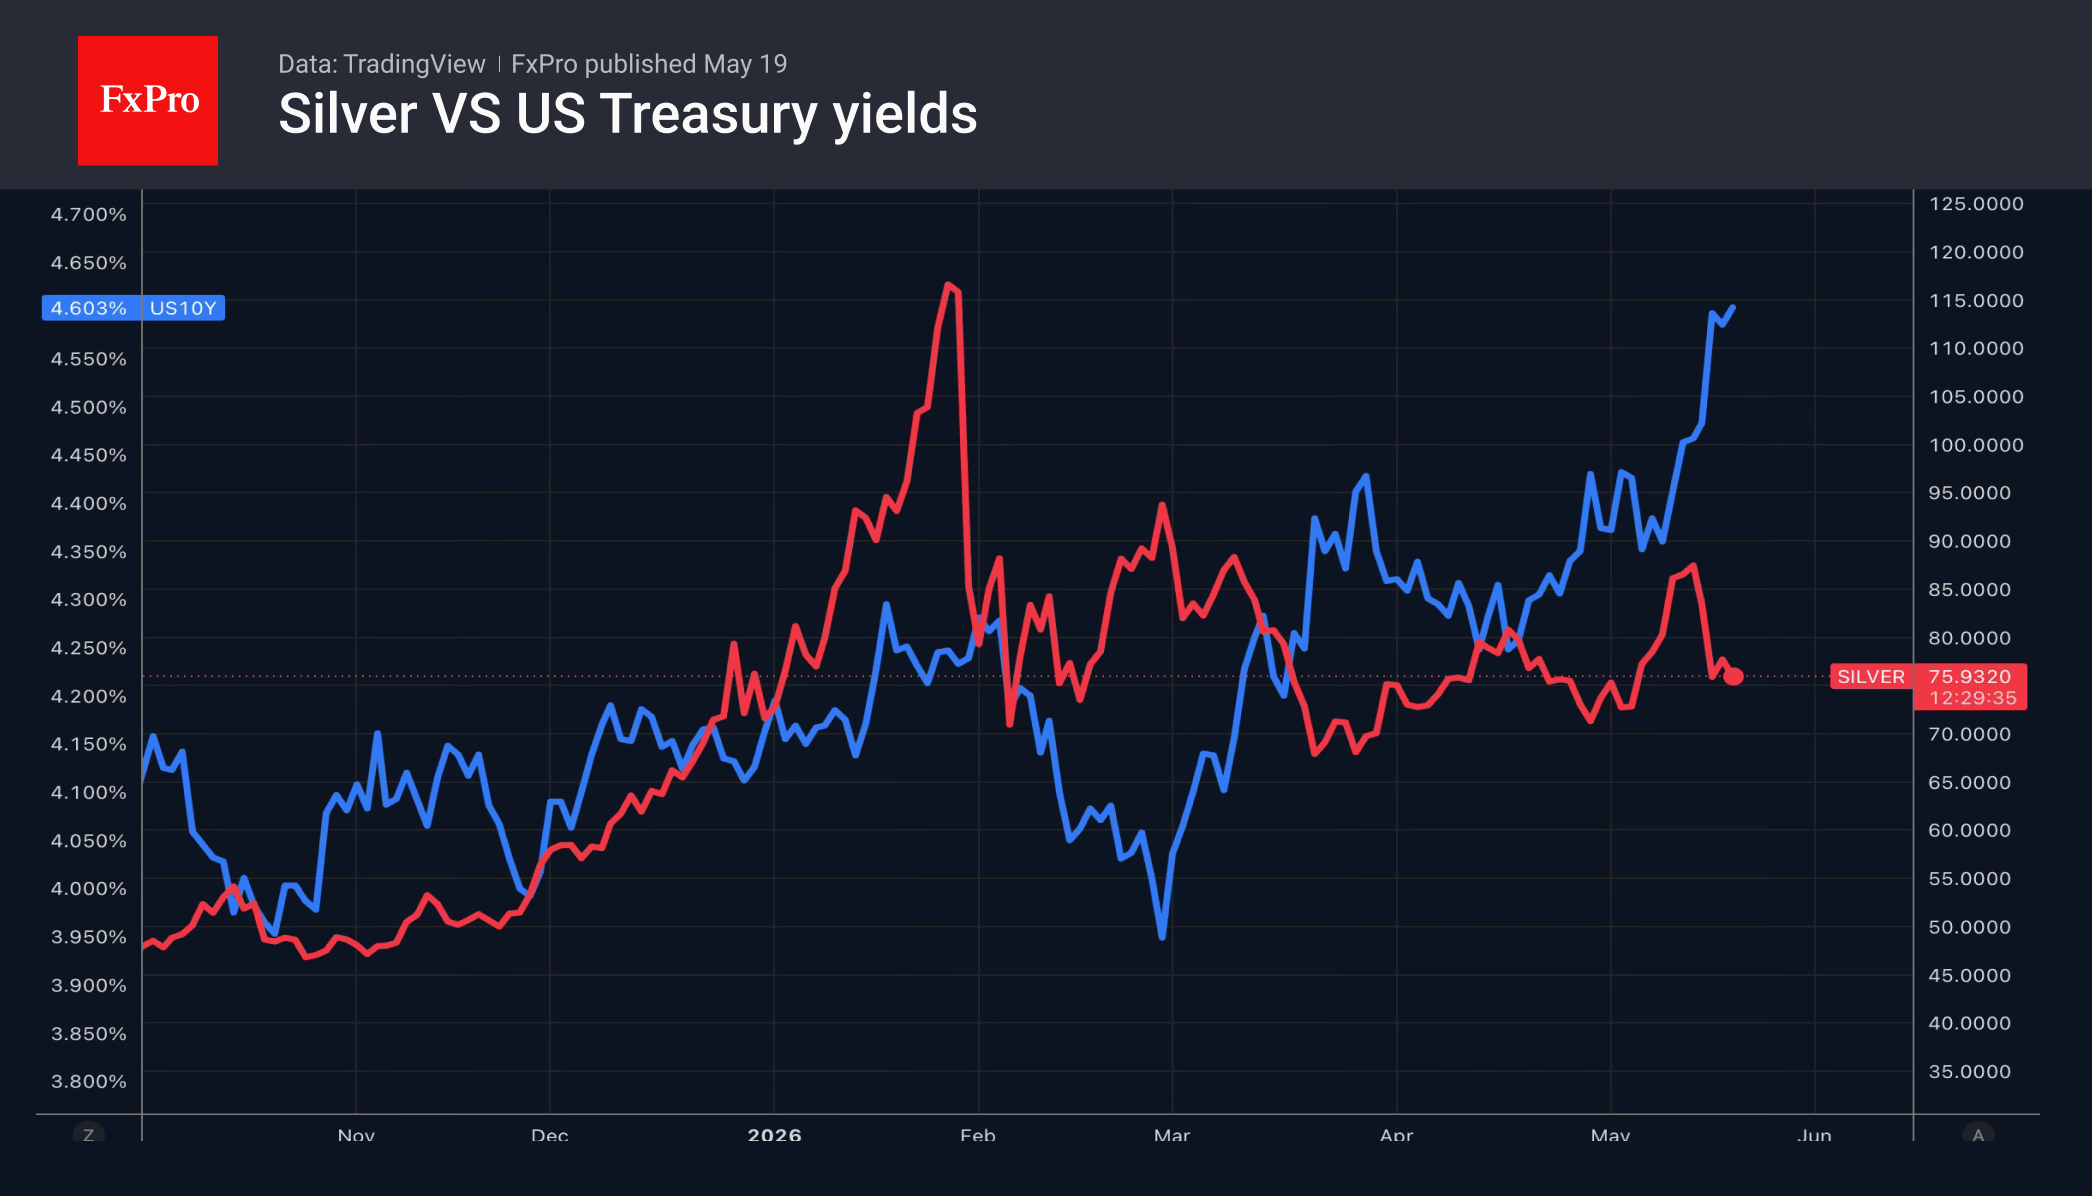
After a long period of calm, volatility has returned to the silver market. Silver surged to a two-month high, rallying more than 20% from its May lows in just a week. However, concerns over tighter monetary policy and rising bond yields have since put pressure on prices.
Of course, the current fluctuations cannot be compared to what we saw in January, when a 35% drop occurred in a single day. Investors felt that the rally had gone too far. However, the situation does not yet look like a classic bubble burst, as silver prices are still 130% higher than a year ago, which is suppressing global demand. UBS estimates a 50 million-ounce decline this year, allowing the bank to lower its price forecast from $100 to $85 per ounce by the end of the second quarter.
High prices are forcing not only jewellers but also industrialists to seek alternatives for silver. There has been some success in replacing it with copper in the manufacture of solar panels. This sector accounts for a fifth of global supply. Due to the fall in global demand, the 46.3-million-ounce deficit forecast by the Silver Institute for 2026 may prove smaller, putting pressure on the price per ounce.
Silver is also facing weaker investment demand. Rising global bond yields and a stronger US dollar are putting pressure on the metal. UBS reports that speculative interest has fallen sharply, while silver ETF holdings have dropped by 70 million ounces since the start of the year, to 794 million ounces.
De-escalation in the Middle East could turn the tables. Oil, the US dollar and Treasury yields would fall, which would be positive for silver. However, as long as the Strait of Hormuz remains blocked, it remains under pressure.
The silver market is relatively small compared to gold, which makes it more vulnerable to speculative trading. This often leads to sharper price moves in both directions.
Dollar Making a Tactical Retreat
- Rumours of talks with Iran have caused the USD index to retreat.
- The pound has recouped some of its losses thanks to Labour’s intention to stick to the rules.
The US dollar has retreated following Donald Trump’s statement that he was postponing the resumption of bombing Iran. According to the US president, he was asked to do so by Qatar, Saudi Arabia and the UAE because negotiations with Tehran are underway. Markets have once again come to believe in a de-escalation of the conflict in the Middle East, which has led to a fall in oil prices and the USD index.
Despite the headlines, the US and Iran remain far apart on key issues. It is difficult to envisage the Strait of Hormuz reopening any time soon, and the longer the standoff persists, the stronger the tailwinds for Brent and the dollar. Even more so, the stock market has finally begun to consider the negative consequences of accelerating inflation and the attractiveness of rising Treasury yields. The S&P 500 has retreated from record highs, and the associated deterioration in global risk appetite has bolstered the greenback as a safe-haven asset.
The swearing-in ceremony for Kevin Warsh as the new Fed Chair will take place at the White House this Friday. No doubt, Donald Trump is sincerely hoping for a rate cut, despite the futures market suggesting a 50% probability of a rate hike in 2026 after actively repricing expectations in recent weeks.
The British pound has launched a counterattack thanks to a statement by Manchester Mayor Andy Burnham. The frontrunner to succeed Keir Starmer as Prime Minister has stated that he adheres to fiscal rules. Previously, investors had feared that the new head of government would turn to fiscal stimulus, which would conflict with the Bank of England’s monetary tightening. Bond selloffs paused, and GBPUSD rose from 1.33 to 1.34.
The pound was supported by the IMF, raising its forecast for UK GDP growth from 0.8% to 1% in 2026. The economy may be able to withstand two rounds of BoE rate hikes, as signalled by the futures market.
Japan’s 2.1% GDP growth in the first quarter did not deter the USDJPY bulls. Investors are cautiously awaiting the government’s use of a supplementary budget to finance the servicing costs of its growing debt.
Sunset Market Commentary
Markets
The US 30-yr yield today broke key resistance at 5.15%/5.17% (respective tops of 2025 and 2023) to currently trade at the highest level since 2007. The 5.5% area is the next technical reference on the chart. It’s where the top levels of 2003, 2004 and 2007 all collide. The US 10-yr yield moves past the May2025 top at 4.62% with the 2025 top (4.81%) and 2023 (5.02%) tops being the remainder hurdles before joining the 30-yr yield to highest levels since 2007. This set-up immediately presents Kevin Warsh with a formidable challenge after he’s sworn in as next Fed chair on Friday. In the past, Warsh has consistently been critical on the (size of the) Fed’s balance sheet. He repeatedly argued to shrink it further, enabling a return to short-term interest rates as the central bank’s prime tool. He believes that the Fed played an outsized role via its asset purchases and argues for a much smaller (market) footprint. Question is of course how feasible these ideas are at current interest rate levels and with the US government running budget deficits to the tune of 8% of GDP. Warsh will have to walk a tightrope balancing what will probably still be his structural view without discomforting markets when it comes to size or speed for any such potential execution of his plans. Simultaneously, inflation risks stemming from the ongoing stalemate between the US and Iran are throwing a spanner in his preference to complement a tighter liquidity policy with a looser interest rate stance. The US 2-yr yield holds firmly above 4% as markets err on the side of a rate hike rather than a rate cut as the Fed’s next move, with recent eco data and labour market proving solid. A sticky oil price is the needle in the compass. Brent crude trades around $110/b with markets less willing to anticipate any breakthrough. The lacklustre reaction to yesterday’s (US) announcement that an imminent attack against Iran (today) has been postponed serves as a point in case. With commercial oil reserves depleting at stealth pace, the clock is ticking towards a significant binary risk. It’s unclear when the alarm goes off. Depending on the source/analyst, it could come as soon as end May/early June. A new upleg beyond the $120/b-top without roadmap to a reopening of Hormuz or a return towards the $100/b in anticipation of final agreements? Time will tell. Renewed pressure on US Treasuries today hurts risk sentiment again with key US indices losing more than 0.5% at the start of dealings. They might be exposed to a more pronounced correction once earnings/AI-support falters after Nvidia earnings. The US dollar gains the upper hand on FX markets in this bearish market with EUR/USD testing 1.16 for the first time since the start of the initial cease-fire between the US and Iran.
News & Views
The Brazilian real opened a tad weaker today with USD/BRL bouncing back above the 5 barrier. It followed an election poll that showed president Lula da Silva reclaiming the lead over Bolsonaro with 49% against 42%. Bolsonaro’s momentum grew shortly after his December announcement that he would challenge Lula in the October 4 presidential elections, putting him virtually on par in with the incumbent president ever since. A recent banking fraud scandal however has weighed on Bolsonaro’s popularity and that’s now beginning to show up in the polls. Former-president Bolsonaro for financial markets is the preferred pick over Lula, which is seen wavering on fiscal discipline through, amongst others, a series of stimulative measures taken in recent weeks.
Canadian April inflation came in at the low end of expectations. The headline number printed 0.4% m/m vs 0.7% expected and down from the 0.9% seen in March. The annual figure still quickened from 2.4% to a two-year high of 2.8% but remained below the 3.1% bar. Core gauges at 2% (trimmed) and 2.1% (median) similarly undershot the 2.2% and 2.3% consensus view. Energy prices rose a sharp 5.7% m/m, down from March’s 13.1% as the Middle East impact continues to linger. The annual reading was further amplified through base effects (the removal of a carbon levy in April 2025), lifting it to 19.2%. Fuel oil and other fuels shot up 41.3% y/y, Statistics Canada said. Inflation stagnated when excluding energy on a monthly basis to be up 1.8% year-over-year. Stripping out food prices on top of that leaves CPI at 1.5%, the slowest since March 2021. Services inflation meanwhile fell by 0.3% m/m to 1.7% y/y. Canadian swap yields drop up to 3.5 bps at the front end of the curve with Canadian money markets pushing back slightly on central bank tightening bets. The Loonie loses ground to USD/CAD 1.376, matching mid-April levels.
Canadian Inflation Heats up in April, But Core Inflation remains Cool
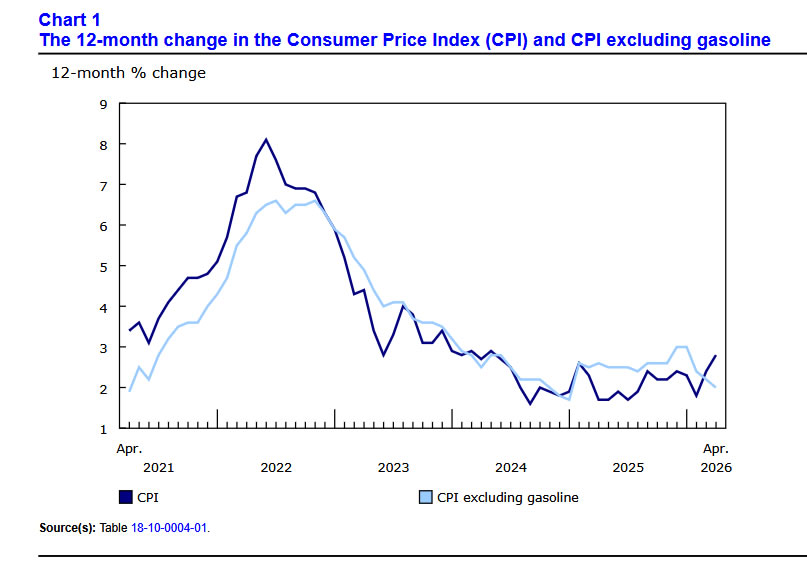
Headline CPI inflation jumped up to 2.8% year-on-year (y/y) in April, from 2.4% in March, slightly below consensus expectations. Higher gasoline prices were a big part of the story, with inflation ex-gasoline up a more modest 2.0% y/y.
Prices at the pump were up 28.6% y/y in April. Energy prices as a whole were 19.2% higher versus a year ago, the fastest pace since 2022. Surprisingly, food inflation cooled to 3.5% y/y in April, down from 4% y/y in March.
Inflation for various categories was a mixed bag. Shelter inflation picked up slightly, rising 1.8% y/y in April up from 1.7% y/y in March. However, this was driven by rising utility costs: water, fuel and electricity rose 5.5% y/y, up from basically flat prior to the oil shock. Overall services inflation cooled further to 1.7% y/y down from 2.6% y/y in March. Core goods inflation picked up to 1.6% y/y from 0.9% y/y in April. Clothing inflation picked up in April, rising 2% y/y from being down 0.4% y/y in March.
Higher energy costs have not yet filtered through to core inflation. In fact, core inflation cooled in April! The Bank of Canada's official core inflation metrics (median and trim), averaged 2.1% y/y in April, down from 2.3% in March.
Key Implications
As expected, higher oil prices lifted Canadian inflation in April, but we are not yet seeing much of a knock-on effect to non-energy related goods or services. Core inflation pressures were actually softer than expected in April. There is little argument yet for Bank of Canada rate hikes here, and market pricing for rate hikes this year has come down a bit this morning.
Oil prices have remained high in May, so energy prices are likely to keep headline inflation elevated for some time. Given a generally soft economic backdrop in Canada, we expect the effect on core prices should be more modest. Core inflation is expected to stay reasonably close to the 2% target on a year-on-year basis this year (see details in today's report).
Bond Market Faces Vicious Feedback Loop as Oil Shock Drives Treasury Liquidation
The sharp rise in US Treasury yields remains one of the dominant macro themes in global markets this week, with the 10-year yield climbing back to 4.62% after only a brief pullback yesterday, near its highest level in more than a year. While markets continue focusing on inflation concerns and expectations for prolonged restrictive Federal Reserve policy, a second and increasingly important driver is emerging beneath the surface: forced liquidation of Treasuries by foreign central banks facing mounting pressure from the global energy shock.
According to reports, foreign governments sharply reduced Treasury holdings in March as the Middle East conflict forced central banks to defend weakening local currencies against surging energy prices. China cut its holdings to USD 652.3B, the lowest level since September 2008, while Japan — the largest foreign holder of US debt — reduced holdings by roughly USD 47B to USD 1.191T. Overall foreign holdings declined from USD 9.49T in February to USD 9.25T in March. The liquidation created a significant supply-demand imbalance in the Treasury market, directly contributing to rising yields.
The mechanics of the move are creating what resembles a vicious feedback loop. Central banks sell Treasuries to raise Dollars and stabilize domestic currencies weakened by the oil shock. But higher Treasury yields simultaneously strengthen the Dollar further, increasing depreciation pressure on those same currencies and potentially forcing additional reserve liquidation. In effect, the Treasury market is no longer reacting solely to inflation expectations or Fed policy. It is increasingly reflecting global liquidity stress and balance sheet pressures across the international financial system.
Meanwhile, oil prices remain elevated despite temporary diplomatic relief headlines. Brent crude briefly pulled back after US President Donald Trump announced he was postponing a planned strike on Iran at the request of Gulf allies including Saudi Arabia, the UAE, and Qatar. However, the decline proved shallow because the underlying drivers keeping energy markets tight remain firmly in place. The Strait of Hormuz remains effectively blocked, commercial inventories are critically low, and the broader geopolitical standoff continues unresolved.
Reports also suggest the latest Iranian proposal sent to Washington through Pakistan did little to alter the underlying impasse. Iran reportedly focused its framework on separating the war and maritime blockade issues from the nuclear negotiations, prioritizing immediate economic and military relief while delaying the core nuclear questions. For Trump and his national security team, including Defense Secretary Pete Hegseth, sidelining the nuclear issue appears unacceptable, reinforcing market expectations that tensions may persist rather than de-escalate meaningfully.
In currency markets, Dollar is the strongest major currency of the day so far, supported by rising yields and persistent global uncertainty. Sterling and Yen also outperformed, while Aussie and Kiwi lagged amid weaker risk sentiment and renewed concerns about China’s slowdown. Swiss Franc underperformed as higher global yields reduced demand for low-yielding safe havens, while Euro and Canadian Dollar traded more neutrally in the middle of the pack.
Attention now turns to whether equity markets can continue absorbing the rise in global yields without a broader risk-off break. Ultimately, the next major move in stocks may depend more on geopolitics directly and less on whether corporate earnings can continue justifying valuations in a world where Treasury yields are rapidly moving back toward cycle highs.
Canada CPI Misses Forecasts at 2.8% in April, Core Inflation Pressures Ease
Canada’s inflation rate accelerated to 2.8% in April as gasoline prices surged nearly 29%, but softer core inflation measures suggest underlying price pressures remain more contained than headline data imply. Read More.
EUR/GBP: Weak UK Jobs Data Pushes BoE Toward Patience, but CPI Holds Key to Breakout
Sterling softened slighlty after payrolls fell sharply and unemployment rose to 5.0%, reinforcing case for BoE patience. But with oil prices climbing again, tomorrow’s UK inflation data could quickly reshape the outlook. Read More.
Eurozone Trade Surplus Shrinks Sharply to EUR 7.8B as Exports to US Collapse
The Eurozone’s trade surplus narrowed sharply in March as exports to the US collapsed and imports continued rising, reinforcing concerns that weakening global demand and higher energy costs are increasingly weighing on Europe’s economy. Read More.
UK Unemployment Rate Rises to 5.0% as Payroll Employment Continues to Decline
UK payroll employment fell again in April while unemployment rose to 5.0% in the three months to March, signaling softer labor market conditions. However, wage growth remained firm enough to keep inflation concerns alive for the Bank of England. Read More.
Japan Q1 GDP Beats Forecasts, Economy Entered Iran Conflict on Solid Footing
Japan’s economy expanded faster than expected in Q1, with exports, consumer spending, and business investment all contributing to stronger growth before the Middle East energy shock intensified. The data suggest Japan entered the Iran conflict period with some economic buffers already in place. Read More.
AUD/CAD Reverses Lower as China Slowdown, RBA Pause, and Oil Surge Shift Momentum to Loonie
AUD/CAD reversed lower this week as weak Chinese data, renewed risk-off sentiment, and fading expectations for a fourth straight RBA rate hike undermined Aussie, while rising oil prices continued boosting Canadian Dollar. Technical signals now suggest a possible medium-term top may already be forming near parity. Read More.
RBA’s Hunter Warns Existing Inflation Pressures Could Amplify Oil Shock Across Economy
RBA Chief Economist Sarah Hunter warned that the oil shock is hitting an economy already strained by elevated inflation pressures, raising the risk that higher fuel costs spread more rapidly across businesses and consumers. The RBA is increasingly concerned inflation expectations could become embedded. Read More.
RBA Minutes: Tactical Wait-and-See, Not End of Tightening Bias Yet
RBA minutes showed policymakers are shifting into a tactical wait-and-see phase after concluding rates are now likely restrictive, but the Board made clear the tightening bias has not been abandoned as inflation risks remain elevated. Read More.
Australian Westpac Consumer Confidence Ticks Higher, but Energy and RBA Rate Fears Still Dominate
Australian consumer sentiment recovered slightly in April after fuel prices eased, but households remained deeply pessimistic as higher interest rates and Strait of Hormuz-related energy risks continued weighing on confidence. Westpac expects the RBA to pause in June, though further rate hikes may still follow later this year. Read More.
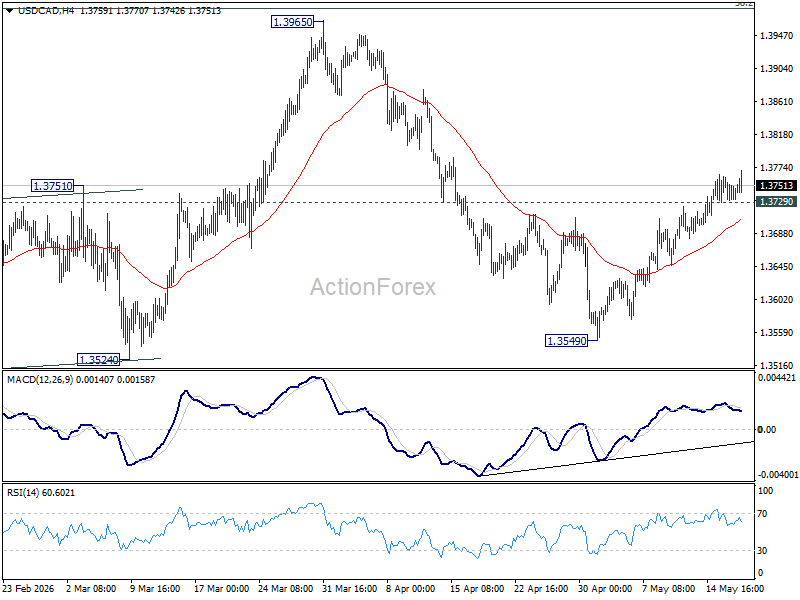
USD/CAD Daily Outlook
Intraday bias in USD/CAD stays mildly on the upside as rebound from 1.3549 is in progress. This rise is seen as the third leg of the corrective pattern from 1.3480. Further rise would be seen towards 1.3965 resistance. On the downside, below 1.3729 minor support will turn intraday bias neutral first.
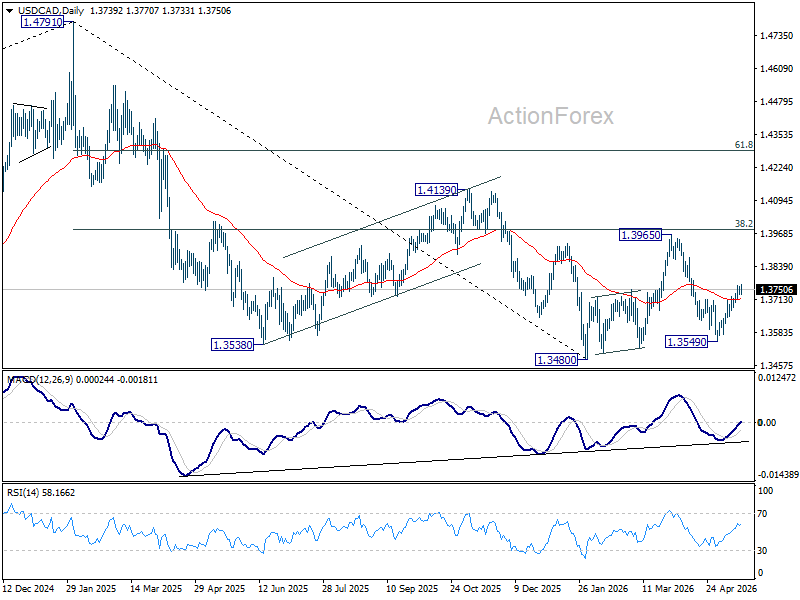
In the bigger picture, price actions from 1.4791 are seen as a corrective pattern to the whole up trend from 1.2005 (2021 low). Deeper fall could be seen, as the pattern extends, to 61.8% retracement of 1.2005 to 1.4791 at 1.3069. However, decisive break of 38.2% retracement of 1.4791 to 1.3480 at 1.3981 will argue that the correction has completed with three waves down to 1.3480 already.
Canada CPI Misses Forecasts at 2.8% in April, Core Inflation Pressures Ease
Canada’s inflation rate accelerated in April as rising gasoline prices pushed headline CPI higher, but softer core inflation measures suggest underlying price pressures remain more contained than feared. CPI rose 0.4% mom in April, below expectations of 0.7% mom, while annual inflation increased from 2.4% yoy to 2.8% yoy, undershooting the expected 3.1% yoy.
Energy prices were once again the dominant driver. Energy inflation surged from 3.9% yoy to 19.2% yoy, while gasoline prices accelerated sharply from 5.9% yoy to 28.6% yoy. Statistics Canada said part of the jump reflected the removal of the consumer carbon levy in April last year dropping out of annual comparisons, creating additional upward pressure on headline CPI. However, excluding gasoline, inflation actually cooled from 2.2% yoy to 2.0% yoy, pointing to easing price momentum across much of the broader economy.
The softer underlying trend was reinforced by Canada’s key core inflation measures, all of which slowed more than expected. CPI common eased to 2.5% yoy, CPI median fell to 2.1% yoy, and CPI trimmed slowed to 2.0% yoy. The data are likely to strengthen the Bank of Canada’s argument that the current inflation spike is largely an externally driven energy shock rather than a sign of renewed domestic inflation overheating, supporting expectations that policymakers will stay patient while assessing how persistent the oil-driven pressures ultimately become.
| Indicator | Previous | Latest | Expectation |
|---|---|---|---|
| CPI (mom) | — | 0.4% | 0.7% |
| CPI (yoy) | 2.4% | 2.8% | 3.1% |
| Energy Prices (yoy) | 3.9% | 19.2% | — |
| Gasoline Prices (yoy) | 5.9% | 28.6% | — |
| CPI ex Gasoline (yoy) | 2.2% | 2.0% | — |
| CPI Common (yoy) | 2.6% | 2.5% | 2.6% |
| CPI Median (yoy) | 2.3% | 2.1% | 2.2% |
| CPI Trimmed (yoy) | 2.2% | 2.0% | 2.3% |