
Sample Category Title
EURUSD Zigzag Correction Points to Elliott Wave Support at 1.148–1.160
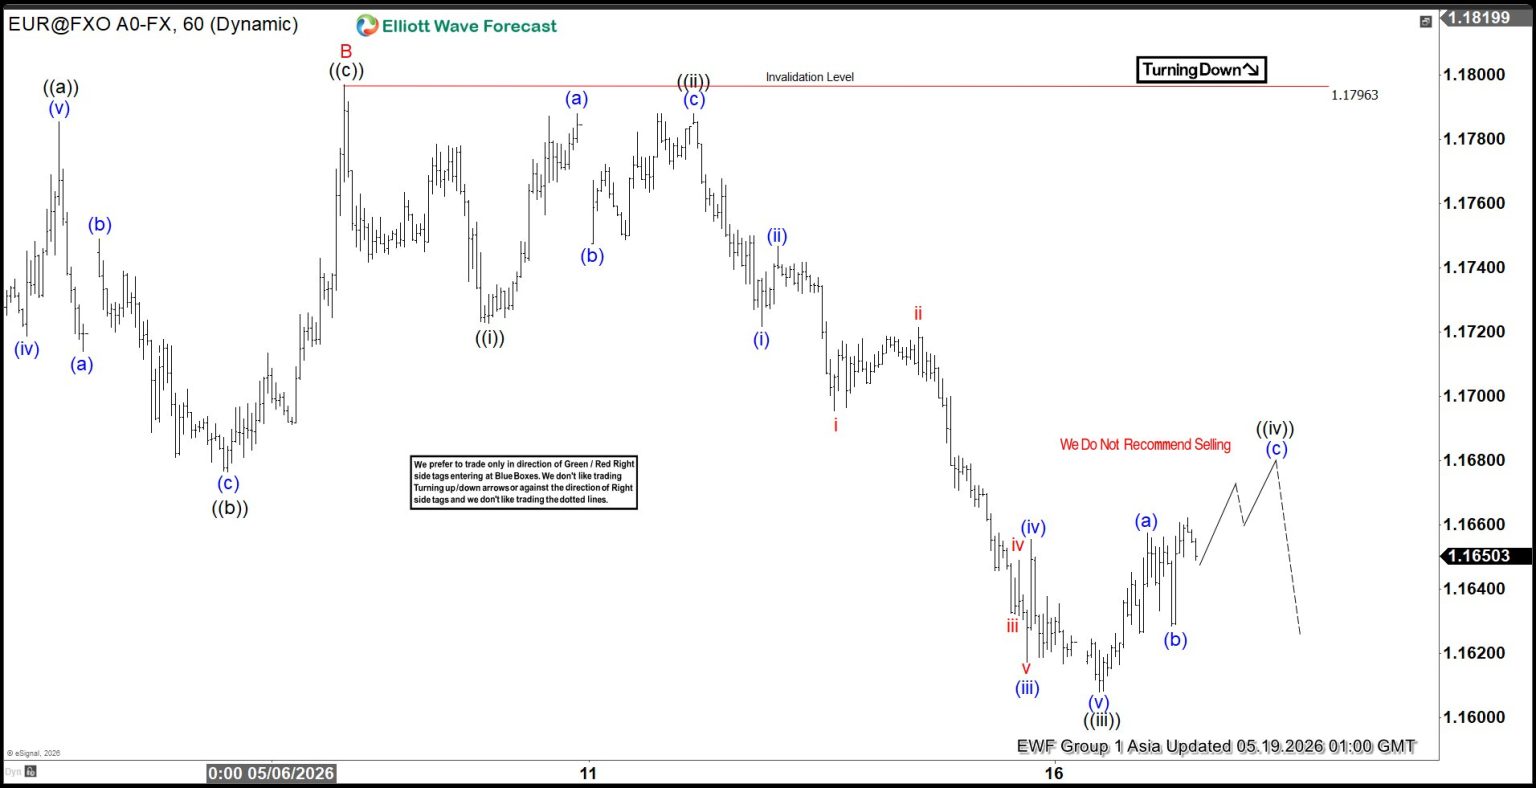
EURUSD is unfolding a corrective zigzag structure from the April 17, 2026 high. First, wave A ended at 1.1655, establishing the initial leg of the decline. Then, wave B rallied to 1.1796, as shown on the one‑hour chart. From that point onward, wave C began to progress lower, subdividing into five smaller waves. This subdivision aligns with Elliott Wave guidelines and confirms the corrective nature of the move.
Specifically, wave ((i)) concluded at 1.1722, after which wave ((ii)) rallied to 1.1788. Subsequently, the pair resumed its decline in wave ((iii)), which extended toward 1.1608. Now, wave ((iv)) is advancing as a rally. Importantly, resistance should appear in the 1.168–1.171 zone, where sellers may re‑emerge.
Moreover, as long as the pivot at 1.18 holds, rallies are likely to fail in either three or seven swings. Consequently, the bearish sequence should continue. The potential target for wave C can be projected using the Fibonacci extension of wave A. In particular, the 100%–161.8% extension range provides a reliable measurement. This calculation identifies 1.148–1.16 as the target zone. At that level, buyers are anticipated to appear. As a result, the market could attempt a new high above the April 17 peak or develop a larger three‑wave rally.
EURUSD 60-Minute Elliott Wave Chart
EURUSD Elliott Wave Video:
https://www.youtube.com/watch?v=ejfcCWMx9GU
Bond Yield Breakout Threatens Tech Rally
Key Takeaways
- Rising global bond yields and growing expectations of future Federal Reserve rate hikes are increasingly threatening the AI-driven technology rally, pressuring growth-stock valuations across global equity markets.
- Geopolitical tensions escalated sharply after a drone strike targeted a UAE nuclear facility, intensifying concerns over prolonged Middle East instability, elevated oil prices, and persistent inflationary pressures.
- Despite broader macro weakness, Asian technology stocks showed resilience as Baidu posted strong AI-driven earnings growth and Samsung Electronics gained ahead of highly anticipated NVIDIA earnings.
- Chart of the day: Nasdaq 100’s medium-term uptrend damaged, potential near-term weakness is likely to persist below 29,400 key short-term resistance.
Top Macro Headlines
- UAE nuclear plant targeted in severe escalation: Geopolitical tensions spiked as a drone strike caused a fire at a nuclear power plant in the United Arab Emirates. Simultaneously, Saudi Arabia reported intercepting three hostile drones. US President Donald Trump warned that Iran must act “fast” before he backed down on fresh military strikes following appeals from Gulf allies.
- Fed rate hike talks build: Wall Street is actively positioning for a hawkish pivot. Fed funds futures are now pricing in a high probability of a 25 bps rate hike by late 2026 or January 2027, driven by persistent inflation linked to the Middle East energy shock.
- Global bond rout deepens: Long-term government bond yields are breaking out to major inflection levels globally. The buckling of global bonds is being driven by entrenched inflation fears as the Middle East conflict drags on.
- Baidu and Samsung defy broader market gloom: Asian tech showed resilience, with Baidu topping Q1 estimates with a 49% surge in core AI-driven revenue, while Samsung shares, up 3.9% on Monday, 18 May, jumped as investors look ahead to NVIDIA's blockbuster earnings release.
- China retail sales growth weakens: China's retail sales have expanded at their slowest pace since the COVID-19 pandemic, signaling severe domestic demand sluggishness that is capping broader regional equity gains.
Key Macro Themes
- US-Iran conflict extends as midterms loom: There are currently few signs that a resolution to the Iran war is coming soon. The clock is ticking not just for Iran, but also for President Trump, as financial markets react to the ongoing oil shock while the US midterm elections approach.
- The shift to active tightening: With headline April inflation running hot, the narrative has shifted away from a simple “higher for longer” pause. Stagflation risks are forcing central banks and markets to consider renewed rate hikes to kill structural energy-driven inflation.
- NVIDIA earnings as the ultimate market litmus test: Markets are now hyper-focused on NVIDIA's upcoming earnings this Wednesday, which carries astronomical expectations and raises systemic risks for a broader tech selloff if the results or guidance disappoint.
Global Market Impact: Last 24 Hours
Equities: S&P 500 and Nasdaq 100 traded lower for the second consecutive session, weighed down by elevated government bond yields and prolonged anxiety over the Iran war. Despite the broader market pressure, Asian tech showed resilience as Samsung shares jumped and Baidu topped Q1 estimates. In today’s Asia opening session, the S&P 500 and Nasdaq 100 E-mini futures extended losses to around 0.2%.
Fixed Income: A global bond rout is deepening, leading to an impending major yield breakout that is actively pressuring the stock market. The US 10-year Treasury yield zoomed past 4.50%, while Japan's 10-year JGB yield hit a record high of 2.8%.
FX: The US Dollar Index, DXY, remains structurally dominant as rate hike expectations build, eroding alternative G10 gains and pressuring emerging market currencies.
Commodities: Oil prices jumped to a two-week high following the unexpected drone attack on the UAE nuclear power plant before slipping in the closing hour of Monday’s US session to trade almost unchanged after Trump backed down on military strikes against Iran. Conversely, spot Gold slipped to a 1.5-month low, falling 1.1% to around $4,480/oz before staging a minor bounce to end the US session up 0.6% at $4,566/oz, below its 20-day and 50-day moving averages.
Asia Pacific Impact
- Tech resilience vs. macro gloom: While Baidu's strong earnings and Samsung's pre-NVIDIA bounce may provide a tailwind for regional tech, broader indices like the Hang Seng and Nikkei are struggling under the weight of higher US yields and China's sluggish retail sales. Nikkei 225 is trading almost unchanged in today’s Asian opening session, while KOSPI sees profit-taking activity, down 2.6% at the time of writing.
- Currency strains and import bans: The widening yield premium with the US and the structural oil shock continue to deplete regional FX valuations. To protect the capital account, the Indian government has initiated emergency curbs on silver imports.
- Samsung labor talks: High-stakes negotiations between Samsung Electronics management and its labor union continue, with global memory supply chains hanging in the balance.
Top 3 Economic Data/Events to Watch Today
- Japan Q1 GDP Preliminary Release - 7.50 am SGT Impact: USD/JPY, JPY crosses, Nikkei 225
- RBA Monetary Policy Meeting Minutes - 9.30 am SGT Impact: AUD/USD, AUD crosses, ASX 200
- CA Core Inflation Rate (Apr) - 8.30 am SGT; consensus: 2.6% y/y, Mar: 2.5% y/y Impact: USD/CAD, CAD crosses
Chart of the Day: Nasdaq 100’s Medium-Term Uptrend Damaged
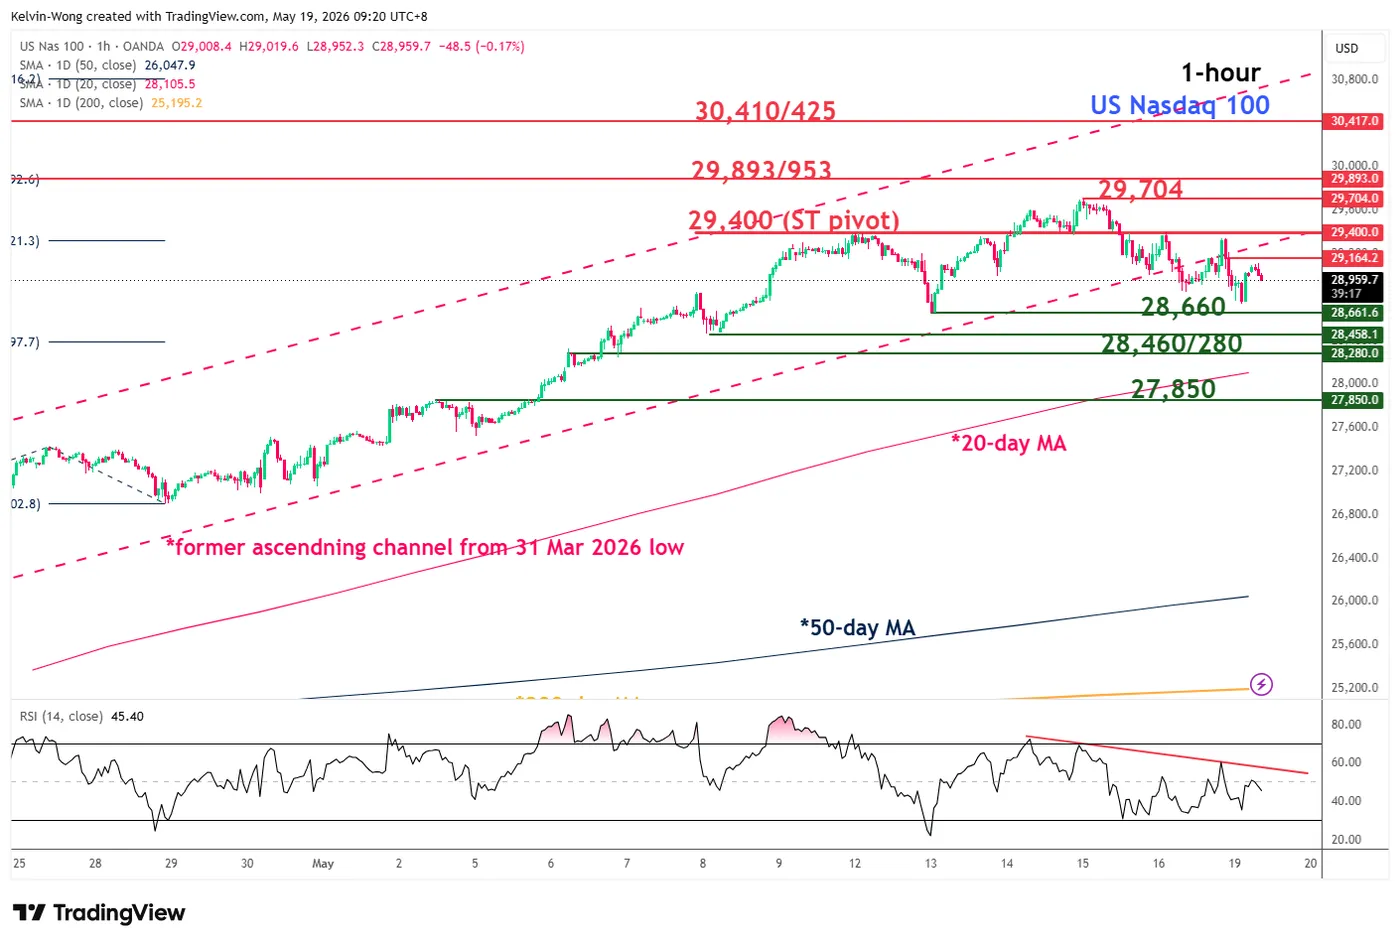
Fig. 1: US Nasdaq 100 CFD minor trend as of 19 May 2026. Source: TradingView.
The medium-term uptrend of the high-flying US Nasdaq 100 CFD, a proxy of the Nasdaq 100 E-mini futures, has been damaged as price actions broke below the former ascending channel support from the 31 March 2025 low.
In addition, the hourly RSI momentum indicator continues to flash bearish momentum conditions below the 50 level.
Watch the 29,400 key short-term pivotal resistance for a further potential slide towards 28,660 near-term support. A break below it exposes the next intermediate support at 28,460/280, also the 20-day moving average.
On the flip side, a clearance and an hourly close above 29,400 negates the bearish tone for a squeeze up to re-test the current intraday all-time high of 29,704 in the first step.
Ethereum Near Make-Or-Break Support As Selling Pressure Intensifies
Key Highlights
- Ethereum failed to stay above $2,250 and trimmed gains.
- A bullish trend line is forming with support at $2,100 on the daily chart of ETH/USD.
- Bitcoin price declined and settled below the $80,000 pivot zone.
- XRP failed to settle above $1.480 and $1.4850.
Ethereum Technical Analysis
Ethereum attempted an upside break above $2,400 but failed. ETH started a downside correction and traded below the $2,320 support.
Looking at the daily chart, the price failed to settle above the 38.2% Fib retracement level of the downward move from the $3,400 swing high to the $1,740 swing low. It is now below $2,200 and the 100-day simple moving average (red).
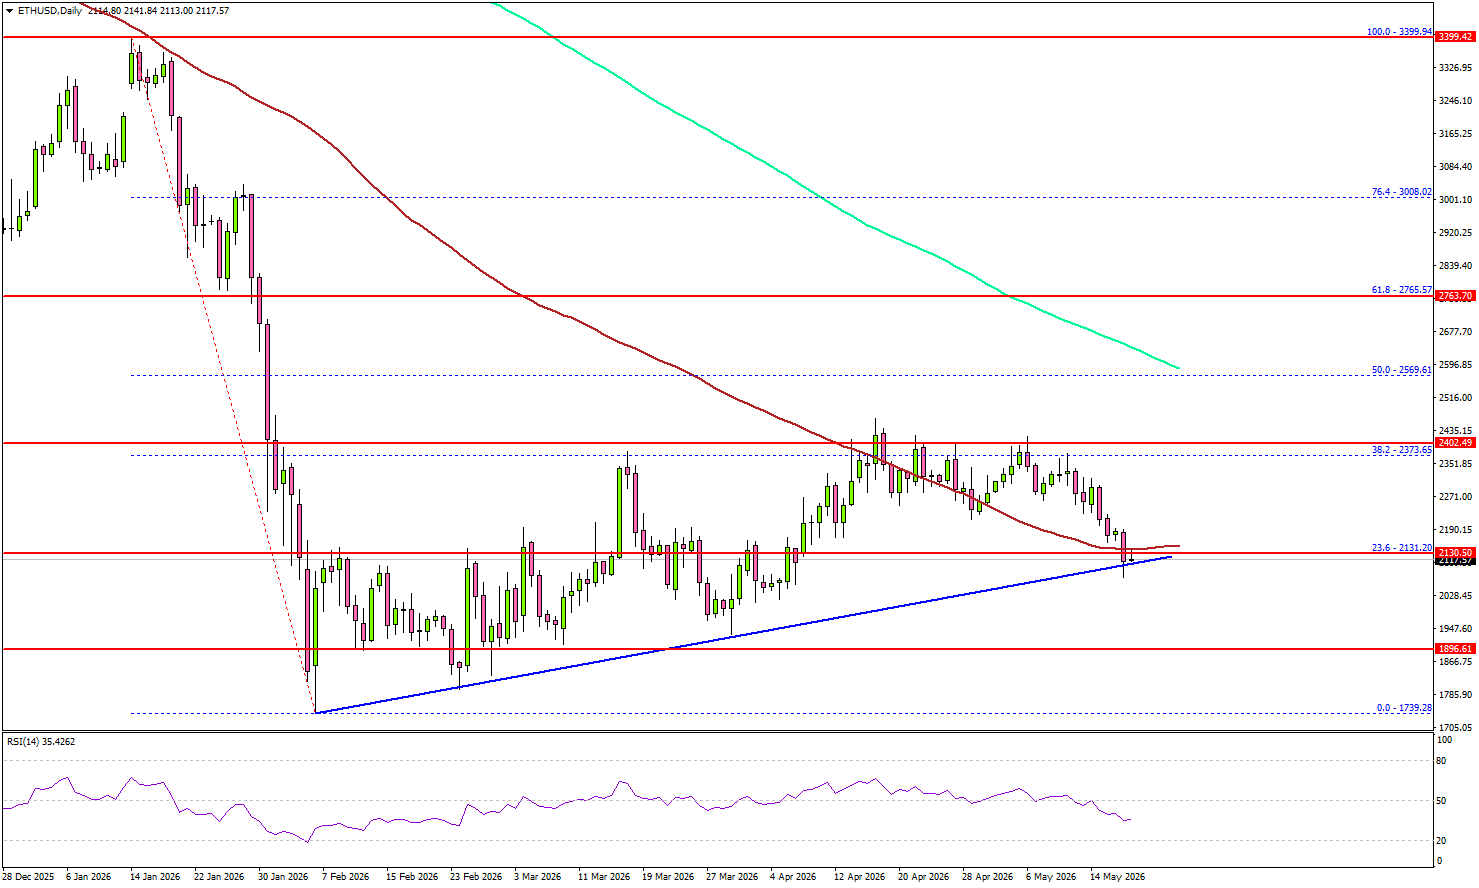
On the downside, the bulls might be active near $2,120 and $2,100. There is also a bullish trend line forming with support at $2,100, below which the price could slide toward $2,020. Any more losses might call for a move toward $1,965. The main support could be $1,880.
On the upside, the bears might remain active near $2,250. The first key resistance could be near the $2,320 level. The main hurdle for bulls sits near $2,400.
A close above the $2,400 level could open doors for a larger upward movement. In the stated case, ETH could rise toward the 50% Fib retracement level of the downward move from the $3,400 swing high to the $1,740 swing low at $2,565.
Looking at Bitcoin, the price failed to continue higher, trimmed gains, and now trades below the $80,000 support zone.
Economic Releases
- US Pending Home Sales for April 2026 (YoY) - Forecast +1.3%, versus +1.5% previous.
AUD/CAD Reverses Lower as China Slowdown, RBA Pause, and Oil Surge Shift Momentum to Loonie
Australian Dollar weakened broadly in the Asian session as renewed selloff in regional equities, disappointing Chinese data, and softer near-term RBA tightening expectations combined to undermine sentiment toward the currency. At the same time, elevated oil prices continued supporting Canadian Dollar, building up the case for the case of a deeper correction in AUD/CAD.
Risk sentiment deteriorated again today after the initial recovery seen following US President Donald Trump’s temporary pause on Iran escalation. Markets appear to view the move as a tactical delay rather than a lasting resolution, with geopolitical risk premium remaining elevated as investors await further developments from Washington and the Middle East.
Weak Chinese data this week added extra pressure on Aussie. China’s latest figures showed renewed weakness in domestic consumption and fixed asset investment, reinforcing concerns about slowing demand from Australia’s largest trading partner.
Meanwhile, the RBA minutes helped solidify expectations that the central bank is likely to pause in June after delivering three consecutive rate hikes this year. Policymakers acknowledged rates are now likely restrictive and suggested the latest move would give them “space to see how the Gulf conflict developed.”
While the minutes did not abandon the broader tightening bias, markets interpreted the shift as confirmation that the RBA has entered a tactical wait-and-see phase. Traders who had aggressively positioned for a fourth straight hike in June are now scaling back those expectations and shifting bets toward a possible August move instead.
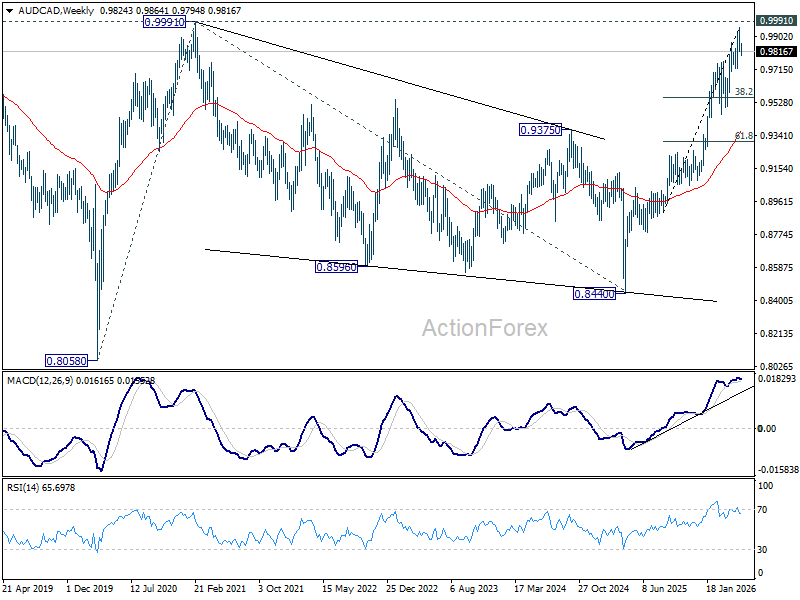
Technically, AUD/CAD’s extended pullback from 0.9957 suggests a short-term top has formed. More importantly, the reversal developed just ahead of the major 0.9991 resistance level (2021 high), while daily MACD bearish divergence conditions also point to fading upside momentum. Together, the signals raise the possibility that 0.9957 may already represent a medium-term top.
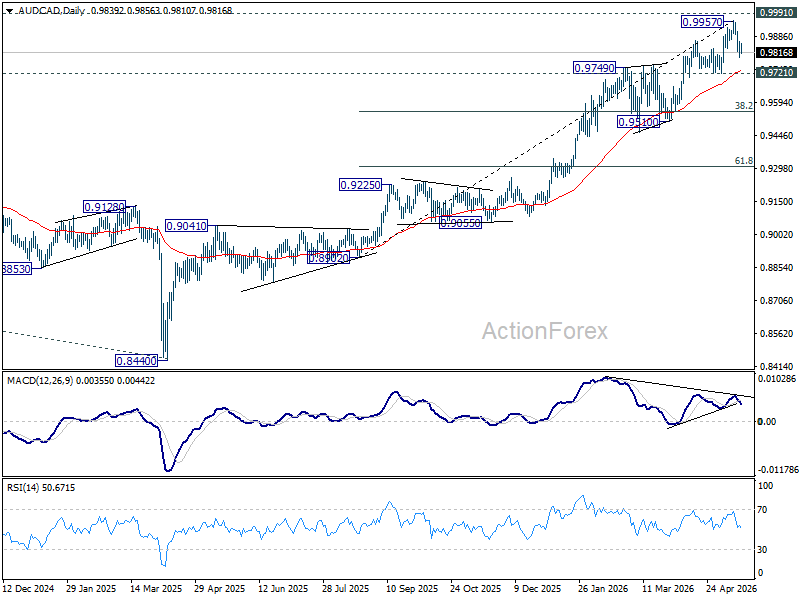
Near-term focus now turns to 0.9721 support. As long as that level holds, the broader medium-term uptrend remains intact despite the current correction. However, a firm break below 0.9721 would likely confirm a deeper pullback toward 38.2% retracement of 0.8902 to 0.9957 at 0.9554, especially if global risk sentiment deteriorates further and oil prices continue strengthening the loonie.
RBA’s Hunter Warns Existing Inflation Pressures Could Amplify Oil Shock Across Economy
RBA Chief Economist Sarah Hunter warned that Australia faces rising risks of entrenched inflation as higher fuel prices begin feeding through supply chains and lifting inflation expectations. Speaking at a Bloomberg event today, Hunter said the danger extends beyond just energy, warning that firms may increasingly raise prices in anticipation of sustained cost pressures.
“Cost pass-through may be stronger than assumed,” she said, adding that higher fuel prices could “lift and embed higher inflation expectations… perpetuating the inflationary shock.”
Hunter stressed that the situation is especially challenging because the oil shock is hitting an economy where inflation was already elevated before the Middle East conflict erupted. Businesses were already expecting to adjust prices upward due to domestic cost pressures, meaning the latest surge in energy costs could spread more rapidly through the economy.
“This shock has come against a backdrop of elevated capacity constraints and domestic cost pressures,” Hunter said, warning that inflation pass-through would likely be “faster and more extensive” under current conditions.
Hunter also warned that persistent rises in expectations would make it much harder for the central bank to return inflation to target because policymakers would need to suppress both demand and expectations simultaneously. “Doing so may require a more substantial slowing of economic activity, as we saw during the early 1990s recession,” she said.
RBA Minutes: Tactical Wait-and-See, Not End of Tightening Bias Yet
Minutes from the RBA’s May meeting suggested policymakers are leaning toward a pause in June after acknowledging that interest rates are now likely in restrictive territory. The Board raised the cash rate by 25bps to 4.35% in an 8-1 vote, but members also judged that “financial conditions would probably be somewhat restrictive after this decision,” giving policymakers “space to see how the conflict in the Middle East develops and Australian households and businesses respond.”
The minutes highlighted growing concern over the stagflationary nature of the current oil shock. Members agreed that monetary policy “could not alter the near-term trajectory of inflation” because much of the recent price pressure was being driven by energy markets rather than domestic demand. At the same time, the Board acknowledged that “output growth would likely be lower than potential growth for some time,” signaling rising awareness that tighter policy and higher fuel costs are already slowing activity across the economy.
Even so, the RBA stopped short of signaling the tightening cycle was over. The Board reiterated it would “remain attentive to the data and the evolving assessment of the outlook and risks,” while emphasizing it would “do what it considers necessary” to return inflation to target and maintain full employment. The combination of restrictive policy, slowing growth, and still-elevated inflation risks suggests the RBA is now shifting into a more tactical “wait-and-see” phase rather than abandoning its broader tightening bias altogether.
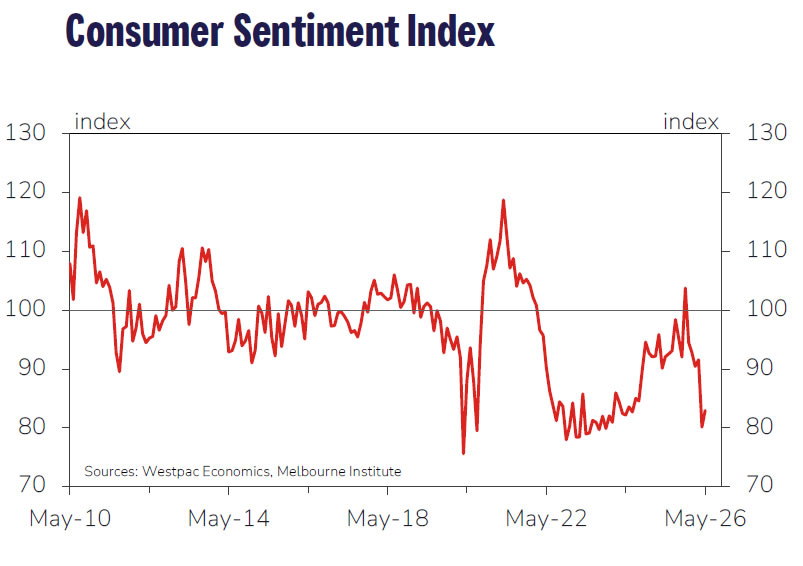
Australian Westpac Consumer Confidence Ticks Higher, but Energy and RBA Rate Fears Still Dominate
Australia’s consumer sentiment improved modestly in April as lower fuel prices helped ease part of the energy shock that hit households earlier this year, though confidence remained deeply pessimistic overall. Westpac Consumer Sentiment Index rose 3.5% mom to 83, recovering slightly from extreme lows as the government’s temporary halving of the fuel excise tax.
Westpac said the improvement mainly reflected easing fuel stress after last month’s sharp spike in oil prices. However, the positive impact was largely offset by the RBA’s 25bp rate hike earlier this month, its third consecutive increase, alongside ongoing cost-of-living pressures.
Forward-looking measures remained particularly weak. The “economy, next 12 months” sub-index fell -1.5% to 74.2, while the “economy, next 5 years” gauge slipped -2.2% to 89.3, marking the weakest combined reading since November 2022.
According to Westpac, RBA is expected to pause tightening at its June 15–16 meeting after raising interest rate at the previous three meetings, allowing policymakers time to assess the impact of both higher interest rates and the energy shock. Still, Westpac warned inflation risks remain high as rising energy costs continue passing through into broader prices, suggesting the pause may only be temporary before additional tightening resumes later this year.
Japan Q1 GDP Beats Forecasts, Economy Entered Iran Conflict on Solid Footing
Japan’s economy expanded faster than expected in the first quarter, suggesting domestic demand and exports were holding up well before the escalation of the Middle East conflict began weighing on the global outlook. GDP growth accelerated from 0.3% qoq to 0.5% qoq, slightly above expectations of 0.4% qoq. Annualized growth jumped from 0.8% to 2.1%, comfortably beating the 1.7% consensus forecast.
Exports provided an important boost to growth, rising 1.7% qoq on recovering auto shipments to the US and strong overseas demand for industrial machinery and electrical devices. Imports edged up just 0.5%. Domestic demand also remained resilient. Private consumption, which accounts for more than half of Japan’s economy, rose 0.3% qoq for a fifth consecutive quarter, supported by solid spending on clothing and dining out. Business investment also increased 0.3% qoq.
A government official said the impact of the Middle East conflict and the U.S.-Israeli attacks on Iran that began in late February was still unclear in the GDP data. Still, the stronger-than-expected report suggests Japan entered the energy shock period with some underlying economic buffers already in place. That could help the economy absorb part of the near-term drag from rising oil prices, although persistent energy inflation may still complicate the Bank of Japan’s policy outlook in coming quarters.
| Indicator | Previous | Q1 2026 | Expectation |
|---|---|---|---|
| GDP Growth (qoq) | 0.3% | 0.5% | 0.4% |
| GDP Growth (annualized) | 0.8% | 2.1% | 1.7% |
| Exports (qoq) | — | 1.7% | — |
| Imports (qoq) | — | 0.5% | — |
| Private Consumption (qoq) | — | 0.3% | — |
| Business Investment (qoq) | — | 0.3% | — |
(RBA) Minutes of the Monetary Policy Meeting of the Reserve Bank Board
Sydney – 4 and 5 May 2026
Members present
Michele Bullock (Governor and Chair), Andrew Hauser (Deputy Governor and Deputy Chair), Marnie Baker AM, Renée Fry-McKibbin, Ian Harper AO, Carolyn Hewson AO, Bruce Preston, Iain Ross AO, Jenny Wilkinson PSM
Others participating
Sarah Hunter (Assistant Governor, Economic), Christopher Kent (Assistant Governor, Financial Markets)
Anthony Dickman (Secretary), David Norman (Deputy Secretary)
Meredith Beechey Osterholm (Head, Monetary Policy Strategy), Sally Cray (Chief Communications Officer), David Jacobs (Head, Domestic Markets Department), Michael Plumb (Head, Economic Analysis Department), Penelope Smith (Head, International Department)
Michelle Lewis (Senior Manager, International Department) for discussion of the framework for additional monetary policy tools
Financial conditions
Members commenced their deliberations by discussing the impact of the conflict in the Middle East on global financial conditions. While riskier asset prices had moved in response to the conflict and the resultant increases in oil prices, the net change since the onset of the conflict had been modest. Global equity prices had rebounded from an initial decline, supported by the announcement of a ceasefire and material upgrades to forecast earnings in some sectors, including semiconductors. Corporate bond spreads in advanced economies had retraced the rise observed immediately after the onset of the conflict and remained low relative to history. Measures of expected equity price volatility had increased somewhat but remained well below the levels recorded during earlier episodes of heightened uncertainty, including the announcement of higher US tariffs in April 2025.
Members discussed the possibility that financial markets were under-pricing downside risks associated with the conflict, given the contrast between these moves and sharp declines in consumer and business confidence in many jurisdictions. They noted several possible explanations for this contrast, including: a possible expectation among market participants that the conflict would be resolved reasonably quickly; the demonstrated resilience of the global economy in preceding years to a range of significant shocks; the long-run decline in the oil intensity of global output (which is currently around half the level of the early 1990s); and ongoing optimism about the impact of the AI boom on corporate earnings in future.
The impact of the conflict on interest rate expectations had been much larger. Market-implied paths for policy rates in advanced economies had shifted materially higher. The extent of the increase in market expectations for policy rates at the end of 2026 was broadly comparable across several advanced economies, at around 50–60 basis points (though larger in the United Kingdom and smaller in Japan). Market participants now expected most advanced economy central banks to increase policy rates a few times in 2026, except for the US Federal Reserve – which market participants had previously expected would reduce its policy rate by around 60 basis points but was now expected to leave its policy rate unchanged. None of the central banks that were expected to increase policy rates had yet done so. Members noted that, in contrast to Australia, several of these economies had negative output gaps, which provided greater space for their central banks to assess the implications of the uncertainty regarding the medium- to long-term economic effects of the conflict in the Middle East.
Government bond yields had also increased, particularly at longer maturities. These increases were largely driven by higher real yields: longer term inflation expectations had not risen noticeably across advanced economies, despite the increase in measures of near-term inflation expectations. Members observed that this evolution in market measures of inflation expectations had been consistent with expectations that central banks would take the policy decisions necessary to maintain inflation at target in the longer term. The rise in bond yields over the preceding six months had been more pronounced in Australia than elsewhere, consistent with the progressive increase in expectations for the future policy rate over that period. The Australian dollar exchange rate had also appreciated on a trade-weighted basis. It remained broadly consistent with estimates of its long-run equilibrium level, as the appreciation had been supported by a widening in yield differentials and higher commodity prices.
Members noted that banks had largely passed on the February and March cash rate increases to advertised lending and deposit rates. Taken together with other developments, this meant financial conditions in Australia had tightened over the course of the year.
Members then considered whether the prevailing cash rate was now restrictive.
One approach to this question is to compare the current cash rate with model-based estimates of the nominal neutral interest rate. The cash rate at the time of the meeting sat within – but near the top of – the range of model-based central estimates of the neutral cash rate. Market pricing implied that it would be slightly above current estimates by the end of 2026. Members noted that these estimates of neutral had generally risen over the preceding year, possibly reflecting some combination of how the models interpret the rise in domestic inflation over prior months and global trends associated with very strong AI and green energy investment and rising budget deficits. Whatever the cause, members noted that model-based measures implied that any given cash rate was, at the time of the meeting, somewhat less restrictive than a year or so earlier. Assessments of the nominal neutral interest rate are, however, sensitive to both the measure of inflation expectations chosen to inflate estimates of the real rate and the extent to which such measures move. Members reiterated that these and other uncertainties mean model-based estimates of the neutral rate are inherently uncertain and do not provide a direct guide to the appropriate stance of monetary policy.
In light of that conclusion, members considered a broader suite of indicators of the restrictiveness of financial conditions. Funding had remained readily available for Australian banks, households and businesses in preceding weeks. Aggregate credit growth had been strong and had not yet slowed in response to the tightening in policy or the conflict in the Middle East, though it was probably too early to expect much response. Within this total, business credit growth had remained particularly strong, while household credit had continued to grow more quickly than household disposable income. Bond issuance had rebounded after a pause during the initial phases of the conflict and credit spreads remained relatively low. These observations led members to conclude that it remained unclear how restrictive financial conditions were at the time of the meeting.
Members discussed the timeframe in which monetary policy affects different aspects of financial conditions, noting that the full effects of the policy tightening in February and March would take time to flow through the economy. The most immediate effects could be seen in the established housing market, where conditions had already softened, but these effects would take some time to influence the demand for credit. Increases in scheduled mortgage payments also tend to take a few months to affect actual mortgage payments given required notice periods for increasing minimum repayments and the timing of borrowers’ repayment cycles.
Turning to expectations for the Board’s policy decision, financial markets were ascribing around a 75 per cent chance of an increase in the cash rate target at this meeting; an increase was also widely expected by market economists. Current market pricing implied a total increase in the cash rate of 60 basis points above its current level by the end of 2026.
Economic conditions
Members began their discussion of economic conditions by considering the state of the economy prior to the onset of the conflict in the Middle East.
Growth in Australia’s major trading partners had been stronger than expected in late 2025. Members noted the powerful boost to many east Asian economies from the surge in AI-related investment as much of the electrical componentry for AI systems is manufactured in Asia. This impetus to growth had been a major reason why global growth had been more resilient to trade policy developments in 2025 than had been anticipated.
Members observed that domestic economic conditions had evolved broadly in line with the February forecasts and that recent data had confirmed that capacity and inflationary pressures were elevated early in the year. Underlying inflation had remained high in the March quarter, though marginally lower than forecast in February. The slightly lower-than-expected result partly reflected outcomes for expenditure categories that tend to be volatile; inflation in categories that provide more insight into domestic capacity pressures (such as market services) had been close to expectations. Most indicators of the labour market had been little changed since the March meeting and had affirmed the staff’s judgement that aggregate conditions were still a little tight relative to full employment. However, a few indicators had softened slightly, including liaison measures of firms’ hiring intentions. Members also discussed data pointing to consumption growth having a little less momentum at the start of 2026 than had been anticipated.
Discussion then turned to the economic effects of the conflict in the Middle East.
Energy production and shipping in the region had been severely disrupted, driving sharp increases in the global prices of oil, liquefied natural gas (LNG) and other key commodities such as thermal coal and some fertilisers. These disruptions were estimated to have reduced the global supply of oil by around 10 per cent and LNG by around 20 per cent. Even so, the real price of oil was still well below the levels it had reached on several prior occasions, including following Russia’s invasion of Ukraine.
The rise in fuel prices had already had an impact on inflation and short-run inflation expectations in Australia. Monthly headline inflation had increased significantly in March, to be 4.6 per cent in year-ended terms; higher fuel prices had contributed 0.8 percentage points to this total. The temporary reduction in fuel excise duty from 1 April was expected to have subtracted around 0.5 percentage points from year-ended inflation in April.
Members noted that increases in fuel costs would be likely to be passed through to the prices of other goods and services over time. Many consumer-facing firms in the RBA’s liaison program were reporting that they had not yet passed through higher costs to their prices, but an increasing share was expecting above-average price increases over the coming year. This was consistent with the observed increase in measures of short-run inflation expectations. It was also consistent with staff analysis showing that pass-through of cost increases to final prices tends to be faster and larger when inflationary pressures are already high or have been high in the recent past. Measures of long-run inflation expectations remained consistent with the inflation target, although members discussed the ways in which this could change.
There was little evidence that overall economic activity in Australia had yet been affected significantly by the conflict in the Middle East. However, survey measures of consumer and business confidence had fallen sharply since the onset of the conflict, despite a partial recovery. Members discussed the extent to which this might indicate a materially weaker outlook for activity. They noted that sentiment was typically only weakly correlated with actual spending and that past research had found only limited evidence of sentiment being an independent driver of consumption. Members raised the possibility that particularly large changes in sentiment might have more significant implications if they persist. However, recent survey and liaison evidence were not yet suggesting a material decline in business conditions, and timely card-spending data, while volatile, did not yet show a material slowing in household consumption. Nominal spending at petrol stations had increased sharply but there did not yet appear to be an offsetting decline in other types of spending. That was consistent with the fact that the increases in fuel prices so far implied a relatively limited impost on household budgets on average, though the increases would be quite significant for some households.
Economic outlook
Members turned to the economic outlook. Given the heightened uncertainty around the duration, severity and effects of the conflict in the Middle East, the staff had prepared two adverse scenarios to complement the baseline forecasts.
The staff’s baseline forecasts were conditioned on two key assumptions, both derived from financial market pricing on 29 April: first, that the cash rate would increase by a further 60 basis points in 2026; and second, that a resolution of the conflict would allow oil prices to recede gradually over subsequent quarters (albeit to a level well above that prevailing before the onset of the conflict).
Under these assumptions, forecast growth in Australia’s trading partners was little changed, as the drag from global energy supply disruptions was largely offset by the ongoing boost from AI-related investment (particularly for high-income east Asian economies). Domestically, GDP growth was forecast to slow materially over the forecast period and be below estimates of potential growth (and below the forecast in February). Members noted that this forecast slowing reflected the combined effect of weaker growth in consumption, as higher energy prices squeeze household incomes, and the assumed tightening of monetary policy. The slowing in GDP growth was expected to result in the unemployment rate rising by more than expected in the February forecasts, to 4.7 per cent by mid-2028. The staff assessed that this would leave the labour market with a little spare capacity by the end of the forecast period.
Headline inflation was forecast to peak at 4.8 per cent in the June quarter. The baseline forecast was for it then to ease back to target by mid-2027. However, underlying (trimmed mean) inflation was expected to remain above 3 per cent at that time and return to 2½ per cent only in mid-2028. The projections for underlying inflation assumed that fuel-related cost increases were passed through to other consumer prices over time but that gradually easing capacity pressures (because of tighter monetary policy) would progressively reduce inflationary pressures.
Members noted that, while output growth fell well below estimated potential growth in the baseline forecast as the conflict in the Middle East and higher oil prices bore down on real incomes, it nevertheless remained positive (troughing at 1.3 per cent in six to 12 months’ time). They acknowledged several reasons why the impact of the conflict might be somewhat cushioned, including: the shock to energy prices in the baseline forecasts was assumed to be partly temporary; the oil intensity of production in Australia had declined over prior decades; trading partner growth would be materially supported by AI-related investment; Australia’s national income would benefit from higher export prices for LNG and thermal coal; and the relatively healthy state of household balance sheets in Australia would permit many households to smooth their consumption by drawing on savings, if desired.
However, there was considerable uncertainty around the possible impact of the conflict on output growth, particularly given the sharp falls in sentiment. In light of this heightened uncertainty, members also considered the two adverse scenarios prepared by the staff, in which a longer lasting conflict in the Middle East results in more significant disruption to global energy supply. The increase in energy prices in these scenarios is considerably higher and more persistent than in the baseline forecasts. In both scenarios, this results in the projection for inflation being higher over the year ahead than in the baseline forecasts. In the first scenario, underlying inflation remains higher than in the baseline forecasts for the entire projection. However, in the second scenario, underlying inflation moves lower than in the baseline forecasts by 2028, reflecting an assumption in this scenario that a prolonged conflict could also be associated with an additional deterioration in global and domestic confidence. That additional adverse effect on confidence is assumed to flow into materially weaker demand and a more significant easing in capacity pressures in Australia than in the baseline forecasts. Members noted that neither scenario includes long-lasting reductions in potential supply in the Australian economy; if these were to occur, the conclusions would alter.
Considerations for monetary policy
Turning to considerations for the monetary policy decision, members noted that inflation had been well above target in the months prior to the onset of the conflict in the Middle East, reflecting capacity pressures in the economy and a range of temporary factors. The labour market was still assessed as being a little tight. The data received since the previous meeting had been broadly in line with the near-term outlook considered in February and did not materially alter the assessment of the economy prior to the conflict.
The conflict had, however, resulted in a pronounced effect on the economic outlook. Headline inflation had risen materially in the month of March, because of sharply higher fuel prices, and was expected to rise further in the June quarter. The staff’s baseline forecast was for underlying inflation over the subsequent two years to be higher than previously expected, remaining above 3 per cent until late 2027. Conditional on various assumptions, underlying inflation was projected to return to 2½ per cent only in mid-2028.
At the same time, the conflict in the Middle East and associated rise in fuel prices had contributed to a sharp decline in consumer confidence, consistent with a higher cost of living. And financial conditions had tightened since the start of the year, given the Board’s decisions to raise the cash rate target in both February and March and a resulting appreciation in the exchange rate. Risk premia in financial markets had, however, remained low despite the heightened global economic and political uncertainty.
In light of these observations, members considered whether to raise the cash rate target by 25 basis points at this meeting or to leave it unchanged.
The case to raise the cash rate target by 25 basis points at this meeting centred on the outlook for inflation. Members noted the staff’s assessment that capacity pressures remain tight and financial conditions may not be sufficiently restrictive to return inflation sustainably to target if the cash rate was held at its present level. Against that backdrop, an increase in the cash rate could provide greater confidence that underlying inflation would return to 2½ per cent within the forecast period.
Members observed that the case to raise the cash rate target would be strengthened if they formed the view that the risks surrounding the outlook for inflation lay to the upside. One reason to form that view was if members placed reasonable weight on the prospect of a prolonged conflict in the Middle East and judged that the potential impact on aggregate demand from that scenario would be insufficient to overwhelm the inflationary impetus it would impart. Members agreed that monetary policy could not prevent a near-term increase in the price level as higher fuel prices worked their way through to final prices. However, monetary policy could limit the risk that this cost shock resulted in a broader and sustained lift in inflationary pressure, by bringing aggregate demand into closer alignment with aggregate supply and ensuring medium- to longer term inflation expectations remained anchored. In considering that judgement, members acknowledged the information from liaison that some firms were actively considering whether to raise prices and that some expected workers would begin to seek higher nominal wages.
Members also observed that their judgement about whether medium- and long-term inflation expectations were at risk of becoming de-anchored was a consideration in the case to raise the cash rate target. They discussed the risk of longer term inflation expectations rising, and acknowledged that the prolonged period over which underlying inflation had been above 3 per cent may add to the risk that longer term expectations could become de-anchored.
Finally, members considered how an increase in the cash rate target to contain inflation might also balance the risks to the Board’s employment objective. They agreed that the conflict in the Middle East was likely to see economic activity and labour demand soften somewhat, worsening the short-term trade-off between the Board’s inflation and employment objectives. The questions were how large this softening would be and what would be required to bring inflation back to target in a timely way.
The case to keep the cash rate unchanged at this meeting centred on different judgements about the extent of capacity pressure and how restrictive financial conditions were, how a prolonged conflict in the Middle East would affect the Board’s objectives and the extent to which longer term inflation expectations remained anchored.
Members noted that it would be appropriate to keep the cash rate target unchanged if they assessed that capacity pressures were not extensive or that financial conditions were already sufficiently restrictive to return inflation to target should there be a swift resolution of the conflict in the Middle East. Members observed that the forecasts prepared in February, prior to the onset of the conflict, saw inflation declining to just above the mid-point of the target range on a conditioning assumption of a little more than two increases in the cash rate in 2026. They noted that the Board had already raised the cash rate target twice this year, and considered it was therefore possible that financial conditions were already close to being sufficiently restrictive to address the excess demand prevailing before the onset of the conflict. This view might be supported by a judgement that the data received since the February meeting had indicated either less excess demand or less strength in the economy than previously assessed, or at least alleviated earlier concerns that the labour market may be tightening.
An additional, or alternative, argument for leaving the cash rate target unchanged at this meeting would be if members judged that the impact on aggregate demand of a prolonged conflict in the Middle East would be sufficient to outweigh the inflationary impetus it would impart. Members noted that this view could be strengthened if the sharp falls in consumer and business sentiment proved to be indicative of future spending, to the extent that those households with relatively strong balance sheets prove reticent to use them to sustain their spending. In light of this considerable uncertainty about the potential effects of the conflict, and given monetary policy had already been tightened twice in 2026, waiting for a clearer assessment of how the conflict might affect economic activity could be an appropriate course of action. Members noted that several other central banks had chosen to hold their policy rates unchanged pending greater clarity on the likely effects of the conflict.
Finally, members noted that the case to leave the cash rate target unchanged at this meeting would be strengthened if they formed the view that medium- and long-term inflation expectations would remain well anchored even if policy were not tightened. They noted that evidence for this view could come from inflation expectations having remained well anchored earlier in the decade, even as inflation reached almost 8 per cent (though monetary policy was being tightened at that time).
Having considered these various arguments, most members judged that the case to raise the cash rate target by 25 basis points at this meeting was the stronger one. They emphasised that underlying inflation was projected to be above target for an extended period across a range of scenarios for how the conflict in the Middle East might develop. Given this outlook, these members determined that the risks to achieving the Board’s inflation objective had risen and judged that they were not confident that, at 4.1 per cent, the cash rate would be sufficient to mitigate these risks.
Most members also judged that an increase in the cash rate target at this meeting would best balance the Board’s two objectives, accepting that the shorter term trade-off between these had worsened. For these members, while capacity pressures in product and labour markets were likely to ease over the forecast period, some additional loosening was appropriate to respond to the more adverse outlook for inflation. They noted that if demand were to slow by more than expected, it would see a more rapid return of inflation to target than projected by the staff; on the other hand, if the cash rate target were left unchanged and the economy proved to be stronger than forecast, it would extend the already long period over which inflation had been above target.
By contrast, one member placed more weight on the arguments for leaving the cash rate target unchanged, judging that capacity pressures prevailing before the conflict were somewhat less than the staff had assessed. This member also assessed the risk of a prolonged conflict that weighed more heavily on demand to be higher. Taken together, this led the member to expect inflation to be likely to return to target in an appropriate timeframe without additional tightening of monetary policy. Finally, the member in the minority judged that there was not yet sufficient evidence to be concerned about longer term inflation expectations becoming less anchored, particularly in view of the Board’s commitment to its inflation objective having been demonstrated by the 50 basis points of tightening already delivered this year. On the basis of these considerations, the member judged that holding the cash rate target unchanged, while awaiting additional evidence on how the Australian economy would respond to the conflict, would best balance the risks to the Board’s two objectives. The member noted that this approach was consistent with that adopted by other central banks.
Having decided by majority to raise the cash rate target by 25 basis points, members considered what their deliberations implied for upcoming decisions. Members judged that, while it was still uncertain, financial conditions would probably be somewhat restrictive after this decision. They therefore agreed that the decision would give the Board space to see how the conflict in the Middle East develops and Australian households and businesses respond. They also agreed that any assessment of how the incoming data could change the outlook should acknowledge that monetary policy could not alter the near-term trajectory of inflation and, additionally, that output growth would likely be lower than potential growth for some time.
In finalising its statement, the Board agreed to remain attentive to the data and the evolving assessment of the outlook and risks when making its decisions. The Board will remain focused on its mandate to deliver price stability and full employment and will do what it considers necessary to achieve that outcome.
The decision
The Board resolved by majority to raise the cash rate target to 4.35 per cent. Eight members voted in favour; one member voted to leave the cash rate target unchanged at 4.10 per cent.
Framework for additional monetary policy tools
Members discussed the framework for additional monetary policy tools being developed in response to Recommendation 3.3 of the Review of the Reserve Bank of Australia. The aim of the framework is to bolster the RBA’s readiness for conducting monetary policy if interest rates fall to very low levels again. The framework builds on a range of inputs, including work discussed by the Reserve Bank Board in 2019 on unconventional monetary policy, past research, insights from peer central banks and external expertise. Members noted that the framework comprises three parts: principles outlining the Board’s intended approach to the design and potential use of additional tools; a decision-making process to identify the key judgements and decisions the Board would likely need to make; and a suite of potential tools with practical guidance about how each might align with the stipulated principles, including in terms of risk and governance.
Members agreed that the proposed framework covers the right matters and would equip the Board well if additional monetary policy tools were needed. They commended the extensive review and challenge process adopted to develop the framework, including close engagement with external experts. Members agreed to seek feedback on the governance and risk aspects of the framework from the Governance Board at its next meeting prior to granting their formal approval. They supported publication of the framework in due course.
Trump Cancels Planned Attacks on Iran, Stocks Rally: Market Reactions
Markets were aggressively pricing in a violent restart of hostilities between the United States and Iran following this morning's firm rejection of the latest Iranian diplomatic proposal.
However, the geopolitical landscape just experienced a significant shift: President Trump has officially called off the planned offensives, signalling a pivot toward a more strategic, diplomatic approach.
According to the president’s own Truth Social post, Trump was scheduled to meet with his war cabinet tomorrow to discuss the next immediate military strike. Instead, he announced that he is halting the planned attack on Iran at the direct request of the Crown Prince of Saudi Arabia and the President of the UAE.
The regional leaders urged the US to hold off on military action, citing that serious, high-level negotiations are currently taking place behind the scenes.

Trump's Truth Social post. May 18, 2026.
This sudden de-escalation is sparking a huge relief rebound across global financial markets. After a notably rough start to the trading week, heavily clouded by the latest Iran proposition rejection and the Warsh trade/Federal Reserve repricing, investor sentiment is rapidly bouncing back.
US stock benchmarks are aggressively catching a bid, reversing earlier intraday losses as the removal of immediate military tail risks allows buyers to confidently step back into the fold. On the other hand, oil, which quickly rebounded above the $100 mark, is now seeing some heavier selling flows.
While structural macroeconomic concerns remain, the diplomatic news provides a sweet safety net that market bulls desperately needed to regain their footing.
Let’s dive into a few key charts to see how the latest news affected markets.
Stock Markets Bounce Significantly
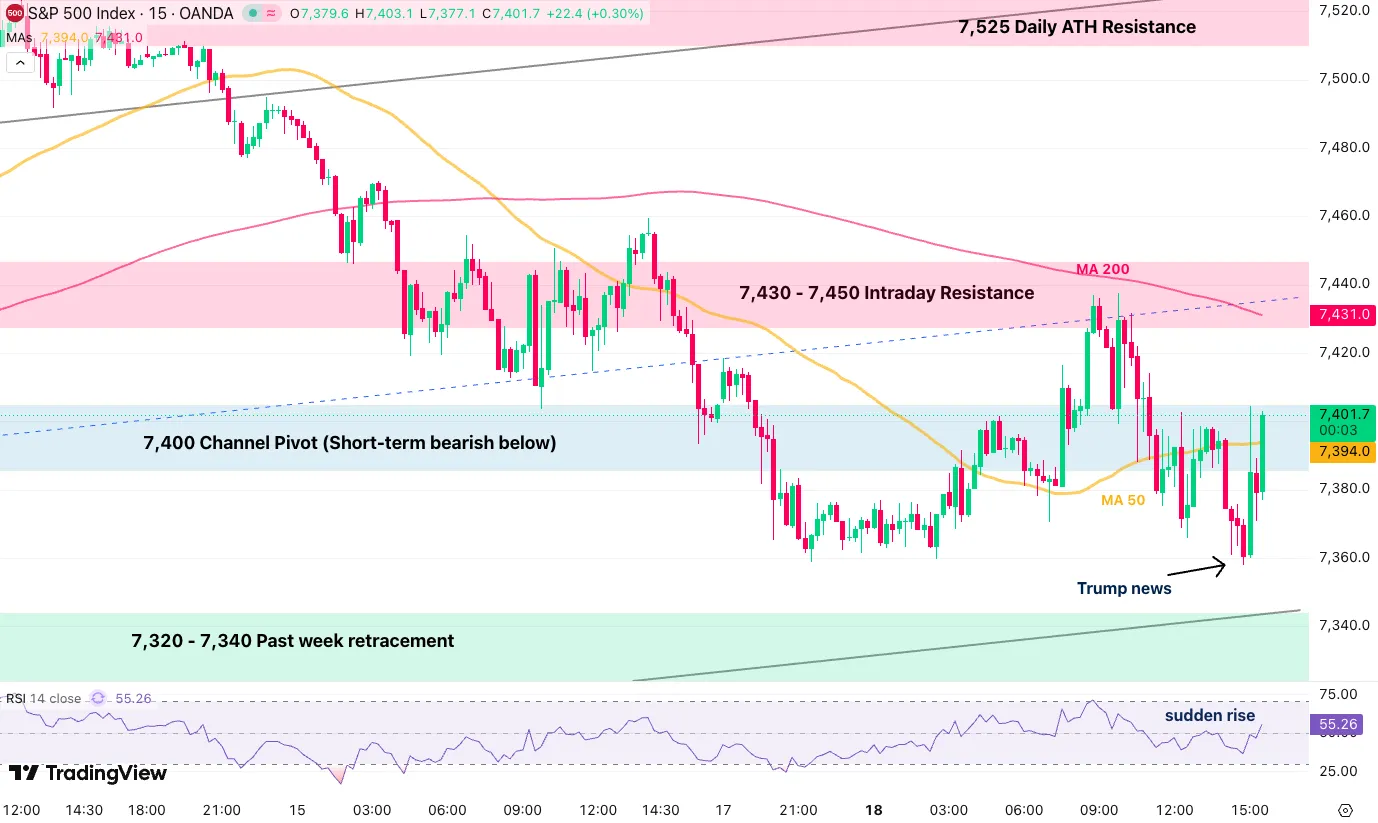
S&P 500 CFD 15M chart. Source: TradingView, May 18, 2026, 15:45.
The S&P 500 erased most of its daily losses, retesting the 7,400 level only a few hours after breaking it to the downside.
Energy Markets
WTI US oil prices exploded to new highs, close to $110 in CFD prices, this morning but are now back below the 15M 50-period MA on strong selling momentum.
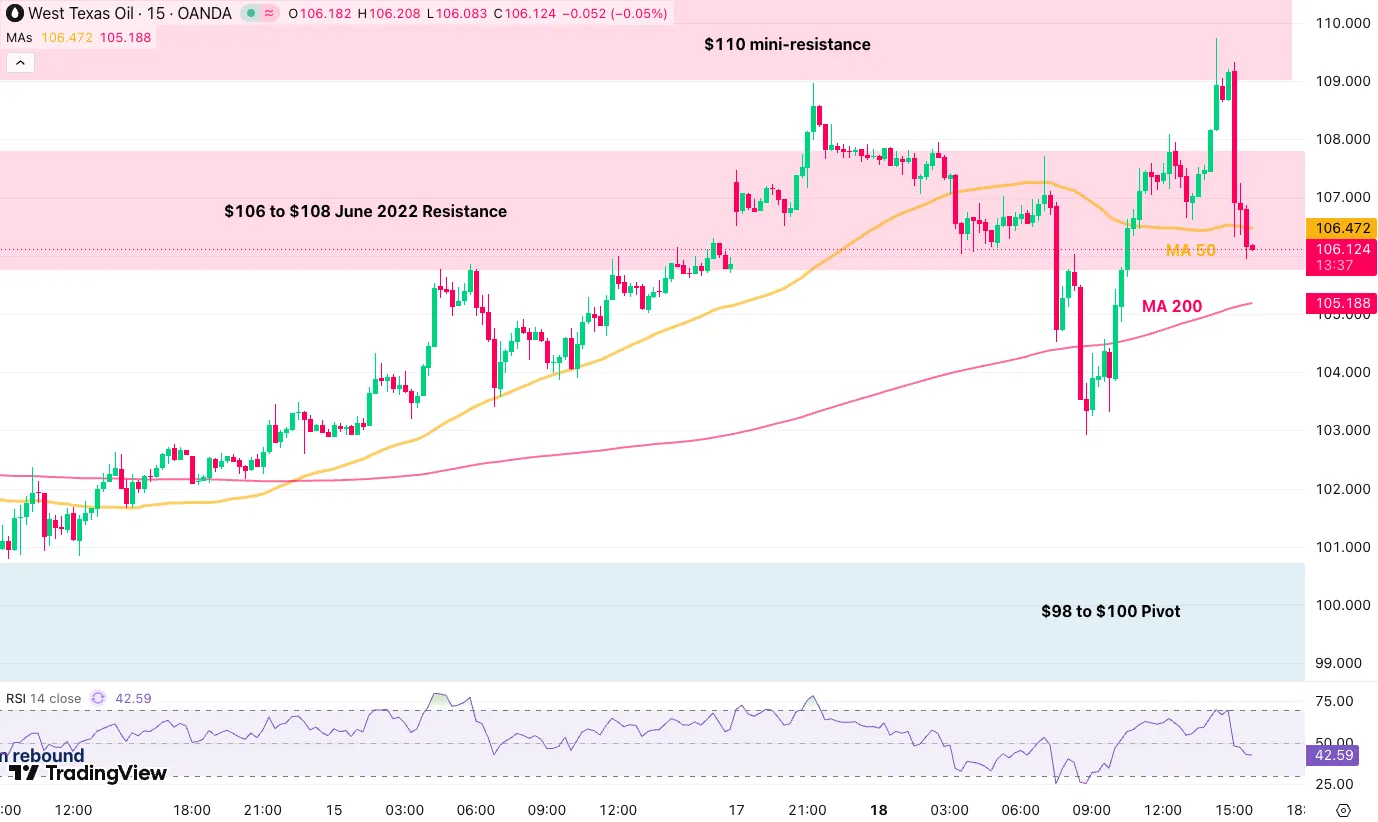
WTI US Oil CFD 15M chart. Source: TradingView, May 18, 2026.
WTI Technical Levels:
Resistance Levels
- 15M 50-period MA 106.47
- $106 to $108 June 2022 resistance, rejecting
- $110 mini-resistance
- 2022 and Monday highs $117 to $120, larger channel top
Support Levels
- $105 15M 200-period MA
- $98 to $100 pivot
- Momentum support $93 to $95
- $90 psychological level and past session's lows
- $87 to $90 mini-support
- $82 Friday 17 lows
- 2025 highs key support $78 to $80
Metals Markets
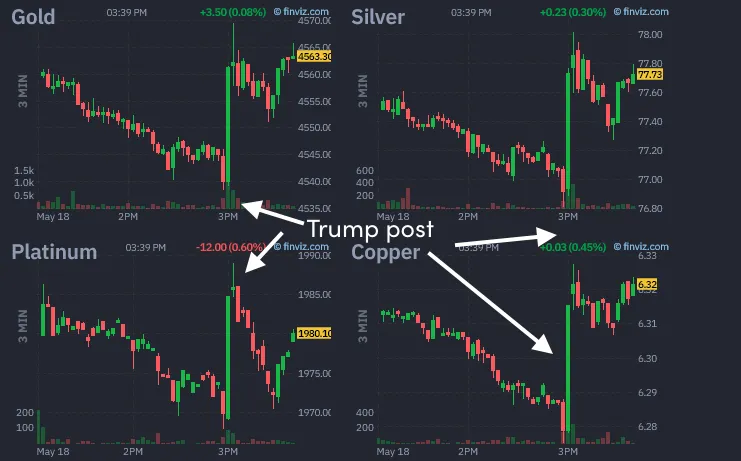
Metal futures intraday charts. Source: Finviz, May 18, 2026.
Metals are somewhat bouncing higher again from the better market narratives, with Copper and Silver leading the way to the upside.
The reaction is still quite contained for now.
US Dollar
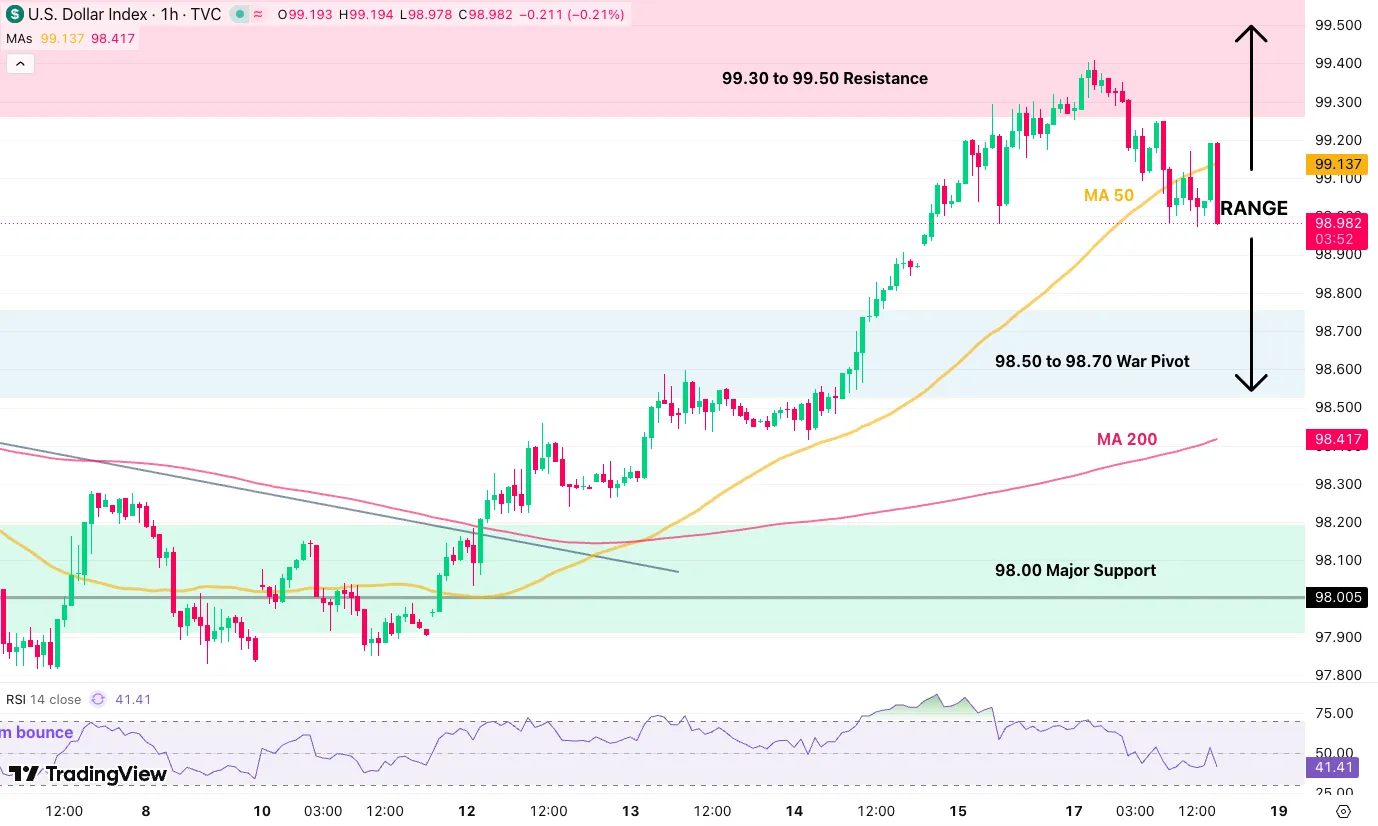
Dollar Index, DXY, 1H chart. Source: TradingView, May 18, 2026.
The US Dollar is seeing heavy rejection, failing to hold above its 50-hour MA and instantly tumbling back below 99.00.
Safe trades and keep track of the latest headlines.