
Sample Category Title
EUR/CAD Struggles for Direction as Oil Volatility and ECB Divisions Offset Each Other
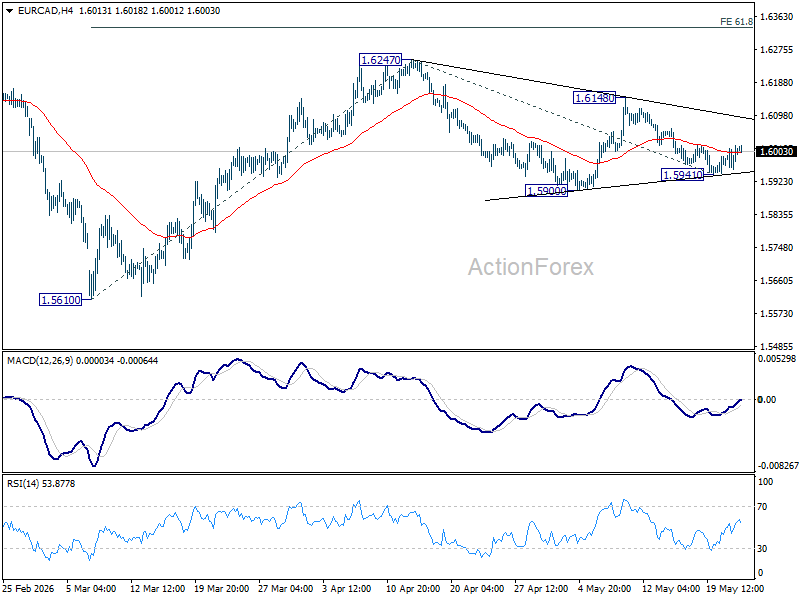
EUR/CAD has remained trapped in a broad sideways range after rebounding to 1.6247 in early April, with neither Euro nor Canadian Dollar able to establish a convincing directional advantage. The pair’s hesitation reflects a market caught between fading oil-driven momentum on the CAD side and uncertainty over how aggressively ECB will tighten policy through the summer.
For Canadian Dollar, oil prices continue generating short-term volatility without creating a sustained trend. Following the sharp Iran-war-driven spike in March, crude markets have largely settled into volatile range trading as investors balance risks of escalation against ongoing diplomatic efforts. With no decisive geopolitical breakthrough or renewed supply shock emerging, CAD’s sensitivity to oil swings appears to be fading gradually.
Meanwhile, Bank of Canada has little appetite to tighten, in particular after weak April employment data reinforced concerns about slowing domestic momentum. Elevated oil prices may support Canada’s export sector, but they are also intensifying inflation pressures and weighing on consumers, leaving policymakers firmly biased toward holding rates steady for the foreseeable future.
On the Euro side, the key uncertainty remains the depth and duration of any ECB tightening cycle. Hawks including Bundesbank President Joachim Nagel, Slovakia’s Peter Kažimír, and Austria’s Robert Holzmann advocate a June rate hike and have kept the door open for further tightening to prevent second-round inflation effects from oil prices. More pragmatic policymakers such as Chief Economist Philip Lane and Latvia’s Mārtiņš Kazāks support tightening as well but remain highly sensitive to weakening PMI and growth data. Meanwhile, cautious centrists including President Christine Lagarde and Lithuania’s Gediminas Šimkus have warned against damaging the Eurozone’s already fragile recovery with excessive tightening.
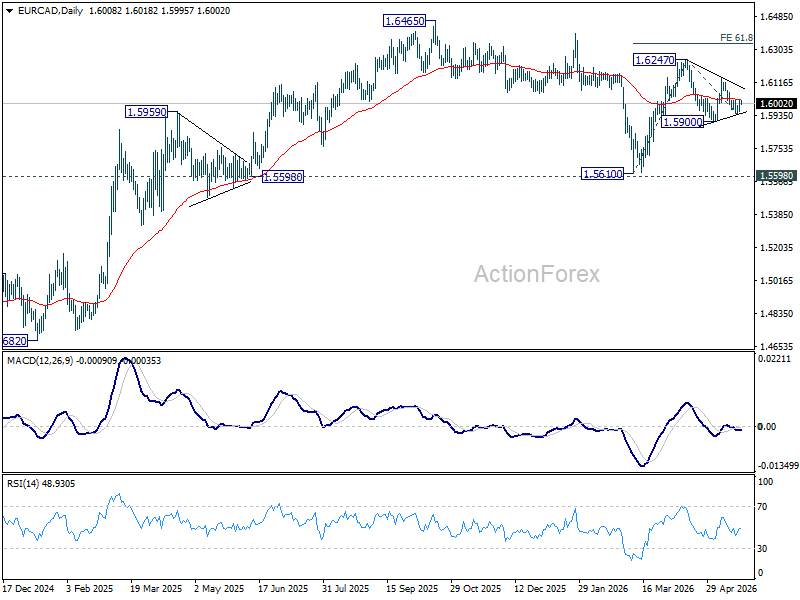
Therefore, even if the ECB does hike in June, they are likely to sound entirely non-committal about July, opting to wait for the September economic projections before making another move. Without a persistent tightening cycle, EUR/CAD might briefly rise through 1.6247, but it lacks the structural backing to break through the 1.6465 high from October 2025.
Technically, EUR/CAD remains neutral near term. A break below 1.5941 would likely extend the corrective decline from 1.6247 through 1.5900 support. On the upside, firm break of 1.6148 would suggest the rebound from 1.5610 is resuming and reopen the path through 1.6247 to 61.8% projection of 1.5610 to 1.6427 from 1.5941 at 1.6335.
USD/CAD Bulls Regain Traction, Targeting 200-Day SMA Near 1.3800
- USD/CAD extends upside – breaks back above rising trendline.
- Momentum signals stay moderately supportive .
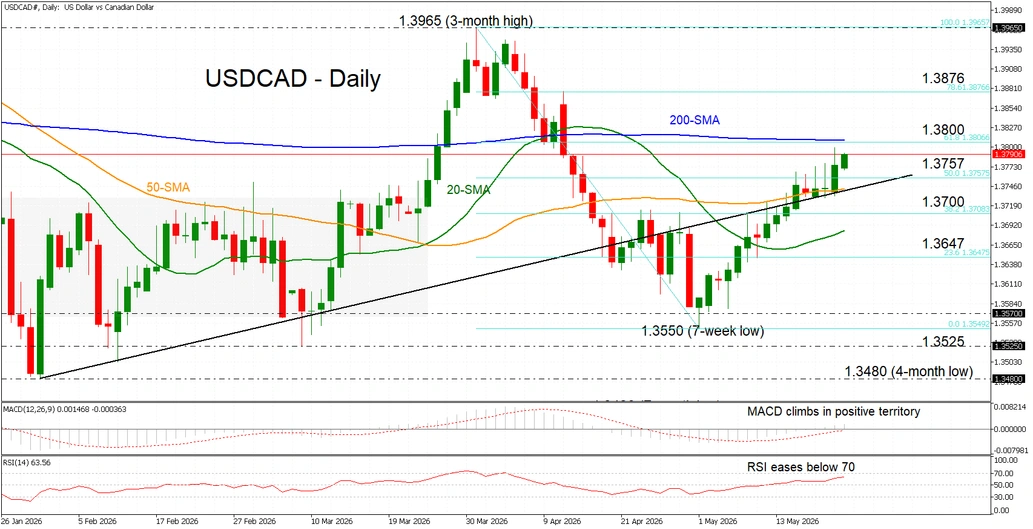
USD/CAD is gaining for a fourth consecutive session, trading near 1.3785. The pair has broken back above its short-term uptrend line and retraced more than half of its recent pullback from multi-month highs to a seven-week low. The CAD remains pressured, with lower oil prices weighing amid US-Iran peace expectations.
Momentum indicators support the near-term bullish outlook, albeit cautiously. The MACD is advancing in positive territory, while the RSI trends higher but shows signs of easing, suggesting buyers maintain control, though upside momentum is not yet fully convincing.
Immediate resistance lies at the 200-day SMA, aligning with the 61.8% Fibonacci retracement of the March 31 - May 1 decline, near the key psychological 1.3800 level. A break above this zone would expose the 78.6% Fibonacci at 1.3876, ahead of the three-month peak near 1.3965.
On the downside, initial support is seen at the 50% Fibonacci level around 1.3757, followed by the 50-day SMA tightly below near 1.3740. Further weakness could test the 38.2% Fibonacci near the 1.3700 handle, with stronger support at 1.3647. A move below this level would shift the bias back to bearish, as price would fall below all major SMAs.
In summary, USD/CAD needs to hold above the reclaimed uptrend line to sustain its bullish bias, while a decisive break above the 200-day SMA remains critical for a stronger upside extension.
Australian Dollar Loses Momentum After May Peaks
Fundamental Background
The RBA’s third consecutive interest rate increase to 4.35% reflects the regulator’s concern over rising inflation: the conflict in the Middle East is increasing energy costs and putting upward pressure on prices. Annual consumer inflation stood at 4.6% in March. Analysts at CBA believe this rate hike should be sufficient, with the base-case scenario pointing to rates remaining unchanged until the end of 2026, provided neither the federal budget nor second-quarter inflation data deliver major surprises.
At the same time, the Australian dollar failed to hold near its May highs, as rising demand for safe-haven assets amid global uncertainty weighed on risk-sensitive currencies.
AUD/USD Technical Picture
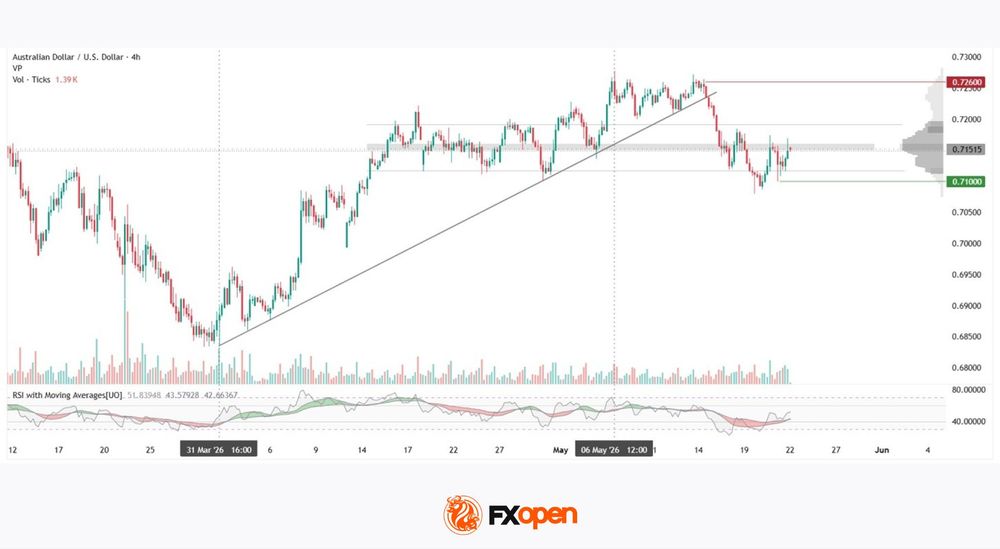
On the 4-hour AUD/USD chart, the upward movement from late March to early May is clearly visible, forming a pronounced trend with a characteristic wave structure. In mid-May, the trend was broken and the price declined towards the 0.7100 area, ultimately forming a green support level. The Point of Control (POC) zone is currently being tested from below, while the horizontal volume profile boundaries cover the 0.7120–0.7190 range — the corridor where the bulk of market activity is concentrated.
The 0.7190 level could act as resistance in the event of recovery attempts within the profile. The red resistance level at 0.7260 — the local May high — may remain an important reference point should the pair test the upper trend levels. The RSI + MAs indicator currently shows readings of 51 / 43 / 42, reflecting the market’s restrained and neutral character.
Key Takeaways
The key driver for the pair remains the balance between expectations for further RBA action and demand for safe-haven assets — for now, both forces continue to compete with one another. The RSI picture offers no clear advantage to either side, while price action remains close to the POC zone within a relatively narrow market profile.
Trade over 50 forex markets 24 hours a day with FXOpen. Take advantage of low commissions, deep liquidity, and spreads from 0.0 pips (additional fees may apply). Open your FXOpen account now or learn more about trading forex with FXOpen.
This article represents the opinion of the Companies operating under the FXOpen brand only. It is not to be construed as an offer, solicitation, or recommendation with respect to products and services provided by the Companies operating under the FXOpen brand, nor is it to be considered financial advice.
Sunset Market Commentary
Markets
EMU and to a lesser extent US PMI’s confirmed the feared-for stagflationary tendencies as the fall-out of the conflict in the Middle East unsettles multiple supply chains and triggers a mutually reinforcing spiral of upward cost translating into higher prices for end users. In the EMU this resulted in prospects/a risk of an outright contraction in activity .S&P sees the 47.5 composite PMI reading as indicating a potential Q2 growth contraction of 0.2%. The sharp decline in the services sector (46.4) couldn’t be compensated for by a (slowing) rise in manufacturing activity (output 51) due to precautionary buying ahead of feared for supply issues and higher prices. Price gauges in the meantime suggest EMU inflation potentially heading toward 4% in the coming months. The picture in the US was less negative than in Europe. Even so, a composite PMI at 51.7 also only suggests modest, decelerating growth. US services moved to sluggish growth (50.9), while an uptick in manufacturing activity (55.3) due to precautionary buying won’t last forever. S&P sees the May PMI’s as evidence of the economy struggling to keep an annualized growth pace of 1% in a context of further rising prices. As is often the case, the direct impact of the indicators on yields was limited. Even so, they continue to illustrate ongoing pressure on central banks to avoid a new 2022. Of course, in the meantime, political headlines on the progress in reaching an agreement in the US-Iran conflict still had the last word in the daily market narrative. Headlines from both sides were some kind tentatively positive (at least some Iran sources mentioned some ‘narrowing of the gap’). Even so, we didn’t see any hard progress on the key topics including the Iran nuclear program. Headlines on Iran and Oman considering a permanent toll for passing the Strait of Hormuz also don’t help. Brent oil price eased marginally ($102.5). US and EMU yields basically stabilized at elevated levels. In a flattening move, US yields changed between + 2.8 bps and -3.1 bp. German yields in a similar move changed between 3 bps and -0.7 bps. EMU and US equities took a wait-and-see stance (S&P 500 +0.17%; Eurostoxx 50 -0.26%). In major FX, low volatility trading continued with DXY holding near 99.25, EUR/USD closing at 1.162 and USD/JPY capped near 159.
Asian markets this morning again give a mixed picture. Regional equity indices show decent gains across the board. At the same time, a (small) rebound in the oil price (Brent $104.75) still suggests underlying caution on the Iran conflict going into the weekend. The eco calendar is modestly interesting. We keep an eye at the ECB negotiated wages indictor and German IFO business confidence, but they are no gamechangers. Interesting to see whether ECB’s Lagarde provides some clarifications on the ECB’s reaction function as she attends a Eurogroup meeting. UK data published this morning show weak April retail (-1.3% M/ and 0.0% Y/Y) and higher than expected April public sector borrowing. At EUR/GBP 0.865, sterling doesn’t show a clear directional reaction.
News & Views
Favourable base effects from last year’s food price spike combined with cheaper school lunches and government subsidies that capped gasoline prices have resulted in lower (than expected) Japanese inflation last month. Headline CPI retreated from 1.5% to 1.4%. Underlying gauges also decelerated from 1.8% to 1.4% (ex. fresh food) and from 2.4% to 1.9% (ex. fresh food and energy). Services inflation eased as well to the first sub 1% reading since December 2022. There’s reason for the central bank to be cautious in interpreting the numbers with so many (policy and technical) variables clouding its meaning. Energy prices following the Iran war are expected to trigger a fresh wave of broader inflation as it ripples through the economy. Meanwhile, some particular rising price pressures are suggesting that momentum remains firm. Inflation in public services for example is accelerating, a sector in which firms are typically wary to pass on higher costs to consumers. Japanese front end yields lose less than 2 bps, be it in a global move rather than reacting on the CPI. USD/JPY is stabilizing near this week’s highs around 159.
British GfK consumer confidence unexpectedly slightly recovered from April’s 2.5 year low of -25 to -23 in May. That’s still well below the long-running average of -11 though. Improving categories included households’ view on personal finances the next 12 months (from -4 to -2) and on the economy the year ahead (from -43 to -38). British consumers consider the climate to do major purchases to have worsened from -18 to -20, a new 1.5 year low. Saving intentions tumbled from post GFC-highs (32) to 22.
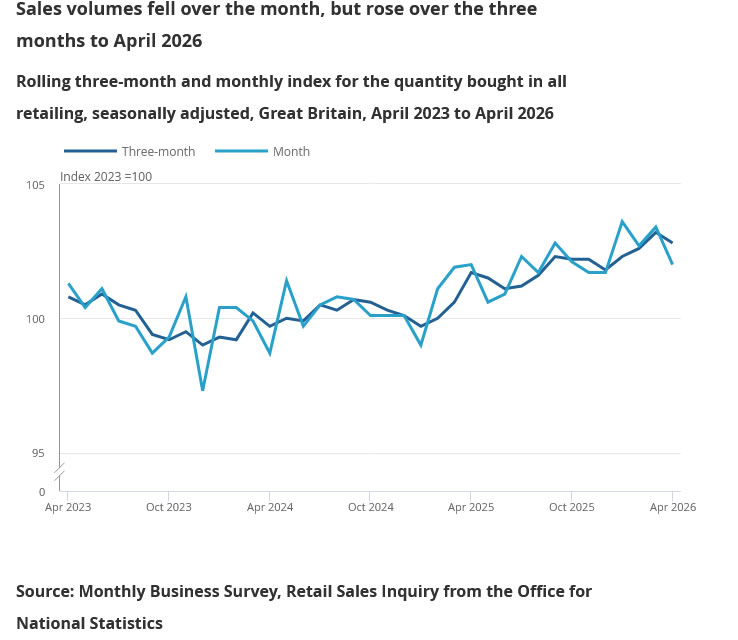
UK Retail Sales Fall -1.3% mom in April as Consumer Demand Weakens
UK retail sales contracted sharply in April, reinforcing signs that household demand is weakening as higher living costs and economic uncertainty continue weighing on consumers. Retail sales volumes fell -1.3% mom, much worse than expectations for a -0.6% decline, reversing part of March’s 0.6% rebound and following February’s -0.8% fall.
The weakness was concentrated in discretionary spending categories. Retail sales excluding automotive fuel fell -0.4% mom, with both clothing and non-store retailers reporting weaker activity. Retailers cited variable weather conditions and softer consumer demand as key drags during the month.
Despite the weak monthly reading, broader trend measures remained somewhat more stable. In the three months to April, retail sales volumes rose 0.5% compared with the prior three-month period and were 1.1% higher than a year earlier.
| Indicator | Latest |
|---|---|
| Retail Sales Volume (mom) | -1.3% |
| Retail Sales ex-Auto Fuel (mom) | -0.4% |
| Retail Sales Volume (yoy) | 0.0% |
| 3-Month vs Previous 3-Months | 0.5% |
| 3-Month vs Year Ago | 1.1% |
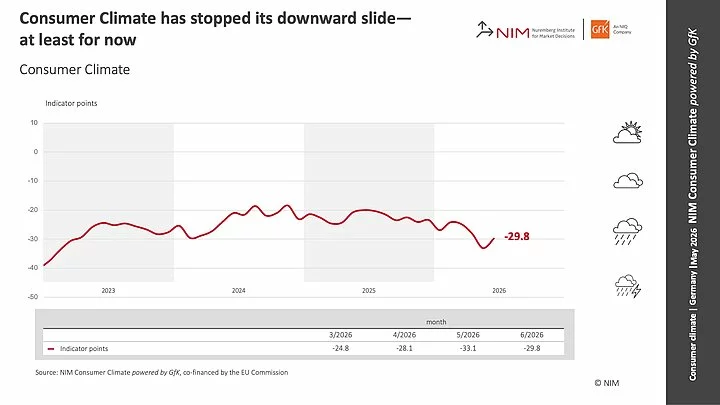
Germany GfK Consumer Climate Improves to -29.8 as Income Outlook Recovers
Germany’s GfK Consumer Climate index improved from -33.1 to -29.8 heading into June, signaling that household sentiment may be stabilizing after months of deterioration, though confidence remains deeply negative overall. The improvement was supported primarily by a stronger income outlook and a modest recovery in spending appetite despite continued uncertainty linked to the Middle East conflict and elevated living costs.
For May, income expectations improved sharply from -24.4 to -13.5, marking the strongest component gain in the latest survey. Economic expectations also edged higher from -13.7 to -11.1, while willingness to buy improved modestly from -14.4 to -13.2. At the same time, willingness to save declined from 16.1 to 13.9, suggesting households may be becoming slightly less defensive after months of rising geopolitical and inflation concerns.
According to Rolf Bürkl, Head of Consumer Climate at NIM, “Consumer Climate has, at least for the moment, ended its downward trend and is recovering somewhat this month.” He noted that improved income expectations, softer saving behavior, and a slight recovery in consumption sentiment were helping support the rebound. However, Bürkl also warned that “the negative impact of the conflict in the Middle East remains largely unchanged,” indicating that geopolitical uncertainty and energy-related inflation pressures continue limiting any stronger recovery in German consumer confidence.
| Indicator | Previous | Latest |
|---|---|---|
| GfK Consumer Climate | -33.1 | -29.8 |
| Economic Expectations | -13.7 | -11.1 |
| Income Expectations | -24.4 | -13.5 |
| Willingness to Buy | -14.4 | -13.2 |
| Willingness to Save | 16.1 | 13.9 |
Diverging PMIs as US Shows Resilience, Euro Area Falters
In focus today
- Today brings the first euro area wage growth data for 2026, with the ECB's negotiated wages indicator for Q1. We expect wage growth to remain at 2.9% y/y, broadly unchanged from Q4, in line with signals from the ECB's wage tracker.
- In Germany, the Ifo indicator for May will be released. It shall be interesting to see if the indicator shows the same weaker picture from yesterday's PMI survey.
- In Sweden, Riksbank vice governor Göran Hjelm speaks at 8.00 CET on monetary policy in an uncertain world. We expect him to repeat his message from the last meeting: the Riksbank should look through supply shocks, given well‑anchored inflation expectations, low inflation and weak demand. The latest 'small' Origo survey showed inflation expectations falling in May, with 2‑year expectations at 1.9% and 5‑year at 2.0%.
Economic and market news
What happened overnight
In the US-Iran war, reports that Iran's Supreme Leader had ordered that near weapons‑grade uranium must remain in the country, directly clashing with a core US and Israeli demand that stocks must be shipped abroad. Reuters, citing sources, said Mojtaba Khamenei had ordered enriched uranium not to be moved, although Al Jazeera's sources later denied this. The tougher nuclear stance initially drove oil up to USD107/bbl, but prices have since eased back to around USD104/bbl after more constructive comments from US Secretary of State Rubio, who noted "some good signs" in the talks. An Iranian source also told Reuters that "gaps have been narrowed", leaving markets with mixed signals on the outlook for the conflict and energy prices.
In Japan, core inflation came in at 1.4% (cons: 1.7%) in April, easing more than expected to its lowest level since March 2022. Mainly driven by subsidies on fuel and education. Although inflationary pressures eased in April, it is likely that they will pick up again before long. While government measures are offsetting some of the price pressures form the energy shock, Bank of Japan policy makers are dropping hawkish comments signalling the chance of an interest rate hike in June.
What happened yesterday
In the euro area, activity softened further in May, with the composite PMI falling to 47.5, (cons: 48.8), signalling contraction. The setback was driven by services, which declined to 46.4, especially reflecting weakness in France. Manufacturing eased only slightly to 51.4, remaining in expansion, supported by firms working through pre-war order backlogs. Price pressures intensified as input costs rose sharply in both sectors, although output prices pointed to no imminent broad-based inflation surge. We still expect the ECB to deliver a 25bp hike in June, but weaker growth makes further tightening slightly less likely.
In the US, business activity stayed solid in May in contrast to the euro area, with the composite PMI unchanged at 51.7 and manufacturing surprising at 55.3. Services growth was steady at 50.9, but new orders and prices rose, while manufacturing input costs hit their highest since mid-2022. Other details were mixed, with flat output, slightly softer new orders and firmer employment. Overall, the report is marginally hawkish on inflation but unlikely to move markets and confirms stronger US resilience.
The European Commission's new forecast points to weaker euro area growth and more persistent inflation. It now sees GDP rising just 0.9% in 2026 (from 1.2%) and HICP inflation at 3.0% in 2026 (from 1.9%), with inflation returning to 2% only in Q3 2027. The update is broadly in line with expectations and sits between the ECB's March baseline and adverse scenarios, where ECB's June projections are also likely to land.
In the UK, business activity weakened notably in May 2026 as political uncertainty and the war in the Middle East weighed heavily on the economy. The flash composite PMI fell to 48.5, a 13‑month low, with services sinking to 47.9, the weakest level since 2021, while manufacturing PMI held up better. Firms report falling output, rising inflation, supply shortages and job cuts, leaving the Bank of England torn between tackling inflation and avoiding a deeper downturn.
In Norway, Norges Bank's Q2 Expectations Survey highlighted ongoing concerns about inflation expectations, which the bank has repeatedly stressed must be re‑anchored. CEOs' 12‑month inflation expectations rose to 4.1% from 3.9%, and expectations among labour market organisations and economists also edged higher on 1‑ and 2‑year horizons. With no market‑based measures available, these survey results, particularly the CEO responses, are a key gauge for Norges Bank's policy assessment.
Equities: Equities moved higher yesterday, with several markets either close to or at new all-time highs. It was a volatile session where macro was clearly the most important story, but Iran headlines created the largest intraday swings and at times overshadowed the underlying macro message. Globally, cyclicals outperformed, but beneath the surface the rotation was highly interesting across regions, sectors and industries.
In Europe, defensives led the market, and despite positive indices and higher rates, banks underperformed. That is a strong signal that the very stagflationary message coming out of the flash PMIs from Europe yesterday leads investors to worry that the ECB may be forced to hike rates for what equity investors would see as exactly the wrong reasons.
This morning, Asian markets are higher. Worth noting is that Japan, rather than the usual South Korea and Taiwan tech complex, is leading the gains. The reason is that gains are driven by a positive macro and reopening hope trade more than a classic tech rotation. We see the same dynamic in European and US futures, which are also pointing higher, led by Europe ahead of the US, and again not led by tech.
FI and FX: Another day of mixed reporting from the US-Iran negotiations kept EUR/USD close to the 1.16 level. While FI markets to a large degree continue to be headline-driven, euro area May PMIs also pushed ECB hike expectations lower, and we still to like our receiver bias in the short end of the EUR swap curve. This morning, we published an updated Yield Outlook. We expect long-end European swap rates to decline over the coming year but see the risk picture as more balanced and thus expect 10-year EUR swap rates to decline to a more limited extent. Our updated Fed call, which implies two rate hikes towards the end of the year, means that we are sharply revising up our expectations for US interest rates across horizons. In Scandi, we believe that long USD/SEK looks increasingly attractive.
Elliott Wave View: Dow Futures (YM) Break Higher Following March 2026 Correction
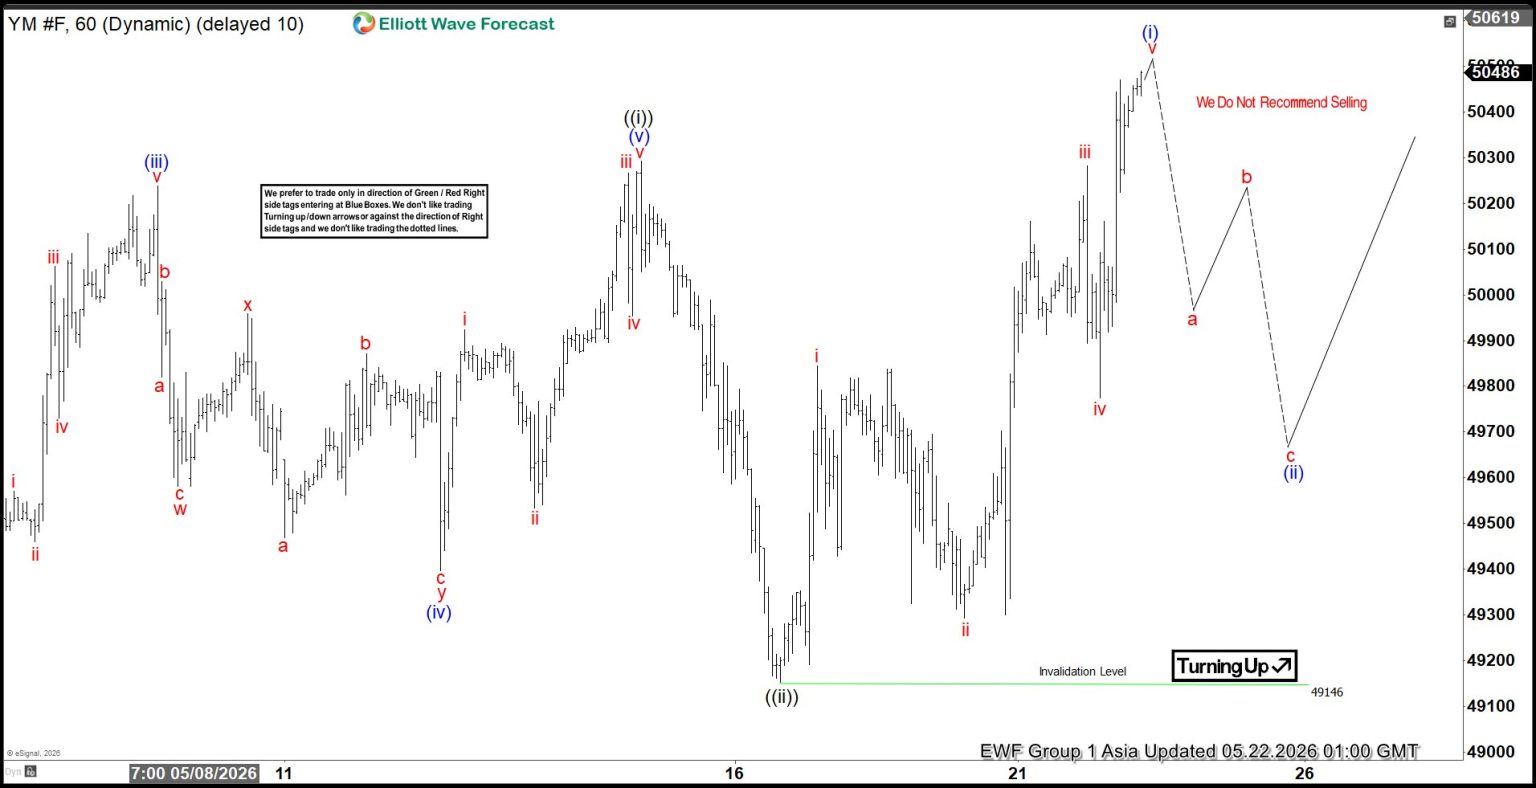
The short‑term Elliott Wave outlook for Dow Futures (YM) indicates that the Index has completed its correction against the cycle from the March 30, 2026 low and has resumed higher. The rally from that low is unfolding as a clear impulse. Within this structure, wave 1 terminated at 50,043, while the subsequent pullback in wave 2 found support at 48,608. From there, the Index extended upward in wave 3, which itself subdivides into another impulsive sequence.
Advancing from wave 2, wave ((i)) concluded at 50,292, as illustrated in the one‑hour chart. The pullback in wave ((ii)) then ended at 49,146, establishing a pivotal low. The Index has since resumed its ascent in wave ((iii)) of 3. From wave ((ii)), the internal wave (i) is expected to complete shortly. Following that, a corrective pullback in wave (ii) should unfold, addressing the cycle from the May 18, 2026 low before the rally resumes. This correction will provide the necessary consolidation for the next upward phase.
In the near term, as long as the pivot at 49,146 remains intact, any pullback should find support. The correction is likely to manifest in a 3, 7, or 11 swing sequence, consistent with Elliott Wave guidelines. The structure remains constructive, and the broader cycle favors continuation higher once the short‑term correction completes.
Dow Futures (YM_F) 60-Minute Elliott Wave Chart
YM_F Elliott Wave Video:
https://www.youtube.com/watch?v=Id3hOrOyUW8
Cliff Notes: Consumers Wonder What’s Next
Key insights from the week that was.
In Australia this week, the Westpac-MI Consumer Sentiment Index clawed back only a quarter of April’s collapse, rising 3.5% to 83.0. This leaves sentiment at a deeply pessimistic level, reminiscent of the scars inflicted by the post-pandemic cost-of-living shock. The halving of fuel excise provided some relief in May, facilitating an improvement in views around family finances – the ‘last 12 months’ and ‘next 12 months’ sub-indices rising 9.0% and 10.7% respectively. However, a third consecutive cash rate increase left 85% of consumers bracing for further increases in mortgage rates over the coming year. Adding in the uncertainty created by the seemingly open-ended Middle East conflict and anxiety over the tax changes proposed in the Budget, it is not surprising views on the economic outlook for one and five years hence sit at a combined three-and-a-half year low.
April’s labour force survey also points to an imminent slowing in economic momentum. Employment fell 18.6k, abruptly halting the uptrend that commenced early this year. The participation rate nudged 0.1ppt lower to 66.7%, but the unemployment rate still rose 0.2ppts to 4.5%, the highest reading since the ‘delta’ COVID-19 outbreak of late-2021. Some of the surprise can be explained by ‘abnormal’ seasonality around Easter and noise in youth outcomes, but genuine weakness is also evident just as the shocks associated with the Middle East conflict and 2026’s rate increases reverberate through the wider economy.
Aware of the volatility of labour data, like us the RBA will probably expect some degree of payback next month. This week’s data will give the RBA cause to pause in June. But we continue to expect them to raise the cash rate in August and September as energy costs are passed through and given their desire to keep inflation expectations anchored. The cash rate is then likely to remain on hold until 2028, when a return to near-target inflation will allow a reversal of this year’s rate hikes.
In the US, the minutes of the April FOMC meeting primarily focused on the outlook for inflation. There was a lengthy discussion of potential upside risks to inflation, with the Middle East conflict’s direct and indirect effect on prices, US tariffs and the strength of AI infrastructure investment all commented on. In contrast, participants were sanguine on the labour market, assessing there to be balance between labour demand and supply and limited downside risks. GDP growth was also expected to be solid this year, the staff forecasting momentum to hold just above trend. On policy, members indicated that, if they see evidence of disinflation being back on track or the labour market weakening, easing could be considered. A “majority of participants highlighted, however, that some policy firming would likely become appropriate if inflation were to continue to run persistently above 2 percent”.
Over in Europe, Euro Area CPI inflation met expectations in April, prices rising 1.0% in the month, lifting annual inflation from 2.6%yr to 3.0%yr. Core inflation was elevated in the month, but remained close to the 2.0%yr medium-term target on an annual basis. Gains were broad-based across the different categories, but transport contributed the most. UK annual CPI inflation meanwhile moderated from 3.3%yr in March to 2.8%yr in April as prices rose 0.7% in the month. The deceleration in inflation came from several discretionary goods categories including clothing and furniture. Core CPI inflation rose 2.5%yr in the month, down from 3.1%yr in March. Comments from Bank of England Governor Bailey noted the monetary policy committee has time to assess the impacts of the war, having already effectively tightened by removing the expectations of a cut set at the start of the year.
Also in the UK, employment rose by 148k over the three months to March while the unemployment rate eased to 5.0% for the same period. While on the surface this may paint a rosy picture, signs of labour market softening are starting to emerge. The unemployment rate for March rose to 5.5% and the number of payrolled employees fell 100k in April. Wages growth excluding volatile bonuses moderated from to 3.4%yr from 3.6%yr previously and, for the private sector only, underlying wage growth is a considerably more modest 3.0%yr.
Turning to Asia, China’s partial indicators for April again highlighted a need for stimulus. Retail sales growth slowed sharply to 0.2%yr in April from 1.7%yr in March, a post-pandemic low, as reduced government subsidies weighed heavily on car and household appliance sales. Fixed asset investment fell 1.6%ytd driven by the private sector. Having improved in recent months, the decline in property investment accelerated again in April to -13.7%ytd. Industrial production growth also slowed from 5.7%yr to 4.1%yr in April, suggesting supply disruptions related to the Middle East are beginning to be felt. This is a risk for the entire Asian region for both activity and inflation, and a particular challenge for policy makers coming at a time of surging strength in tech-related production and investment.
Closing with the Middle East conflict. Iran has said the latest proposal from the US partly bridges the gap between the two sides, but comments from Supreme Leader Khamenei about keeping Tehran’s uranium stockpile and a dispute over tolls in the Strait of Hormuz suggests a deal remains some way off. President Trump also said he opposes efforts by Iran and Oman to establish some form of permanent toll system for the Strait of Hormuz: “We want it open, we want it free, we don’t want tolls”.
Stock Markets Surge on US-Iran Peace Progress and Soft Japan CPI
Key Takeaways
- Global equity markets extended their relief rally as optimism over a potential US-Iran peace agreement boosted risk appetite, triggering strong gains in Asian and US stock indices while crude oil prices continued to retreat.
- Japan’s softer-than-expected April inflation data reduced pressure on the Bank of Japan to tighten monetary policy aggressively, reinforcing Yen weakness and widening the policy divergence versus the hawkish Federal Reserve.
- Cooling bond yields and easing geopolitical tensions provided fresh support for growth and technology stocks, while improving labour relations at Samsung Electronics helped reduce concerns over semiconductor supply-chain disruptions.
- Chart of the day: Nikkei 225 kickstarts new bullish impulsive up move sequence towards new all-time highs above 61,955 key short-term support.
Top Macro Headlines
- US-Iran peace deal reaches “in progress”: Global market sentiment shifted gear to “risk on” dramatically after Iran said the latest proposal from the US has partly bridged the gap between them, increasing the odds of a peace deal.
- Japan April CPI cools to 4-year low: Japan's core consumer price index, which excludes fresh food but includes energy, rose 1.4% year-on-year in April, coming in softer than market forecasts of 1.7%. Also, the Bank of Japan’s preferred inflation data, the core-core CPI, excluding fresh food and energy, rose at a slower pace of 1.9% y/y versus 2.4% in March. This reading marked the lowest level since July 2024 and fell below the Bank of Japan's 2% target, largely due to government fuel subsidies offsetting the Iran war oil shock.
Key Macro Themes
- Geopolitical “risk on” volatility unlocked: Capital markets are actively pricing out the prolonged geopolitical risk premium. The temporary pause in Middle East military escalation has triggered immediate short-covering across multiple asset classes, especially boosting airlines and tech while tanking crude oil.
- Diverging central bank paths: While the Fed minutes signal potential rate hikes due to sticky US inflation, the Bank of Japan finds itself with renewed breathing room. Japan's unexpectedly soft 1.4% y/y core CPI and 1.9% y/y core-core CPI prints suggest less urgency for immediate aggressive tightening, despite the ongoing weakness of the Yen.
- The billion-dollar tech IPO thaw: Led by SpaceX seeking a $1.75 trillion public footprint and OpenAI moving into confidential prospectus filings, the multi-trillion-dollar tech listings boom is shifting structural market liquidity back toward equities.
Global Market Impact: Last 24 Hours
Equities: Global equities experienced a massive relief rally. Wall Street rallied for the second consecutive session, with a fresh all-time closing high seen in the Dow Jones Industrial Average. The energy sector lagged, down 1%.
Fixed Income: Sovereign bond yields pulled back, providing much-needed relief from the recent historic debt selloff. The benchmark US 10-year Treasury yield slid for the second consecutive session by 1 bps to 4.57%, and the longer-term 30-year yield fell by 3 bps to 5.09%.
FX: The US Dollar Index, DXY, traded almost unchanged on Thursday, 21 May, capped by renewed risk-on appetite. The Japanese Yen faced depreciation pressure following the softer-than-expected Japan CPI data, as it probed the 159.10/35 per USD level that may trigger verbal intervention.
Commodities: WTI and Brent crude oil saw losses for the second consecutive session, dropping by 1.1% and 0.2% on Wednesday, 21 May, as the geopolitical risk premium from the Middle East conflict evaporated on peace hopes. Meanwhile, spot Gold traded almost unchanged at $4,543/oz, below its 20-day moving average at $4,611/oz.
Asia Pacific Impact
- Stock markets: Benchmark Asia Pacific stock indices kick-start today’s session on a bullish footing, reinforced by overnight gains seen in the US stock market. Nikkei 225 rose 1.8%, Hang Seng Index gained 0.5%, KOSPI rose 0.5%, ASX 200 added 0.4%, and STI advanced 0.2% at the time of writing.
- Currencies and monetary policy: The Indonesian Rupiah caught a significant bid and strengthened after Bank Indonesia implemented an interest rate hike to defend the currency. Conversely, Japan's unexpectedly soft CPI data gives the Bank of Japan breathing room, further complicating efforts to defend the Yen from speculative short selling.
- Corporate and supply chain: Providing a major tailwind for regional tech, the Samsung union officially suspended its planned strike after reaching a tentative pay deal, easing severe risks to global semiconductor and memory supply chains.
Top 3 Events to Watch Today
- UK Retail Sales (Apr) - 2.00 pm SGT; consensus: 1.3% y/y, Mar: 1.7% Impact: GBP/USD, GBP crosses, FTSE 100
- US University of Michigan Consumer Sentiment Final (May) - 10.00 pm SGT Impact: USD, US stock indices
- Updates on US-Iran peace deal Impact: All asset classes
Chart of the Day: Nikkei 225 En Route to Fresh All-Time High
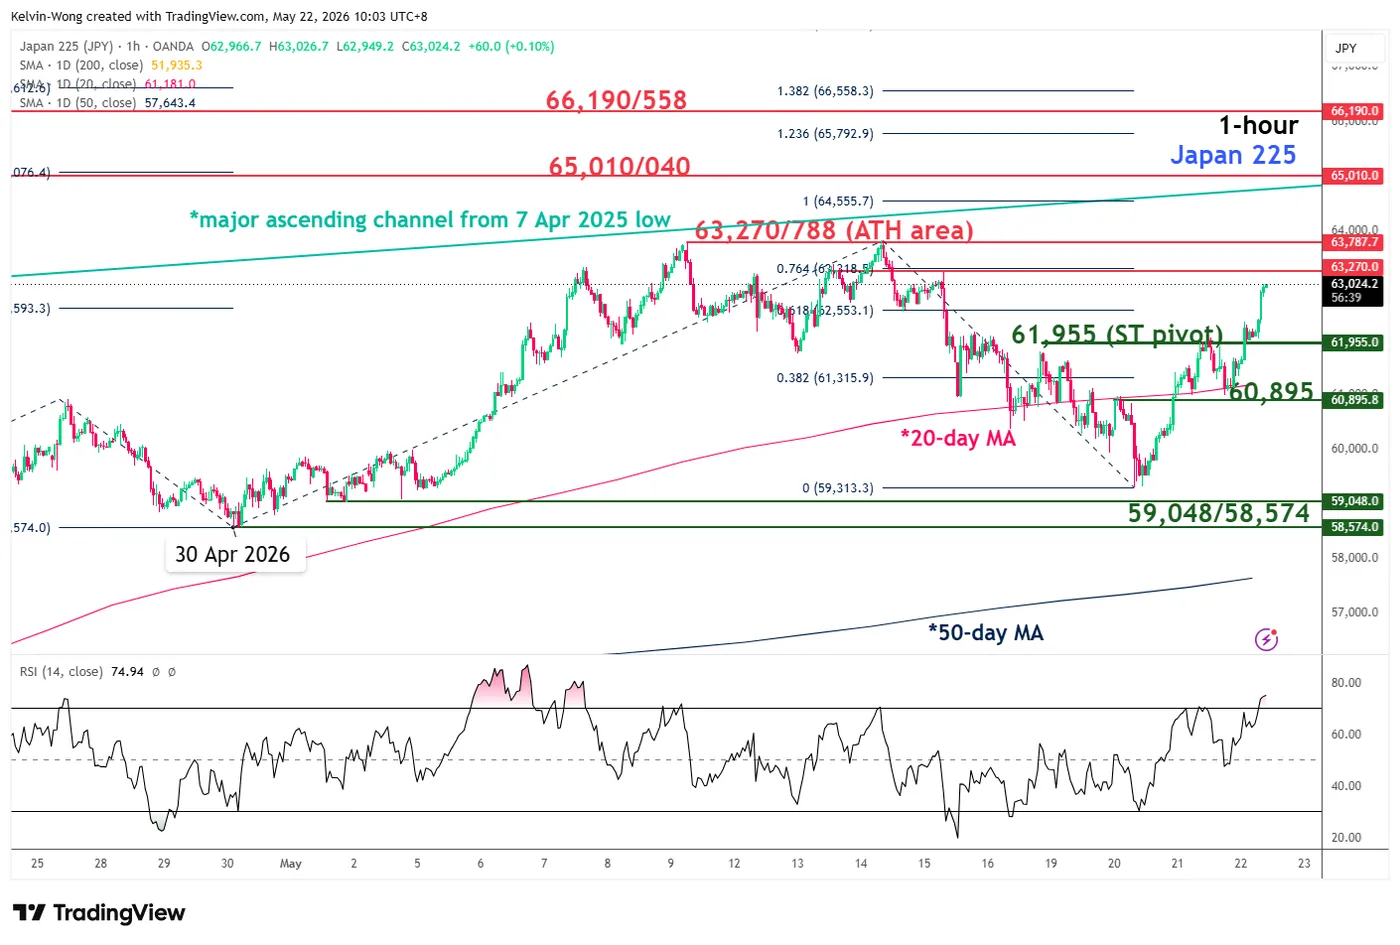
Fig. 1: Japan 225 CFD minor trend as of 22 May 2026. Source: TradingView.
The recent bullish reversal seen on the Japan 225 CFD, a proxy of the Nikkei 225 futures, after a break below and a reintegration back above its 20-day moving average on Wednesday, 20 May 2026, has suggested that a new potential bullish impulsive up move sequence is underway towards new record highs.
Watch the 61,955 key short-term pivotal support to maintain the bullish bias. A clearance above the current all-time area of 63,270/788 sees the next intermediate resistances coming in at 65,010/040 and 66,190/558, Fibonacci extension clusters.
On the other hand, a break and an hourly close below 61,955 invalidates the bullish scenario, potentially leading to a minor corrective setback to retest the 20-day moving average at 60,985. Further weakness is possible, with potential to extend towards the next intermediate support at 59,048/58,574.