Sample Category Title
USD/JPY: Second Consecutive Week Closes Higher
USD/JPY rose to 159.04 at the end of the week, marking the yen's second consecutive weekly decline. The Japanese currency came under pressure after weaker inflation data reduced expectations of imminent Bank of Japan policy tightening.
Core inflation in Japan slowed to 1.4% in April, down from 1.8% the previous month – the lowest level in four years. Moreover, the indicator has remained below the Bank of Japan's 2% target for the third consecutive month.
At its April meeting, the BOJ sharply raised its core inflation forecast for the current year to 2.8%, up from 1.9%. The regulator attributed this revision to high oil prices amid the Middle East conflict and the continued pass-through of business costs to consumers.
Additional market attention has been drawn to reports that Japanese Prime Minister Sanae Takaichi is considering an additional budget to compensate for rising energy prices.
At the same time, markets continue to monitor the risk of fresh foreign exchange interventions. The yen remains near the 160-per-dollar level — the level that triggered Japanese authorities' interventions in late April and early May.
Technical Analysis
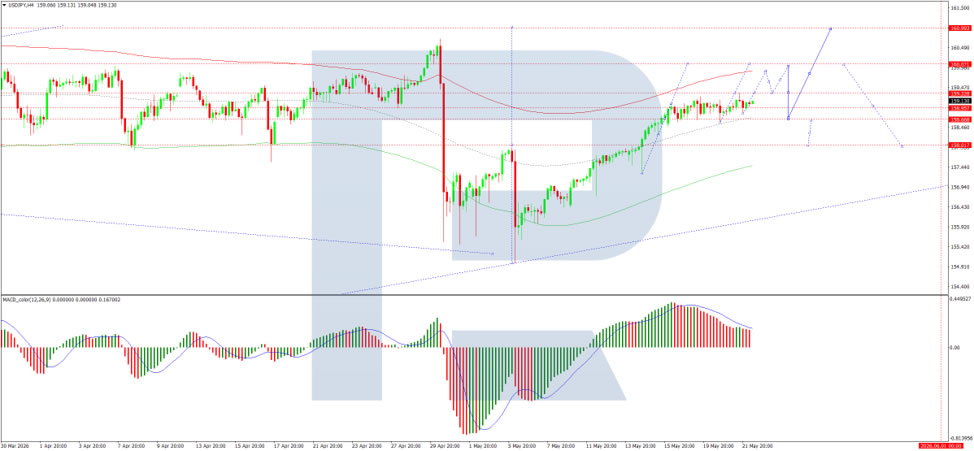
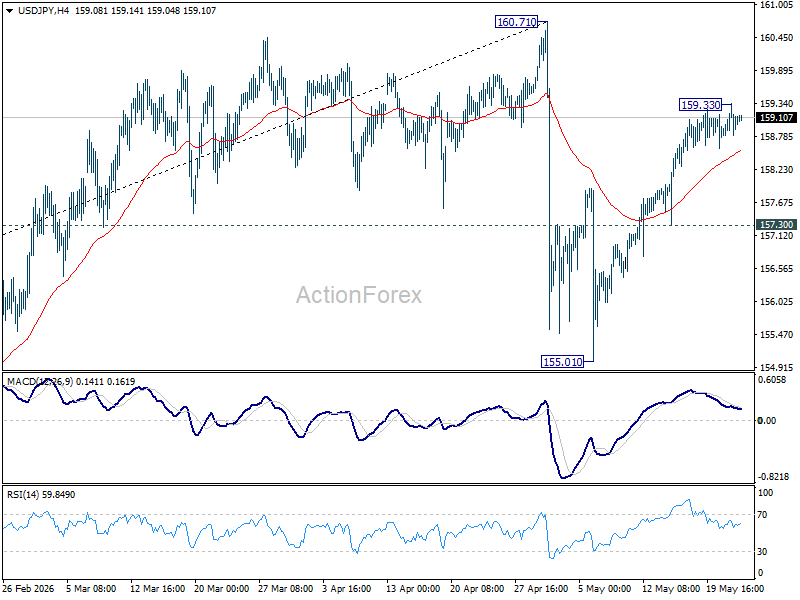
On the H4 chart, USD/JPY is trading within a consolidation range around 158.68 and is moving higher towards 160.09. A test of this level is likely, followed by a possible pullback to 158.66, with scope for a further decline towards 157.00. The MACD indicator supports this scenario, with its signal line above zero and pointing firmly upwards, indicating continued bullish momentum.
USD/JPY is set to close its second consecutive week higher as the yen remains under pressure from softer-than-expected Japanese inflation data. Core inflation slowed to a four-year low of 1.4%, falling further below the BOJ's 2% target and dampening expectations for near-term policy tightening. This contrasts with the BOJ's upgraded inflation forecast of 2.8%, driven by energy costs related to the Middle East conflict. With the pair hovering near the critical 160 level, where Japanese authorities intervened in late April and early May, markets remain on high alert for potential intervention. Prime Minister Takaichi's consideration of an additional budget to address energy prices adds another layer of complexity. Technically, further upside towards 160.09 appears likely in the near term.
Conclusion
GBP/USD stabilised following weaker-than-expected UK inflation data, easing concerns about aggressive Bank of England rate hikes. However, the pound faces headwinds from a soft labour market and rising oil prices, suggesting that any recovery may be short-lived. Technical indicators point to a near-term correction before a potential continuation of the broader trend.
Markets Frozen as Washington and Tehran Wait for the Other Side to Blink
Global financial markets remain trapped in a tense but directionless pattern as investors struggle to price a US-Iran conflict that is neither escalating into full confrontation nor moving convincingly toward resolution. Brent crude continues hovering near USD 105 after another volatile week, while US 10-year Treasury yields remain comfortably above 4.5%. Equities are largely drifting sideways, with US futures flat and European indexes posting only marginal gains. Dollar also remains broadly firm as persistent geopolitical uncertainty keeps risk appetite restrained.
At the center of the paralysis is a negotiation process increasingly resembling a war of attrition rather than a genuine march toward peace. US Secretary of State Marco Rubio acknowledged there had been “slight progress” and “a little bit of movement” in talks ahead of the NATO summit in Sweden, but he simultaneously warned against excessive optimism, emphasizing that a comprehensive breakthrough remains highly unlikely.
Both Washington and Tehran appear convinced that time and economic endurance favor their own position. The US continues applying heavy economic pressure by disrupting Iranian oil exports and maritime trade, while Iran is leveraging its grip over the Strait of Hormuz as its ultimate bargaining tool.
Two major issues continue blocking meaningful progress. First, Iran’s insistence on retaining its highly enriched uranium stockpile remains fundamentally incompatible with US demands that the material be removed entirely from the country. Second, Tehran’s proposed Hormuz transit system — including ship vetting procedures and “security fees” for passage — has emerged as another major sticking point. Rubio called the tolling proposal “completely unacceptable,” warning it would make any diplomatic solution unworkable.
The result is an unstable quiet where the greatest fear may no longer be outright diplomatic collapse itself, but rather a single maritime miscalculation capable of destroying the fragile ceasefire.
Markets are therefore entering the weekend bracing for another intense burst of headline volatility. A highly technical, bare-minimum agreement aimed merely at lowering economic tensions remains possible. But equally plausible is a rapid return to more aggressive rhetoric if negotiators fail to produce a signed framework over the next 48 hours.
Until one side is ultimately forced to blink — or until a fresh escalation reshapes the balance entirely — markets may remain trapped inside volatile geopolitical limbo.
Canada Retail Sales Jump on Higher Fuel Prices, Underlying Demand Still Soft
Canada’s retail sales jumped in March as higher oil prices boosted gasoline spending, but weaker core sales and falling volumes pointed to softer underlying demand. Read More.
EUR/CAD Struggles for Direction as Oil Volatility and ECB Divisions Offset Each Other
EUR/CAD remained trapped in consolidation as fading oil sensitivity in CAD and divisions inside the ECB offset each other and capped directional momentum. Read More.
Germany Ifo Business Climate Improves Further, but Recovery Still Fragile
Germany’s business sentiment improved modestly in May as services returned to positive territory, though trade and construction sectors continued struggling. Read More.
Germany GfK Consumer Climate Improves to -29.8 as Income Outlook Recovers
Germany’s consumer confidence showed tentative signs of stabilization as income expectations improved sharply, though Middle East tensions continued weighing on households. Read More.
UK Retail Sales Fall -1.3% mom in April as Consumer Demand Weakens
UK retail sales fell far more than expected in April, reinforcing signs that consumer demand is weakening as households turned cautious on discretionary spending. Read More.
Silver’s $90 Breakout Dream Fades, but Structural Deficit Keeps $70 Floor Alive
The silver market may be shifting from speculative breakout mania toward violent range trading as geopolitical panic remerges but industrial demand remains structurally strong. Read More.
Japan Core Inflation Slows to Four-Year Low as Weak Price Momentum Challenges BoJ Hawks
Weakening service inflation and fading food-price spikes reinforced concerns that Japan’s underlying inflation trend may still be too fragile for aggressive BoJ tightening. Read More.
USD/CAD Daily Outlook
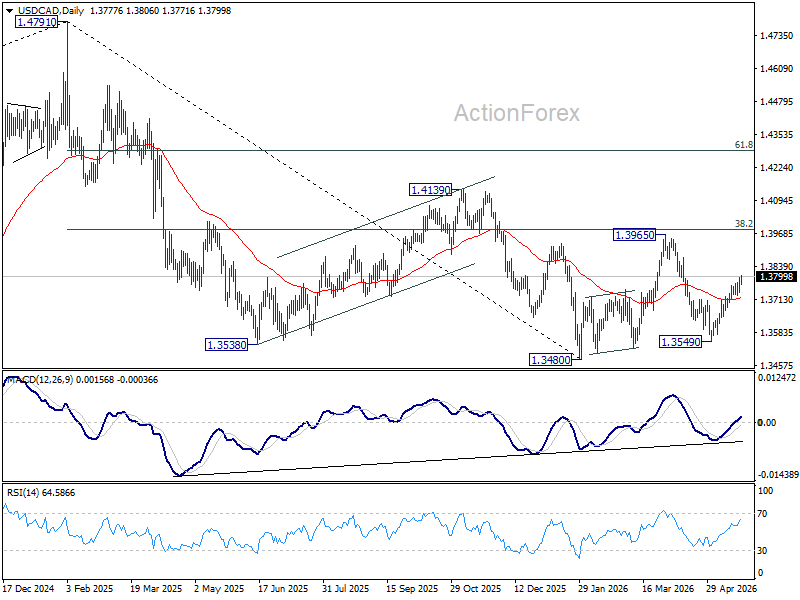
USD/CAD's rise from 1.3549 resumed after brief retreat ad intraday bias is back on the upside. The rally is seen as seen as the third leg of the corrective pattern from 1.3480, and should target 1.3965 resistance next. On the downside, below 1.3729 minor support will turn intraday bias neutral again.
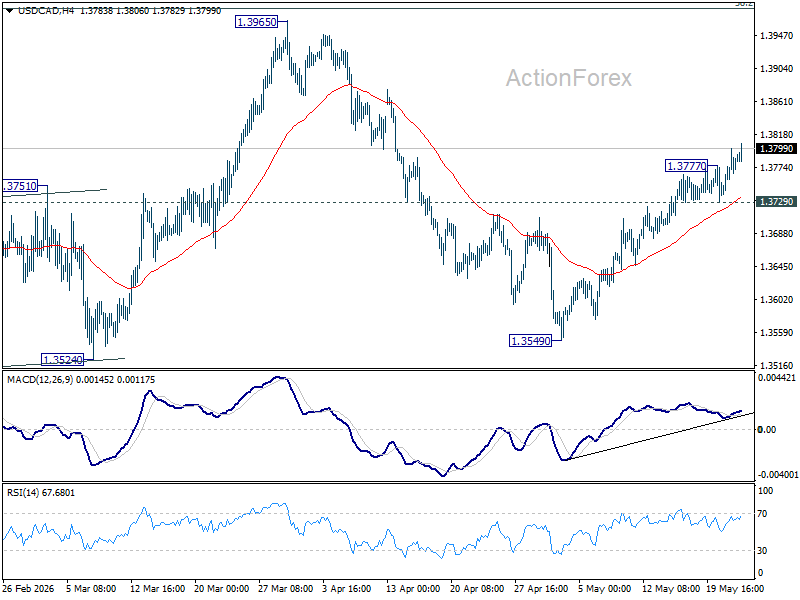
In the bigger picture, price actions from 1.4791 are seen as a corrective pattern to the whole up trend from 1.2005 (2021 low). Deeper fall could be seen, as the pattern extends, to 61.8% retracement of 1.2005 to 1.4791 at 1.3069. However, decisive break of 38.2% retracement of 1.4791 to 1.3480 at 1.3981 will argue that the correction has completed with three waves down to 1.3480 already.
USD/CAD Daily Outlook
USD/CAD's rise from 1.3549 resumed after brief retreat ad intraday bias is back on the upside. The rally is seen as seen as the third leg of the corrective pattern from 1.3480, and should target 1.3965 resistance next. On the downside, below 1.3729 minor support will turn intraday bias neutral again.
In the bigger picture, price actions from 1.4791 are seen as a corrective pattern to the whole up trend from 1.2005 (2021 low). Deeper fall could be seen, as the pattern extends, to 61.8% retracement of 1.2005 to 1.4791 at 1.3069. However, decisive break of 38.2% retracement of 1.4791 to 1.3480 at 1.3981 will argue that the correction has completed with three waves down to 1.3480 already.
Canada Retail Sales Jump on Higher Fuel Prices, Underlying Demand Still Soft
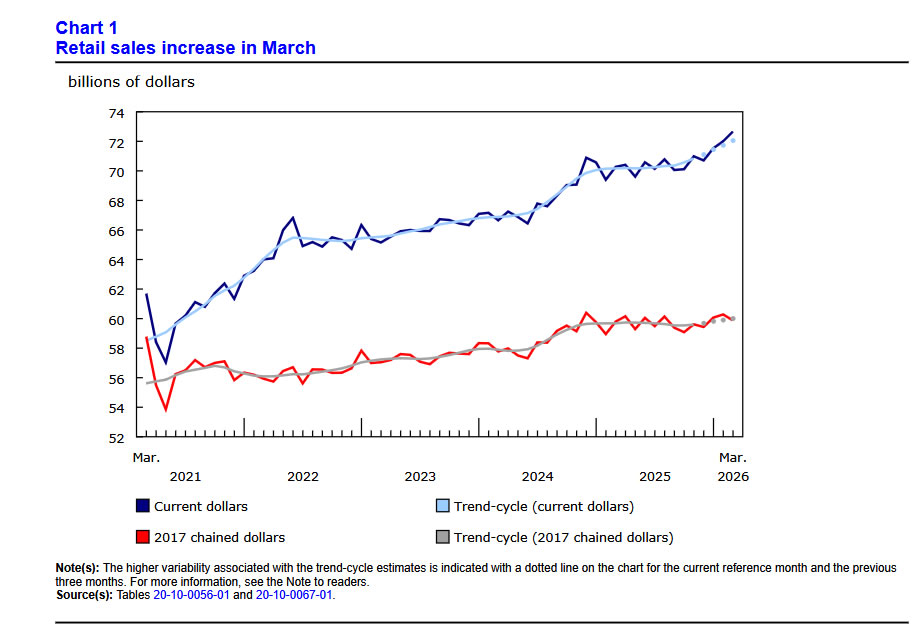
Canada retail sales rose a stronger-than-expected 0.9% mom in March to CAD 72.7B, beating expectations of a 0.5% increase. The headline gain was driven largely by gasoline stations and fuel vendors, where sales surged 12.4% during the month as higher oil prices linked to the Middle East conflict pushed fuel costs sharply higher.
However, underlying consumer demand remained considerably softer beneath the headline strength. Core retail sales, which exclude gasoline stations, fuel vendors, and motor vehicle dealers, slipped -0.1% mom in March. In volume terms, overall retail sales actually declined -0.7%, while sales volumes at gasoline stations fell -1.9%, indicating much of the nominal increase reflected higher prices rather than stronger real consumption activity.
Even so, broader trend data remained relatively stable. Retail sales increased 2.1% in Q1, marking a seventh consecutive quarterly gain, while volumes rose 1.2% over the quarter. Statistics Canada’s advance estimate also suggested another 0.6% increase in April retail sales.
| Indicator | Latest |
|---|---|
| Retail Sales (mom) | 0.9% |
| Core Retail Sales (mom) | -0.1% |
| Retail Sales Volume (mom) | -0.7% |
| Gasoline Station Sales (mom) | 12.4% |
| Gasoline Sales Volume (mom) | -1.9% |
| Q1 Retail Sales Growth | 2.1% |
| Q1 Retail Sales Volume Growth | 1.2% |
| Advance April Retail Sales Estimate | 0.6% |
AUD/USD Daily Report
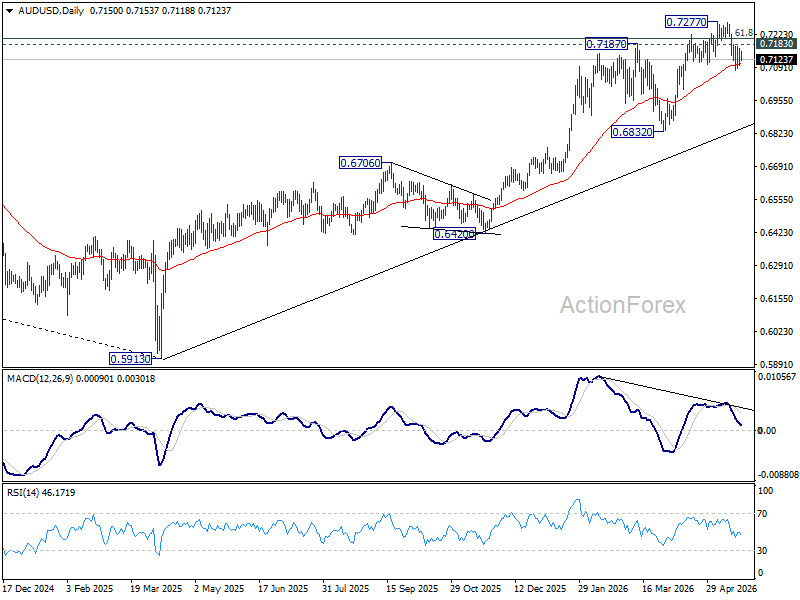
Outlook in AUD/USD remains unchanged and intraday bias stays neutral. On the upside, above 0.7183 minor resistance will suggest that pullback from 0.7277 has completed. Intraday bias will be back on the upside for retesting this high. However, decisive break of 0.7076 will bring deeper decline back towards 0.6832 support.
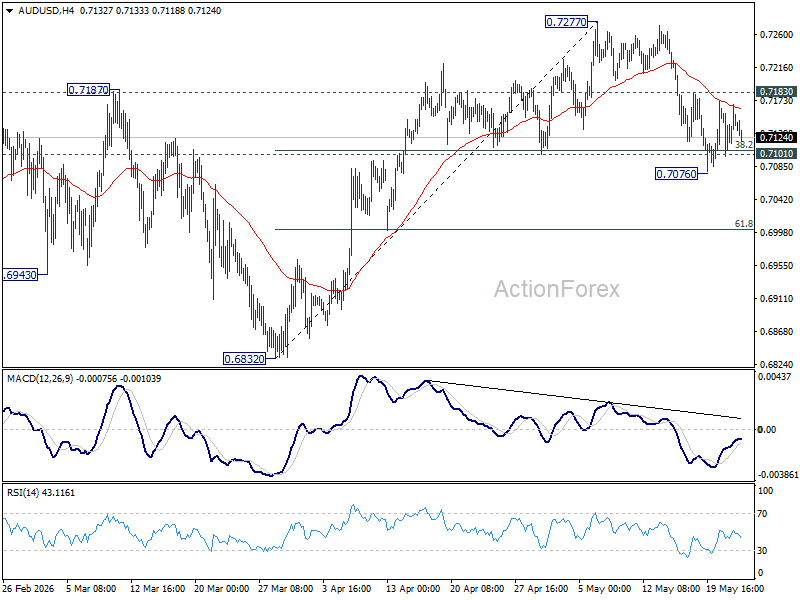
In the bigger picture, rise from 0.5913 (2024 low) is still in progress. Decisive break of 61.8% retracement of 0.8006 to 0.5913 at 0.7206 will solidify the case that it's already reversing the down trend from 0.8006 (2021 high). Further rally should then be seen to retest 0.8006. For now, outlook will remain bullish as long as 0.6832 support holds, in case of pullback.
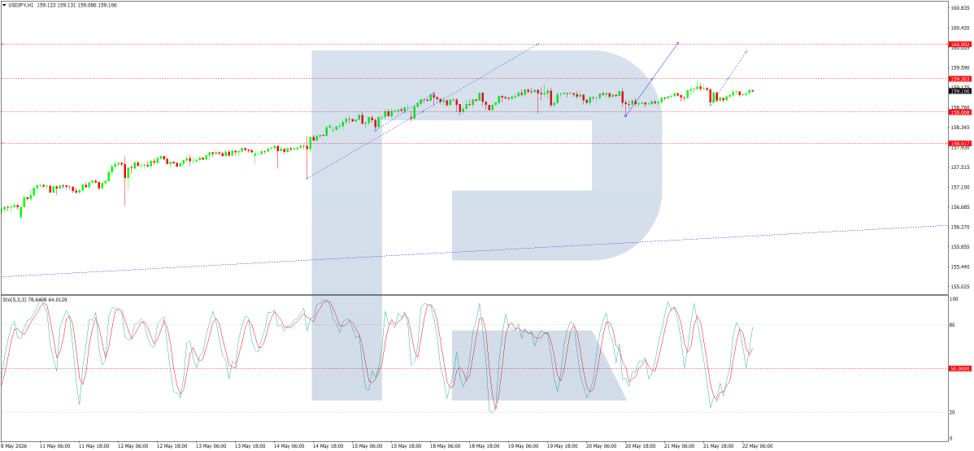
USD/JPY Daily Outlook
USD/JPY edged higher to 159.33 but quickly retreated. Intraday bias remains neutral first. Above 159.24 will target 160.71 high. Strong resistance is expected from there to start the third leg of the near term corrective pattern. On the downside, break of 157.30 support will turn bias to the downside for retesting 155.01.
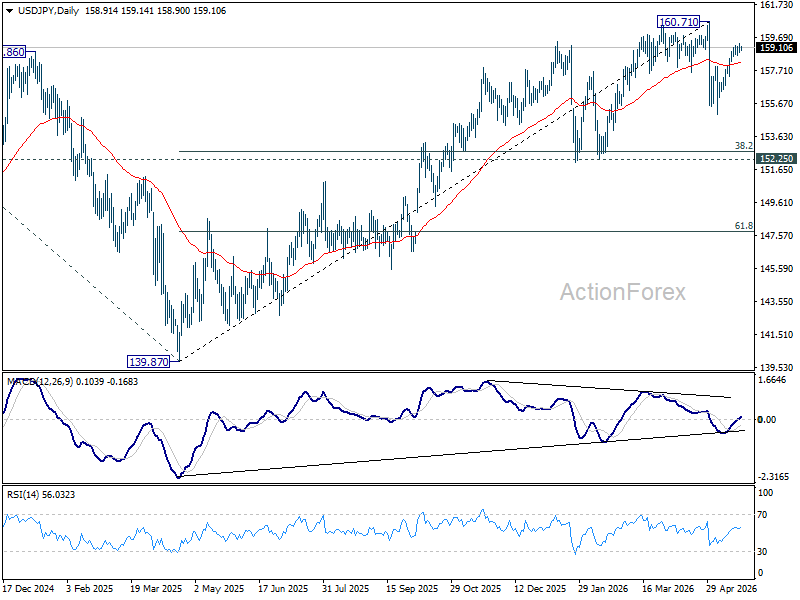
In the bigger picture, for now, corrective pattern from 161.94 (2024 high) is still seen as completed at 139.87. Rise from there is seen as resuming the long term up trend. So, break of 161.94 is expected at a later stage to resume the long term up trend. However, sustained break of 55 W EMA (now at 154.36) will dampen this view and bring deeper fall back towards 139.87 to extend the pattern from 161.94.
USD/CHF Daily Outlook
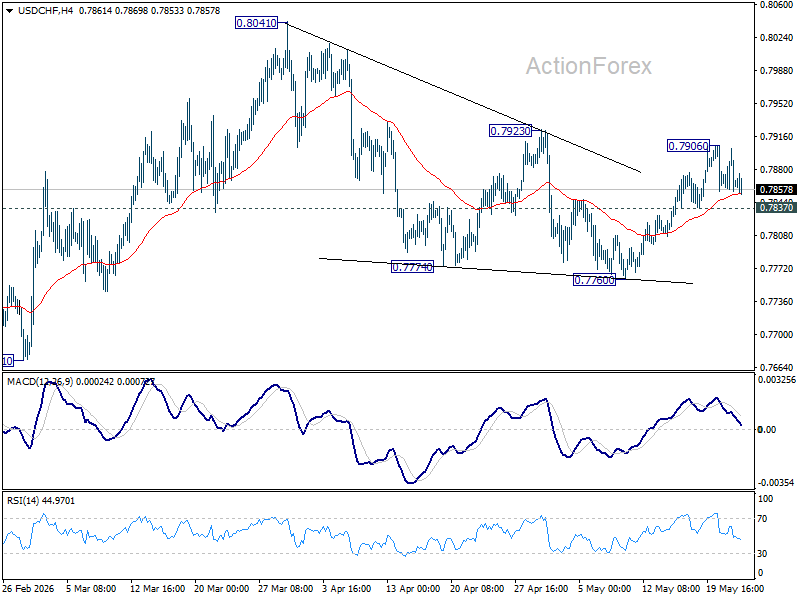
Intraday bias in USD/CHF remains neutral at this point. Further rise is in favor as long as 0.7837 support holds. Firm break of 0.7923 resistance will argue that fall from 0.8041 has completed as a three wave correction, and bring further rise to retest this high. However, break of 0.7837 will turn bias back to the downside for 0.7760 support instead.
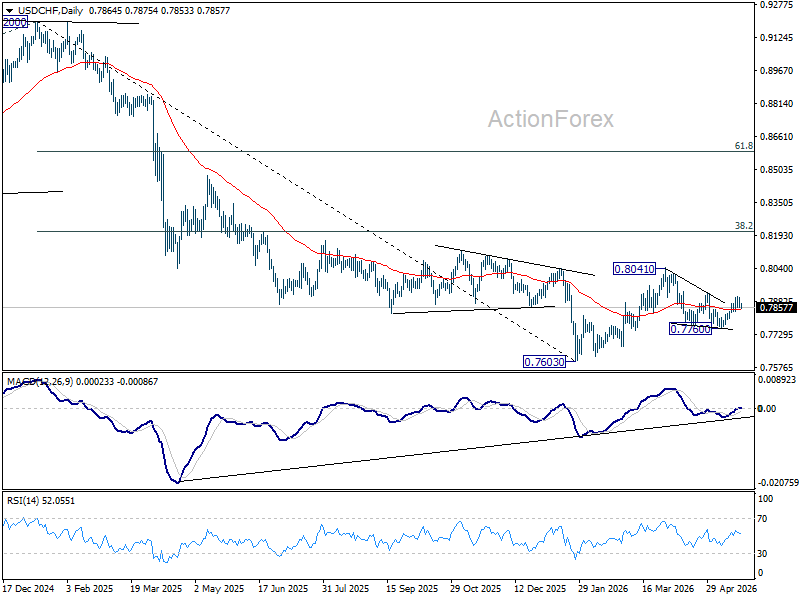
In the bigger picture, as long as 55 W EMA (now at 0.8035) holds, fall from 0.9200 is expected to continue, as part of the larger down trend. Firm break of 0.7603 will target 100% projection of 1.0146 (2022 high) to 0.8332 from 0.9200 at 0.7382.
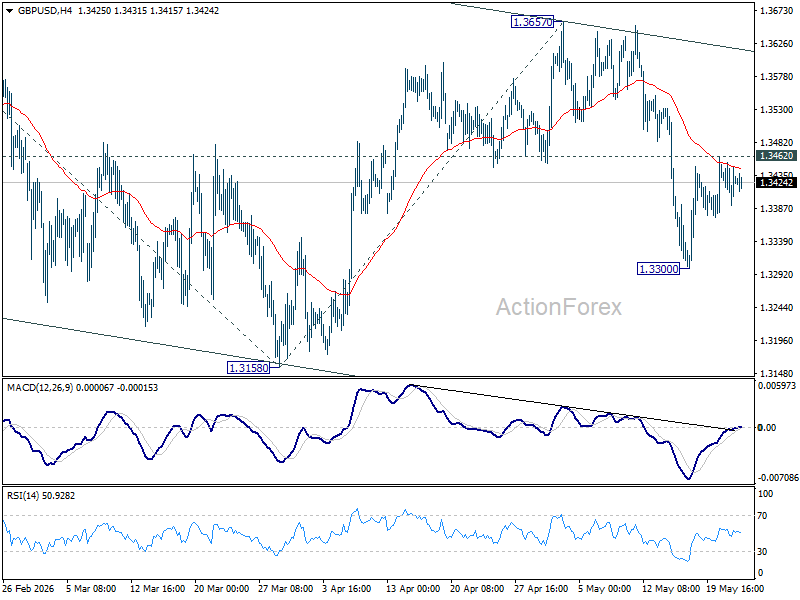
GBP/USD Daily Outlook
Intraday bias in GBP/USD remains neutral at this point. On the downside, below 1.3300 will target a retest on 1.3158 support first. Howeve3r, firm break of 1.3462 will bring stronger rebound back to 1.3657 resistance instead.
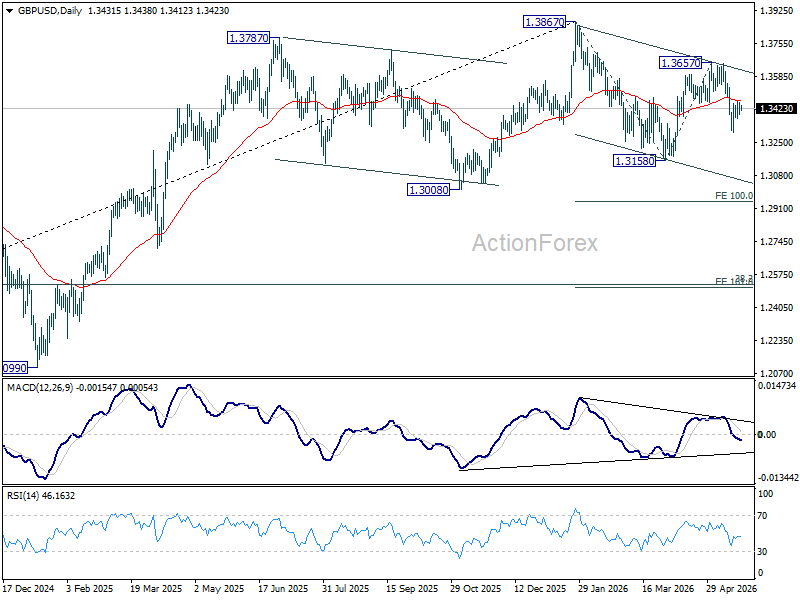
In the bigger picture, current development suggests that price actions from 1.3867 are merely a corrective pattern within the broader up trend from 1.0351 (2022 low). With 1.3008 support intact, medium term bullishness is maintained and break of 1.3867 is in favor for a later stage, towards 1.4248 key resistance (2021 high). However, firm break of 1.3008 will at least bring deeper fall to 38.2% retracement of 1.0351 to 1.3867 at 1.2524, with increased risk of bearish reversal.
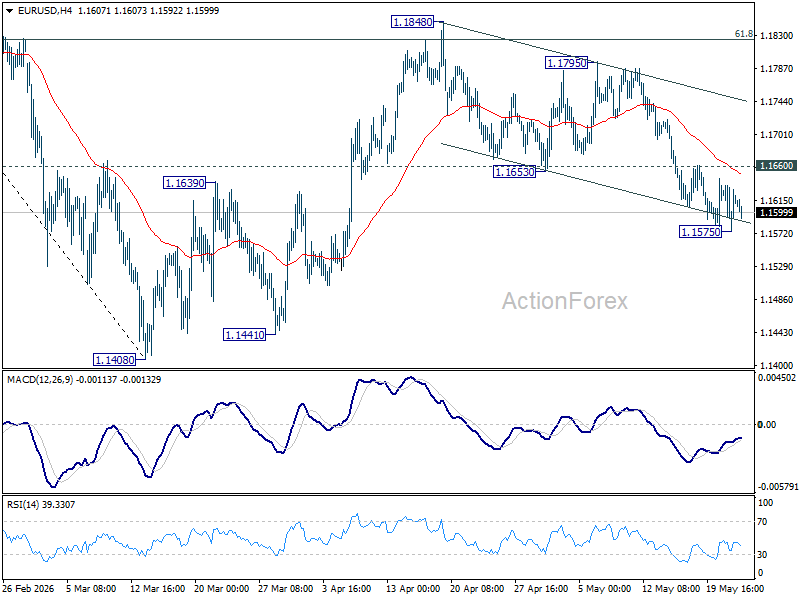
EUR/USD Daily Outlook
EUR/USD edged lower to 1.1575 but quickly recovered. Intraday bias stays neutral first. As noted before, rebound from 1.1408 could have completed as a corrective three-wave move. Firm break of 1.1575 will target a retest on 1.1408 low. However, decisive break of 1.1660 minor resistance will turn bias back to the upside for stronger rebound.
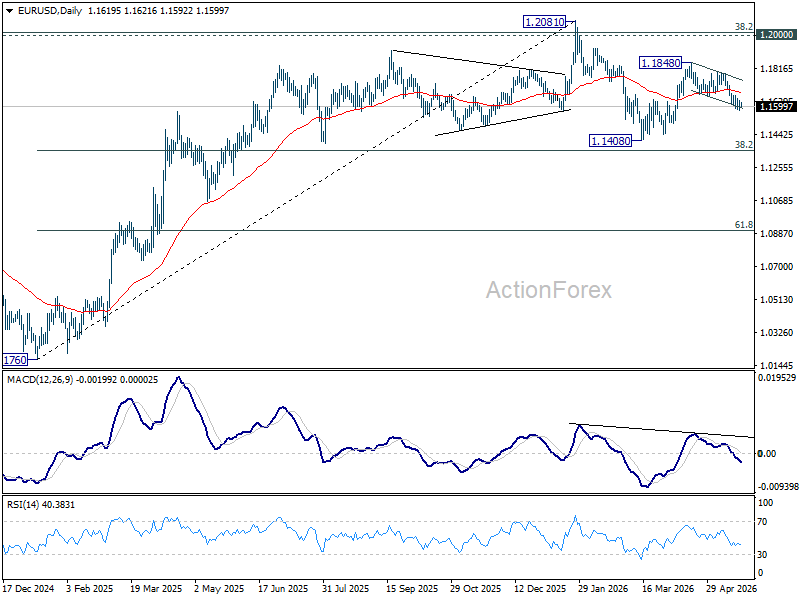
In the bigger picture, the strong support from 38.2% retracement of 1.0176 to 1.2081 at 1.1353 suggests that the pullback from 1.2081 is more likely a corrective move. Strong support was also found in 55 W EMA (now at 1.1542). Focus is back on 1.2 key cluster resistance level. Decisive break there will carry long term bullish implications. Nevertheless, break of 1.1408 support will revive the case of medium term bearish trend reversal.
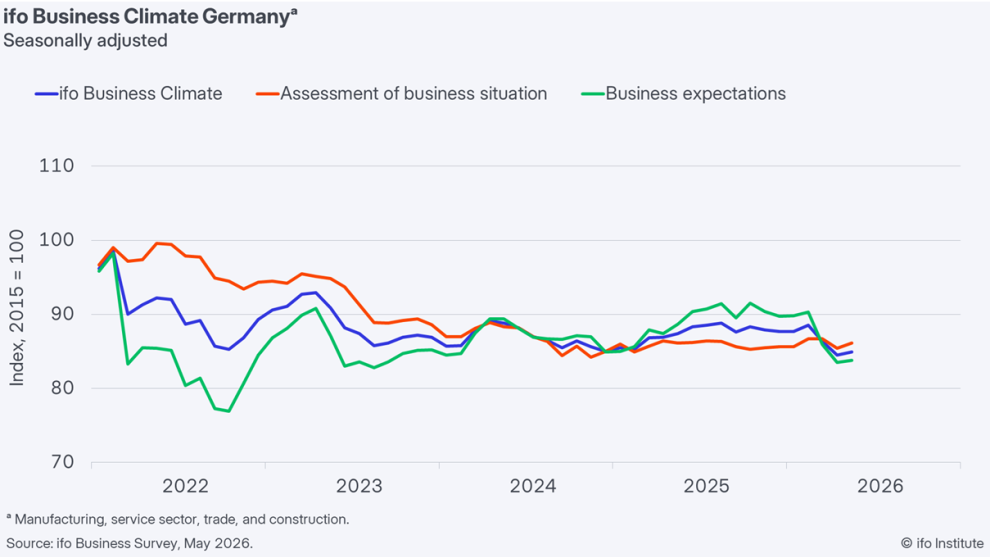
Germany Ifo Business Climate Improves Further, but Recovery Still Fragile
Germany’s Ifo Business Climate index improved modestly in May, offering signs that Europe’s largest economy may be stabilizing after months of weakness, though underlying conditions remain uneven across sectors. Business Climate index rose from 84.5 to 84.9, beating expectations of 84.2. Current Assessment Index also improved from 85.5 to 86.1, while Expectations Index edged higher from 83.5 to 83.8, both coming in above market forecasts.
The improvement was driven mainly by manufacturing and services. Manufacturing sentiment rose from -12.1 to -11.3 as firms benefited from easing supply disruptions and some stabilization in external demand conditions. Services sector returned into positive territory, improving from -2.6 to 0.1, suggesting domestic activity may be finding a temporary footing despite elevated energy costs and broader geopolitical uncertainty. However, weakness persisted elsewhere, with trade sentiment deteriorating further from -21.1 to -21.9 and construction falling from -14.3 to -15.6 as higher financing costs and weak demand continued weighing on the sector.
The Ifo Institute said “the German economy is stabilizing for the time being, although situation remains fragile.” That assessment broadly matches the wider Eurozone picture currently emerging from business surveys: the sharp deterioration seen earlier this year may be slowing, but high energy prices, weak consumer demand, and uncertainty surrounding the Middle East conflict continue preventing a more convincing recovery from taking hold..
| Indicator | Previous | Latest | Expectation |
|---|---|---|---|
| Ifo Business Climate | 84.5 | 84.9 | 84.2 |
| Current Assessment | 85.5 | 86.1 | 85.1 |
| Expectations Index | 83.5 | 83.8 | 83.5 |
Sector Breakdown
| Sector | Previous | Latest |
|---|---|---|
| Manufacturing | -12.1 | -11.3 |
| Services | -2.6 | 0.1 |
| Trade | -21.1 | -21.9 |
| Construction | -14.3 | -15.6 |