Sample Category Title
GOLD Consolidating, SILVER Continued Weakness, CRUDE OIL Consolidating Below 50.
GOLD Consolidating.
Gold is consolidating around 1265 after the yellow metal has faded near the hourly resistance at 1295 (18/04/2017 high). Support can be located at 1261 (intraday low). The road is wide-open for further decline.
In the long-term, the technical structure suggests that there is a growing upside momentum. A break of 1392 (17/03/2014) is necessary ton confirm it, A major support can be found at 1045 (05/02/2010 low).
SILVER Continued weakness.
Silver has broken strong support at 18.16 (rising trendline) indicating further downside risk. Strong support is given far away at 16.82 (15/03/2017 low). Strong resistance is given at a distance at 19.00 (09/11/2017 high). Expected to see continued bearish pressures.
In the long-term, the death cross indicates that further downsides are very likely. Resistance is located at 25.11 (28/08/2013 high). Strong support can be found at 11.75 (20/04/2009).
CRUDE OIL Consolidating below 50.
Crude oil has declined sharply, breaking the support at 50.71, yet now has paused. Support now lies at 48.87 (25/04/2017 low). Resistance for a short-term bounce can be found at 50.71 (old support) and 53.70 (12/04/2017 high).
In the long-term, crude oil has recovered after its sharp decline last year. However, we consider that further weakness are very likely. Strong support lies at 24.82 (13/11/2002) while resistance can now be found at 55.24 (03/01/2017 high).
EUR/JPY Consolidating Above 120.00, EUR/GBP Selling Pressures, EUR/CHF Feeling Gravity Again!
EUR/JPY Consolidating above 120.00.
EUR/JPY's buying pressures are there. Key resistance stands at 123.31 (27/01/0217 high). Major support is given at 114.90 (18/04/2017low). Expected to see short-term consolidation before seeing another leg higher.
In the longer term, the technical structure validates a medium-term succession of lower highs and lower lows. As a result, the resistance at 149.78 (08/12/2014 high) has likely marked the end of the rise that started in July 2012. Strong support at 94.12 (24/07/2012 low) looks nonetheless far away.
EUR/GBP Selling pressures.
EUR/GBP keeps on pushing lower. The technical structure is negative as long as the resistance at 0.8596 holds. Expected to show continued weakness until resistance given at 0.8304 (05/12/2017 low).
In the long-term, the pair has largely recovered from recent lows in 2015. The technical structure suggests a growing upside momentum. The pair is trading above from its 200 DMA. Strong resistance can be found at 0.9500 psychological level.
EUR/CHF Feeling gravity again!
EUR/CHF is back lower. Despite the sharp increase and the recent bullish breakout which is very likely psychological, we believe that the medium-term pattern suggests us to see at some point renewed bearish pressures towards key support that can be found at 1.0623 (24/06/2016 low).
In the longer term, the technical structure is mixed. Resistance can be found at 1.1200 (04/02/2015 high). Yet,the ECB's QE programme is likely to cause persistent selling pressures on the euro, which should weigh on EUR/CHF. Supports can be found at 1.0184 (28/01/2015 low) and 1.0082 (27/01/2015 low).
USD/CHF Trading Sideways, USD/CAD Strong Buying Pressures, AUD/USD Pausing.
USD/CHF Trading sideways.
USD/CHF is trading mixed. The volatility is declining. The short-term technical structure is negative as long as prices remain below the hourly resistance at 1.0171 (07/03/2017). Monitor strong support given at 0.9814 (27/03/2017 low).
In the long-term, the pair is still trading in range since 2011 despite some turmoil when the SNB unpegged the CHF. Key support can be found 0.8986 (30/01/2015 low). The technical structure favours nonetheless a long term bullish bias since the unpeg in January 2015.
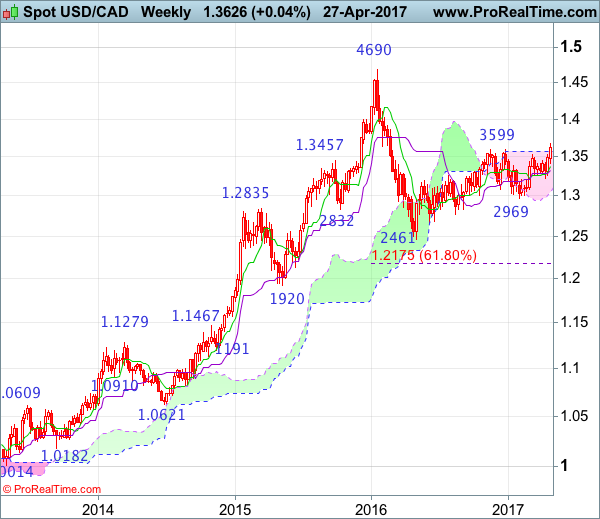
USD/CAD Strong buying pressures.
USD/CAD has broken key resistance given at 1.3599 (28/12/206 high). The pair keeps on pushing higher. Hourly support can be found at 1.3411 (24/04/2017 high) then 1.3353 (20/01/2017 high). Expected to show continued bullish pressures as long as the pair remains above 1.3411.
In the longer term, there is a golden cross with the 50 dma crossing the 200 dma indicating further upside pressures. Strong resistance is given at 1.4690 (22/01/2016 high). Long-term support can be found at 1.2461 (16/03/2015 low).
AUD/USD Pausing.
AUD/USD is consolidating after the break of support at 0.7473 (12/04/2017 low). As long as prices remain below the resistance at 0.7608 (17/04/2017 high), the short-term technical structure is negative. Key resistance stands at 0.7681 (30/03/2017 high). Expected to show further weakness.
In the long-term, we are waiting for further signs that the current downtrend is ending. Key supports stand at 0.6009 (31/10/2008 low) . A break of the key resistance at 0.8295 (15/01/2015 high) is needed to invalidate our long-term bearish view.
EUR/USD Bearish Consolidation, GBP/USD Pushing Higher, USD/JPY Moving Sideways.
EUR/USD Bearish consolidation.
EUR/USD is consolidating lower. Hourly support is given at 1.0852 (27/04/2017 low) then 1.0682 (21/04/2017 base). Stronger support can be found at 1.0494 (22/02/2017 low). Hourly resistance is given at 1.0951 (26/04/2017 high). Expected to show another leg higher towards 1.10.
In the longer term, the death cross late October indicated a further bearish bias. The pair has broken key support given at 1.0458 (16/03/2015 low). Key resistance holds at 1.1714 (24/08/2015 high). Expected to head towards parity.
GBP/USD Pushing higher.
GBP/USD keeps pushing higher. Resistance at 1.2905 (18/04/2017 low) has been broken. The pair has exited the short-term bearish momentum. Hourly support can be found at 1.2757 (21/04/2017 low). An unlikely break of this support would indicate further weakness.
The long-term technical pattern is even more negative since the Brexit vote has paved the way for further decline. Long-term support given at 1.0520 (01/03/85) represents a decent target. Long-term resistance is given at 1.5018 (24/06/2015) and would indicate a long-term reversal in the negative trend. Yet, it is very unlikely at the moment.
USD/JPY Moving sideways.
USD/JPY is consolidating. Strong resistance can be found at 112.20 (31/03/2017 high). Closest support can be located at 108.13 (17/04/2017 low). Other key supports lie at a distant 106.04 (11/11/2016 low). Expected to show continued bullish pressures.
We favor a long-term bearish bias. Support is now given at 96.57 (10/08/2013 low). A gradual rise towards the major resistance at 135.15 (01/02/2002 high) seems absolutely unlikely. Expected to decline further support at 93.79 (13/06/2013 low).
Investors Brace For GDP Showdown
The market-shaking, risk-on rally displayed early signs of exhaustion during early trading on Friday, with global stocks on the retreat as geopolitical concerns kept investors anxious. Asian equities were vulnerable to losses amid the cautious trading sentiment, with negative momentum already limiting gains in European markets. With Donald Trump's recent warning of a “major, major conflict” with North Korea addingto jitters this week, the upside on Wall Street may face headwinds this afternoon as participants start to scatter from riskier assets back to safety. With uncertainty still a dominant market theme and questions already being raised over Trump's ability to move forward with his proposed tax reforms, further upheaval could expose stock markets to downside shocks.
UK GDP disappoints on Q1 2017
Sterling/Dollar was volatileon Friday, following the release of a disappointing first quarter 2017 UK GDP figure of 0.3%,reviving concerns that the UK is struggling to recover from its Brexit hangover. Sterling's Brexit-induced weakness has negatively impacted one of the major drivers behind the UK's economic growth as rising inflation pressures consumers. The threat of rising inflation impacting consumer spending could spark speculationthat economic growth will decelerate in the future. With today's soft economic release adding to the Brexit woes, sentiment towards the vulnerable Sterling could take another hit. From a technical standpoint, the GBPUSD has broken above the 1.2875 with the next level of interest at 1.3000. In an alternative scenario, weakness below 1.2775 may open a path back towards 1.2600.
Mario Draghi strikes again
The Euro bears were unleashed on Thursday, after Mario Draghi swiftly quelled heated taper tantrum expectations with his dovish rhetoric. Although the European Central Bank displayed a touch of optimism when discussing the Eurozone's economic recovery, its monetary stance remained somewhat dovish. While the Eurozone recovery has become increasingly solid anddownside risks have diminished, some external, global risks and uncertainty that may force the ECB to remain on the defense still remain.
The next event risk which may spark extreme levels of volatility on the Euro will be the second round of the French presidential elections on 7 May. Although a victory by Emmanuel Macron may seal the deal for the Euro bulls with the EURUSD lurching towards 1.100, parity on the EURUSD still remains a possibility in the event of an unexpected victory by Marine Le Pen.
Gold balances on thin ice
The growing appetite for risk has exposed Gold to downside losses, with prices hovering around $1260 as of writing. Bears benefitted from the risk-on trading environment this week and have ensured the yellow metal remains depressed below $1280. Although ongoing geopolitical tensions across the globe and Trump uncertainties may support Gold in the longer term, there is still a live possibility of short term bears conquering the $1260 level.
Much attention will be directed towards the Q1 2017 US GDP report published later on today, which could impact where Gold concludes this month. A soft US GDP figure will have the ability to weaken the Dollar and trim rate hike expectations, ultimately supporting the yellow metal. From a technical standpoint, a breakdown and daily close below $1260 should encourage a further decline towards $1240. In an alternative scenario, bulls need to keep above $1260 for a further incline back towards $1280.
EUR/JPY Elliott Wave Analysis
EUR/JPY - 121.01
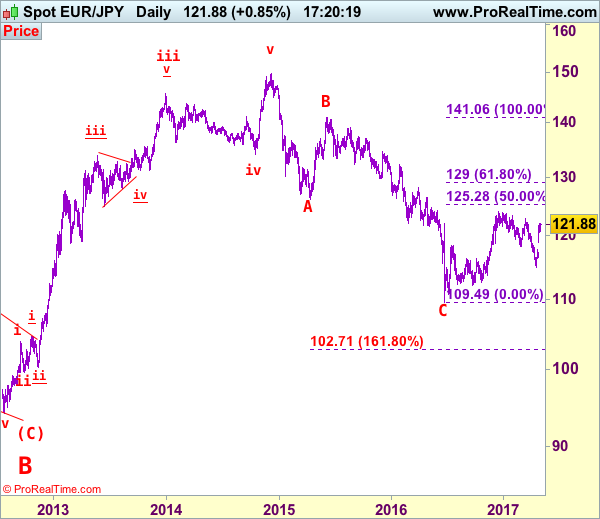
EUR/JPY: Wave v as well as larger degree wave (C) ended at 94.11 and first leg of larger degree wave C upmove has possibly ended at 149.79 and wave 2 correction has possibly ended at 109.49.
The single currency opened sharply higher this week and rallied to as high as 121.98, signaling low has been formed at 114.85 early last week and consolidation with mild upside bias is seen for further gain to 122.25-30, then test of resistance at 122.89, however, a daily close above this level is needed to signal recent entire correction from 124.10 has ended at 114.85, bring further gain to 123.31. Looking ahead, only a sustained breach of 123.31 would retain bullishness and signal early rise from 109.49 low has resumed for retest of 124.10, break there would extend this move to 124.65, then 125.25-30 (50% Fibonacci retracement of 141.06-109.49) but resistance at 126.47 should hold from here.
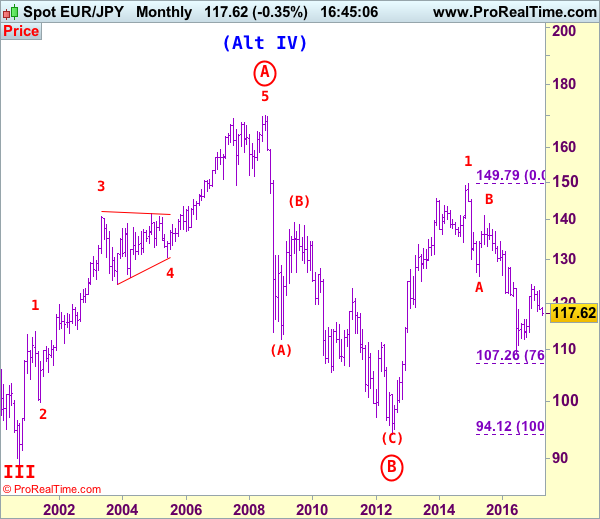
The daily chart is labeled as attached, early selloff from 169.97 (July 2008) to 112.08 is wave (A) of B instead of end of entire wave B and then the rebound from there to 139.26 is wave (B), hence, wave (C) has possibly ended at 94.12 with a diagonal triangle as labeled in the daily chart, hence upside bias is seen for further gain. Recent rally above indicated retracement level at 116.69 (50% Fibonacci retracement of the intermediate fall from 139.26-94.12) adds credence to this view and signal major reversal has commenced but first leg of this wave C has possibly ended at 149.79, hence wave 2 has commenced with wave A ended at 126.09, followed by wave B at 141.06, wave C commenced and could have ended at 109.49, above 125.00 would add credence to this view.
On the downside, whilst initial pullback to 120.00-10 cannot be ruled out, reckon downside would be limited to 119.40-50 and bring another rise later to aforesaid upside targets. Below 118.90-95 would defer and risk weakness to 118.00-10 but only a break below previous resistance at 117.82 would abort and signal top is formed instead, risk weakness to 117.30, then 116.90-00 but support at 116.46 should remain intact.
Recommendation: Buy at 119.50 for 122.00 with stop below 118.50.
To re-cap the corrective upmove from the record low of 88.93 (18 Oct 2000), the wave A from there is subdivided as: 1:88.93-113.72, 2:99.88 (1 Jun 2001), 3:140.91 (30 May 2003), 4:124.17 (10 Nov 2003) and 5 ended at record high of 169.97 (21 Jul 2008). The brief but sharp selloff to 112.08 is viewed as a-b-c x a-b-c wave (A) of B. The subsequent rebound to 139.26 is (B) of B and (C) of (B) has possibly ended at 94.12 and in any case price should stay well above previous chart support at 88.93, bring rally in larger degree wave C towards 150.00.
Draghi Maintains Dovish Stance To Prevent Further EUR Appreciation
No Surprise from Draghi, buy USD
Yesterday ECB rate decision and press conference in our view provided no real surprises. As with the BoJ, the ECB is more confident about the threat to growth outlooks but inflation remains an uncertainty. For any adjustment, we would have expected the ECB to have materially shifted their view on the mid-term inflation outlook. The message was around growth positive with risk retreating “towards a more balanced configuration”. The language used around inflation was basically unchanged. In our view the most obvious modification was Mario Draghi's comment that no debate was held on the ECB's monetary policy stance, which changed slightly from the perceptions in March that early discussions on possible exit strategies were had.
To keep everything neat and tidy, Draghi undoubtedly linked any future decision on monetary policy to inflation forecasts. Given the direction of inflation, we anticipate the ECB will be challenged with a decision to make by September, so Euro bulls will need to wait. Clearly the market was disappointed with Draghi’s avoidance of any suggestion of tapering in the near term. Today 1Q 2017 GDP growth data from the US should highlight marginal slowdown, yet US PCE data should be supportive of Fed expectations. With sustained accommodation from the ECB (and BoJ) and repricing of Fed interest rate path, we should see further EUR (and JPY) selling against the USD as the Fed remains the only G10 central bank in tighten mode.
USD/JPY subject to upside risk
As widely expected, the Bank of Japan held its monetary policy unchanged on Thursday. Its short-term interest rate target was maintained at -0.1%, while the central bank will continue to drive the 10-year JGB yields close to zero. The size of its asset purchase programme was also left unchanged at ¥80 trillion a year. The market was therefore more focused on the BoJ economic outlook, in particular inflation expectations.
The institution revised its GDP growth forecast for fiscal year 2017 to 1.6% compared to 1.5% in January. On the price front, the picture is not that rosy as the BoJ revised its inflation forecast to the downside - headline CPI down to 1.4% y/y from 1.5% - but Governor Kuroda warned it will just be a temporary setback. Obviously, the central bank maintained its optimistic view on the price outlook as it still believes inflation will reach the 2% target through fiscal 2018.
We believe that the BoJ is overly optimistic, especially in regards to the inflation outlook, meaning that we are far from hearing any discussion about tapering any time soon. USD/JPY is still stuck below its 50dma (currently at 111.76) and was treading water at around 111.20 this morning. We believe there is further upside for USD/JPY as rising US rates will soon attract investors again.
Trump trade escalation hype fades
We have seen President Trump fire up the extreme populist platform of protectionism in an attempt, in our view, to score some quick points as his first 100 days milestone approaches. First Trump slapped Canada with up to a 20% tariff on lumber imports, then he forced Canada and Mexico to agree to renegotiate NAFTA. He closed the week threatening to “terminate” Korus, the US-S.Korea trade deal (potentially a tactic to get S.Korea to pay for THAAD). Traders were quick to sell the underlying currencies CAD, MXN and KRW on the escalations in trade tensions. However, as with much of Trump’s actions, we suspect that recent moves will be short-lived as real underlying policy initiatives are unlikely. In the case of Mexico, events in Venezuela should provide a stark warning to the potential effect of destabilizing measures. The Trump administration is unlikely to push Mexico too hard, opting to have a safe, friendly cushion between the US and South America.
MXN has had a difficult time with weaker oil prices and rumours that President Trump has ordered a draft letter to leave NAFTA. The news injected some volatility into MXN as the currency came under significant selling pressure against the USD. Yet, Trump’s sudden reversal from withdrawing from NAFTA to renegotiation should be MXN positive. The partial unwinding of the extreme risks of protectionism will lower concerns that Emerging Markets currencies are heading towards a correction. The MSCI Emerging Market Currency Index is trading just below its two-year high. From a macro perspective, the affirmations that the ECB and BoJ will maintain their accommodating policy for the foreseeable future indicates that risk-taking and yields-seeking behaviour should resume. Given our current view on global conditions, we anticipate MXN will recover lost ground. We anticipate that USDMXN, despite is slightly oversold positioning, will retest 18.50 lows.
USD/CHF Elliott Wave Analysis
USD/CHF – 0.9937
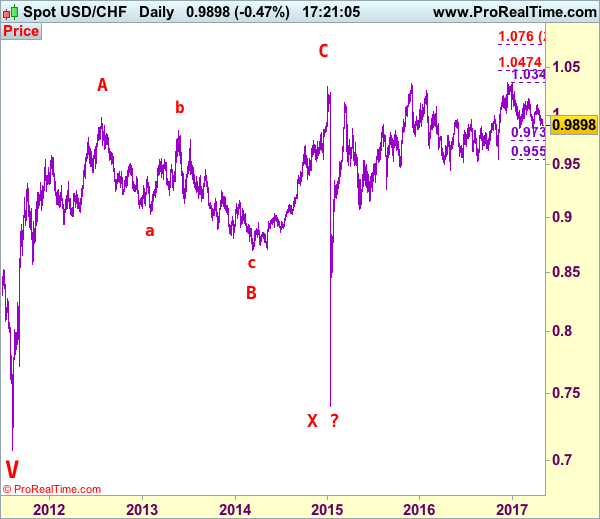
USD/CHF – Wave IV ended at 1.1730 and wave V has possibly ended at 0.7068
Although the greenback has remained under pressure and initial downside risk remains for the retreat from 1.0108 to extend marginal weakness, if our view that low has been formed at 0.9813 is correct, downside would be limited and bring another rebound later, above resistance at 1.0000 would suggest low is possibly formed, bring test of 1.0067, once this level is penetrated, this would signal the retreat from 1.0108 has ended, bring retest of this level, having said that, price should falter below resistance at 1.0171, bring retreat later. In the event dollar breaks above said resistance at 1.0171, this would revive our bullish view for the erratic rise from 0.9861 to extend further gain to 1.0200 and possibly test of resistance at 1.0248, however, a daily close above there is needed to signal the retreat from 1.0344 has ended at 0.9861, bring eventual retest of 1.0344.
Our preferred count on the daily chart is that early selloff to 0.9630 is an end of the larger degree wave III and major correction is unfolding from there with a leg ended at 1.2298 (Nov 2008 with (a): 1.0625, (b):1.0011 and (c):1.2298), wave b ended at 0.9910 with (a): 1.0370, (b): 1.1967, (c): 0.9910. The rise from there to 1.1730 is the wave c which also marked the end of wave IV and wave V has possibly ended at 0.7068.
On the downside, whilst marginal weakness below 0.9890-95 cannot be ruled out, reckon downside would be limited to 0.9850 and bring another rise later. Only below said support at 0.9813 would abort and confirm another leg of major fall from 1.0344 top is underway for further fall to 0.9735-40, however, oversold condition should prevent sharp fall below 0.9675-80 and price should stay well above 0.9600, bring rebound later.
Recommendation: Hold long entered at 0.9905 for 1.0105 with stop below 0.9805
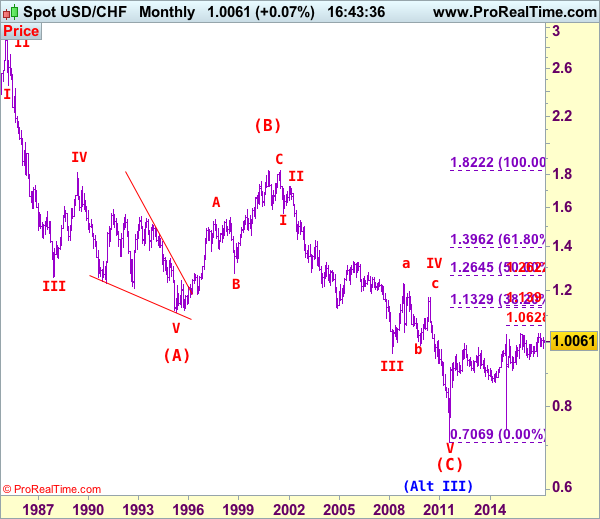
Dollar's long-term downtrend started from 2.9343 (Feb 1995) and it was unfolding as a (A)-(B)-(C) with (A): 1.1100, (B): 1.8310 (26 Oct 2000), then followed by another impulsive wave (C) with wave III ended at 0.9630 (Mar 2008). Under this count, correction in wave IV has possibly ended at 1.1730 and wave V already broke below support at 0.9630 and met indicated downside target at 0.7500 and 0.7400. The reversal from 0.7068 suggests the wave V has possibly ended and the breach of resistance at 0.9595 add credence to this view and indicated upside target at 1.0000 had been met, however, the sharp retreat from 1.0296 to 0.7401 suggests choppy trading would be seen but price should stay above said record low at 0.7068.
EUR/JPY Candlesticks and Ichimoku Analysis
Weekly
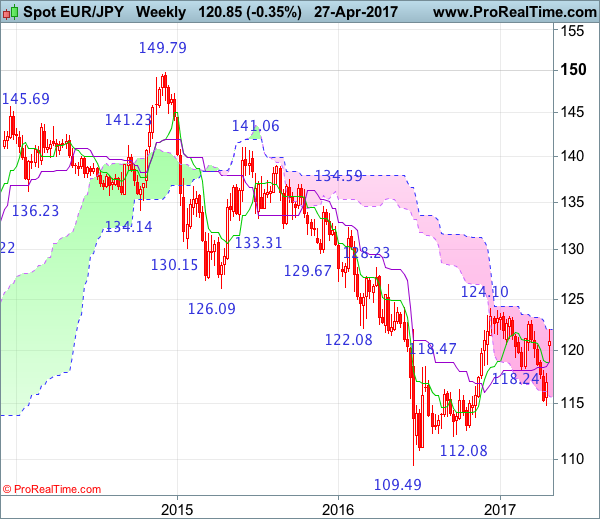
• Last Candlesticks pattern: Hammer
• Time of formation: 19 Sep 2016
• Trend bias: Down
Daily
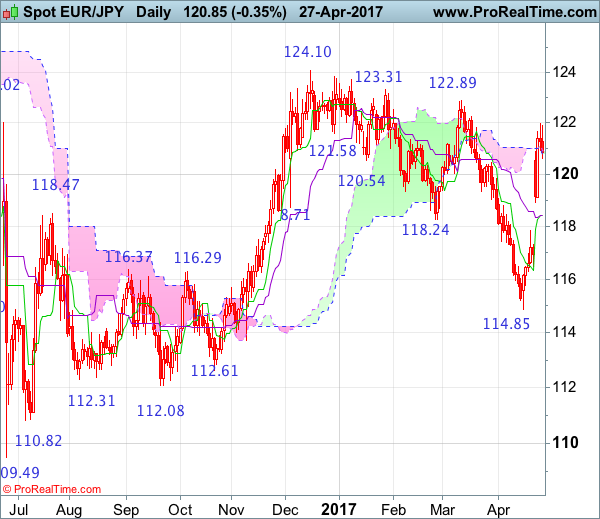
• Last Candlesticks pattern: Doji
• Time of formation: 28 Mar 2017
• Trend bias: Near term up
EUR/JPY – 117.65
The single currency opened sharply higher this week, a large window was formed on the daily chart, signaling low has been formed at 114.85 earlier this month and upside bias is seen for the rebound from there to extend gain to 122.25-30, however, break of resistance at 122.89 is needed to signal recent decline from 124.10 has ended, bring further gain to 123.31 resistance but price should falter well below said recent high at 124.10 (2016 high). Looking ahead, only a break of 124.10 would retain bullishness and extend early upmove from 109.49 low to 125.25-30 (50% Fibonacci retracement of 141.06-109.49).
On the downside, whilst pullback to 120.00-10 cannot be ruled out, reckon downside would be limited to 119.40-50 and 118.90-95 should hold, bring another rise later to aforesaid upside targets. Below the Kijun-Sen (now at 118.42) would suggest a temporary top is formed instead, bring weakness to 117.82 (previous resistance) but still reckon downside would be limited to 117.30-35 and support at 116.45-50 would hold, bring rebound later.
Recommendation: Stand aside for this week.
On the weekly chart, this week’s gap-up opening signals recent decline from 124.10 top has ended at 114.85 earlier this month and consolidation with upside bias is seen for further gain to 122.00-10, then towards resistance at 122.89, however, a weekly close above there is needed to signal the fall rom 124.10 has ended at 114.85, bring further rise to 123.31, then retest of 124.10. Looking ahead, a break of 124.10 would confirm early rise from 109.49 low has resumed and extend gain to 124.85-90 (38.2% Fibonacci retracement of 149.79-109.49), then 125.25-30 (50% Fibonacci retracement of 141.06-109.49) but reckon upside would be limited to 126.00 and 126.45-50 would hold.
On the downside, although pullback to 120.00-10 cannot be ruled out, reckon downside would be limited to 119.40-50 and bring another rise. Below 118.85-95 would defer and suggest top is possibly formed, risk weakness to 118.00 but downside should be limited to previous resistance at 117.82 and bring rebound later. A weekly close below 117.82 would suggest first leg of rebound from 114.85 has ended, bring weakness to 117.00 but price should stay above 116.20-25, bring another rebound later.
USD/CAD Candlesticks and Ichimoku Analysis
Weekly
• Last Candlesticks pattern: Bullish engulfing
• Time of formation: 02 May 2016
• Trend bias: Up
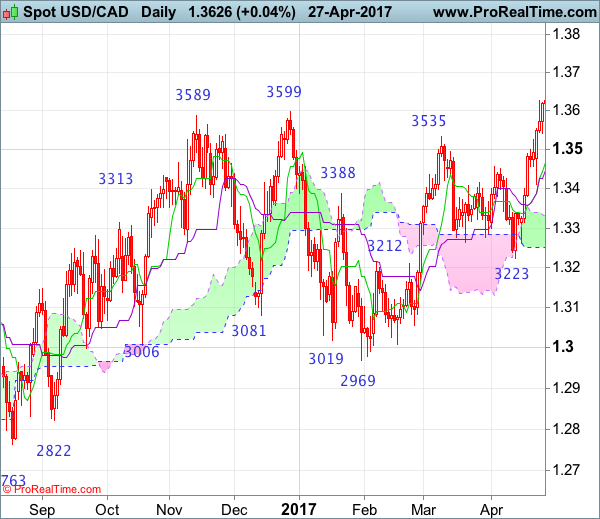
Daily
• Last Candlesticks pattern: Hammer
• Time of formation: 19 Oct 2016
• Trend bias: Up
USD/CAD – 1.3649
The greenback only retreated to 1.3411 early this week (just missed our long entry at 1.3400) before finding renewed buying interest and the subsequent rally above indicated resistance at 1.3535 and 1.3599 adds credence to our bullish view that early erratic upmove from 1.2461 low has resumed and may extend further gain to 1.3700-10, then 1.3750-60 but near term overbought condition should limit upside to 1.3835-40 (61.8% Fibonacci retracement of 1.4690-1.2461) and price should falter below 1.3900, risk from there is seen for a retreat later.
On the downside, whilst initial pullback to 1.3575-80 cannot be ruled out, reckon 1.3530 support would limit downside and bring another rise later. Below the Tenkan-Sen (now at 1.3467) would defer and risk test of the Kijun-Sen (now at 1.3447) but only a daily close below this level would signal top is possibly formed, bring test of support at 1.3411, once this level is penetrated, this would provide confirmation and bring retracement of recent upmove to the upper Kumo (now at 1.3331) but downside should be limited to the lower Kumo (now at 1.3252) and support at 1.3223 should remain intact.
Recommendation: Buy at 1.3500 for 1.3700 with stop below 1.3400.
On the weekly chart, as the greenback has continued moving higher after forming a white candlestick last week and broke above indicated resistance at 1.3535 and 1.3599, adding credence to our view that the erratic upmove from 1.2461 (2016 low) has resumed and bullishness remains for this move to extend headway to 1.3700 and then 1.3770-75, however, reckon upside would be limited to 1.3835-40 (61.8% Fibonacci retracement of 1.4690-1.2461) and 1.3900 should hold, price should falter well below psychological resistance at 1.4000.
On the downside, although initial pullback to previous resistance at 1.3599 and possibly 1.3535 (another previous resistance) cannot be ruled out, reckon downside would be limited to 1.3500 and bring another rise later. A weekly close below support at 1.3411 would defer and suggest top is possibly formed, risk test of the Tenkan-Sen (now at 1.3377) but break of the Kijun-Sen (now at 1.3320) is needed to add credence to this view, bring further fall towards support at 1.3223 which is likely to hold from here.