Sample Category Title
Loonie Trading A Tad Lower, Ahead Of Canada’s GDP Data
For the 24 hours to 23:00 GMT, the USD rose 0.18% against the CAD and closed at 1.3639.
Yesterday, the US President, Donald Trump, pledged to keep the US in the North American Free Trade Agreement (NAFTA).
In the Asian session, at GMT0300, the pair is trading at 1.3642, with the USD trading slightly higher against the CAD from yesterday's close.
The pair is expected to find support at 1.3557, and a fall through could take it to the next support level of 1.3471. The pair is expected to find its first resistance at 1.3699, and a rise through could take it to the next resistance level of 1.3755.
Going ahead, investors will closely monitor Canada's GDP data for February, to gauge strength in the Canadian economy.
The currency pair is trading above its 20 Hr and 50 Hr moving averages.

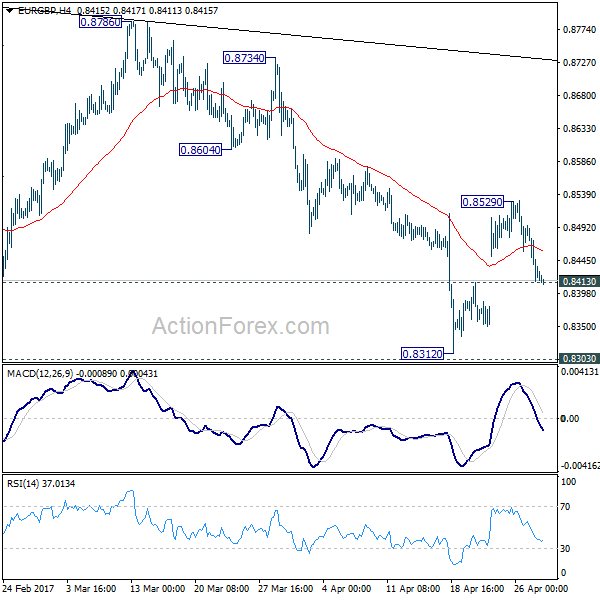
EUR/GBP Daily Outlook
Daily Pivots: (S1) 0.8394; (P) 0.8445; (R1) 0.8474; More...
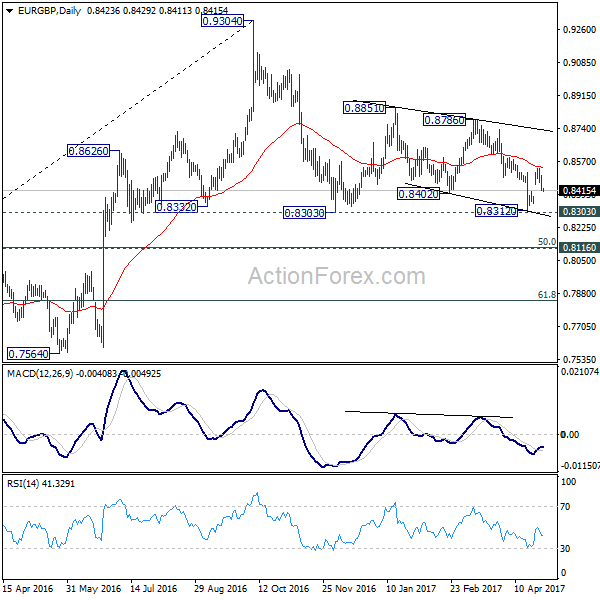
Intraday bias in EUR/GBP is neutral with focus on 0.8413 minor support. Firm break there will suggest that rebound from 0.8312 has completed. And intraday bias will then bias turned back to the downside for 0.8303 support next. Break will extend the correction from 0.9304 high. On the upside, above 0.8529 will extend the rebound form 0.8312 to 0.8786 resistance. Overall, price actions from 0.9304 are seen as a corrective pattern and there is no clear sign of up trend resumption yet.
In the bigger picture, price actions from 0.9304 are viewed as a medium term corrective pattern. In any case, we'd expect strong support from 0.8116 cluster support (50% retracement of 0.6935 to 0.9304 at 0.8120) to contain downside. Rise from 0.6935 (2015 low) will resume at a later stage to 0.9799 (2008 high). However, sustained break of 0.8116 could bring deeper decline to next key support level at 0.7564 before the correction completes.
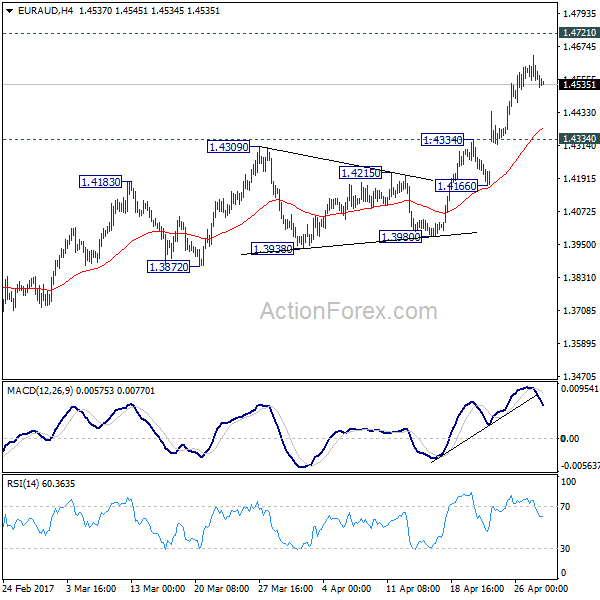
EUR/AUD Daily Outlook
Daily Pivots: (S1) 1.4526; (P) 1.4583; (R1) 1.4617; More...
EUR/AUD continues to lose upside moment, as seen in 4 hour MACD, ahead of 1.4721 key resistance. At this point, further rise is still expected as long as 1.4334 support holds. We're holding on to the case of trend reversal after defending 1.3671 key support. Decisive break of 1.4721 will confirm our bullish view. However, break of 1.4334 will suggest rejection from 1.4721 and turn bias back to the downside for 1.3980 support instead.
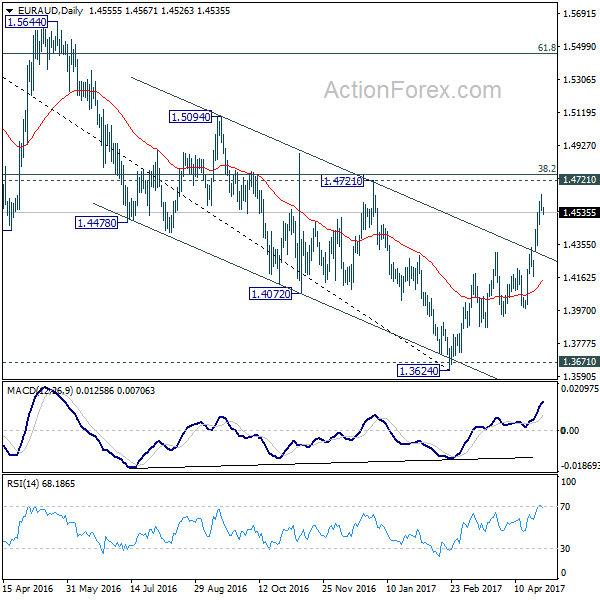
In the bigger picture, price actions from 1.6587 medium term top are viewed as a corrective pattern. Such correction could be completed after defending 1.3671 key support. Break of 1.4721 cluster resistance (38.2% retracement of 1.6587 to 1.3624 at 1.4756) should confirm this case and target 61.8% retracement at 1.5455 and above. Overall, we'd expect the up trend from 1.1602 to resume later. However, sustained break of 1.3671 will invalidate our bullish view and would turn extend the fall from 1.6587 towards 1.1602 long term bottom.
GBPCHF Cruising To Correct Lower In The Near-Term
Key Points:
- Consolidation phase should lead to a reversal shortly.
- Losses could extend to the 1.2465 mark.
- Keep an eye on the fundamentals for any upsets.
The GBPCHF has been experiencing some strong sentiment swings recently which comes as little surprise given the focus on both sides of the quote amid ongoing Brexit and global geopolitical uncertainty. As a result, exactly where the pair is going to end up is currently up in the air to some extent. However, from a technical perspective at least, there are some clues being provided which could be worth taking into account.
For one, we can't ignore the presence of that overarching pennant structure which is likely to cap upsides significantly. Indeed, the upside of the pattern has already been an effective dampener on the GBPCHF's attempts at pushing higher and is likely to remain in place moving forward. As a result, there seems to be little where else to go but down which is, fortunately, in line with a number of other technical instrument biases.
In particular, stochastics are firmly in overbought territory which should see buying pressure mount in the coming days. Additionally, if even a modest dip is seen in the attempt to relieve the oscillator's reading, this will have a flow-on effect and tip the Parabolic SAR and MACD towards bearish which could spark a near-term sell-off for the pair. Combined, this leaves the pair's recent rally in a fairly precarious position which could be eroded should the GBPCHF lose its footing even slightly.
As for how far we can expect to see the pair move in the event of a reversal, currently, expectations are that the 1.2618 or maybe 1.2465 level is tested within a week or so. Whilst the latter of these two would normally be the forecast for the kind of reversal discussed above, the former is shaping up to be a robust zone of support which could limit overall losses. Specifically, it is the point of intersection of not only the 31.8% Fibonacci level and a historical reversal point, but also the 100 day moving average.
Ultimately, we shall simply have to wait and see whether or not technicals or fundamentals take command of the pair over the coming sessions. However, as we can't really predict the fundamentals easily at the moment, the technical bias discussed above should be a good estimate of what to expect moving ahead. Although, remember to keep an eye on any data releases as they can still upset even the most robust of technical patterns.
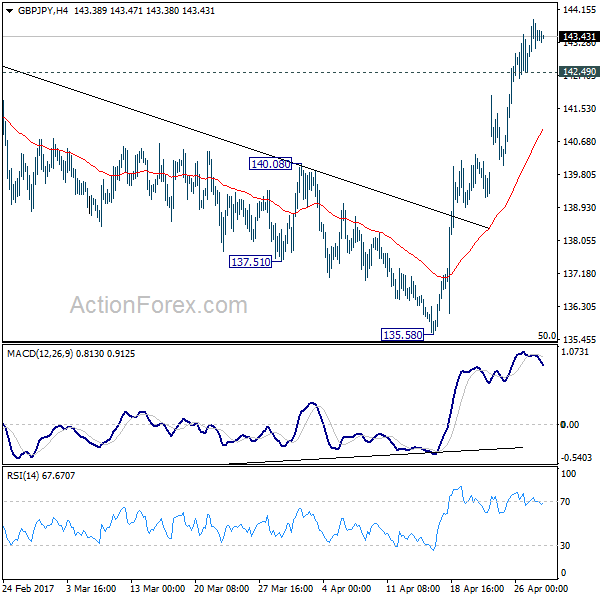
GBP/JPY Daily Outlook
Daily Pivots: (S1) 142.76; (P) 143.32; (R1) 144.12; More....
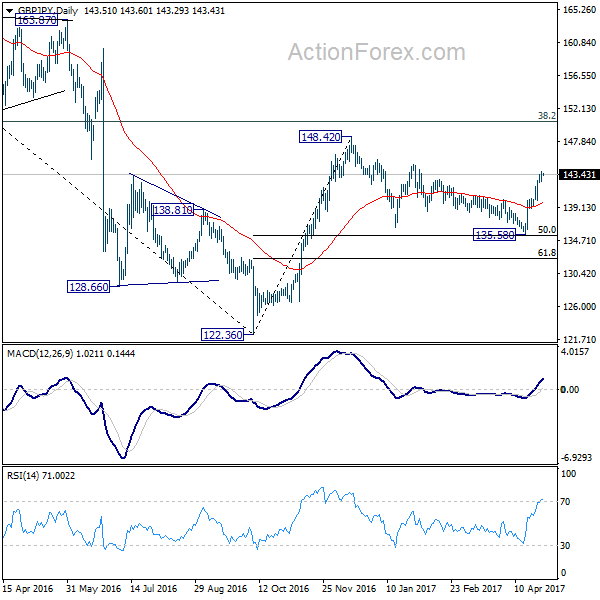
GBP/JPY lost some upside momentum as seen in 4 hour MACD. But intraday stays on the upside with 142.49 minor support intact, for 144.77 resistance. Consolidation pattern from 148.42 should have completed three waves down to 135.58, after hitting 135.39 fibonacci level. Break of 144.77 should extend whole rise from 122.36 through 148.42. On the downside, break of 142.49 will turn bias neutral and bring consolidation before staging another rally.
In the bigger picture, price actions from 122.36 medium term bottom are still seen as a corrective pattern. As long as 50% retracement of 122.36 to 148.42 at 135.39 holds, another rising leg would be seen to 38.2% retracement of 195.86 to 122.36 at 150.42 and possibly above. However, firm break of 135.39 will bring retest of 122.36, with prospect of resuming the larger down trend from 195.86.
EUR/JPY Daily Outlook
Daily Pivots: (S1) 120.40; (P) 121.14; (R1) 121.69; More...
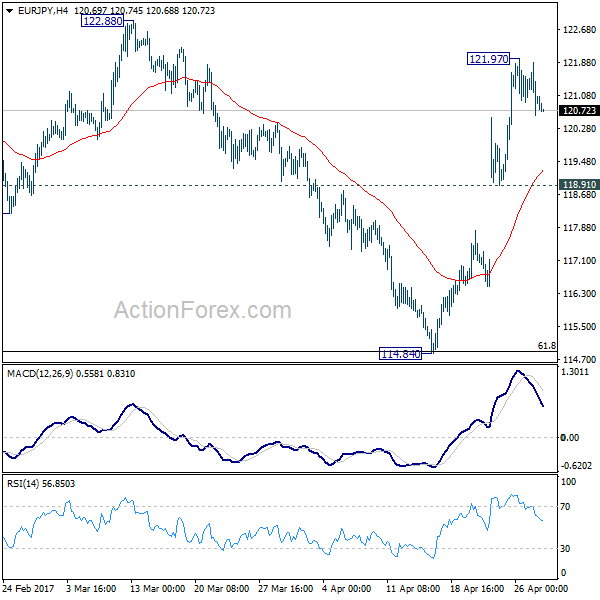
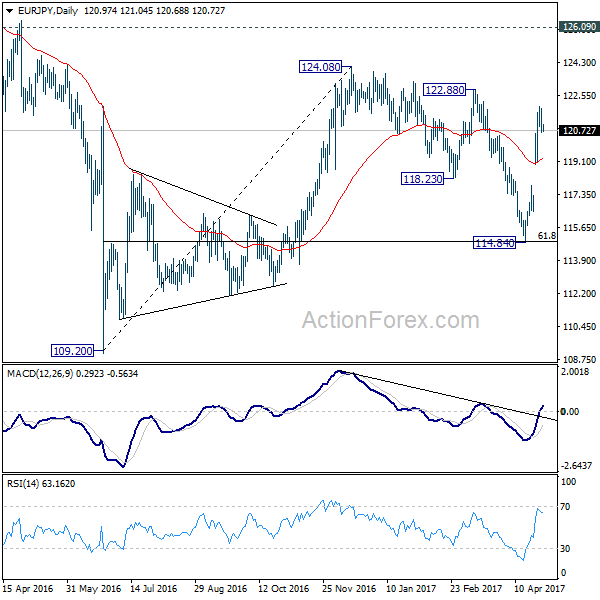
Intraday bias in EUR/JPY remains neutral for consolidation below 121.97 temporary top. Downside is expected to be contained by 118.91 support and bring another rise. Above 121.97 will target 122.88 resistance first. Break will likely resume the larger rally from 109.20. In such case, EUR/JPY should break through 124.08 to 126.09 key resistance level. However, break of 118.91 will turn focus back to 114.84 instead.
In the bigger picture, price actions from 109.20 is still seen as a corrective move for the moment. But current development suggests that the first leg is finished at 109.20, second leg at 114.84. And rise from 114.84 is possibly developing into the third leg. Further rise will now be in favor through 124.08 resistance. Strong break of 126.09 support turned resistance will confirm completion of whole fall from 149.76 at 109.20. In such case, rise from 109.20 is developing into a medium term move for 141.04 and above.
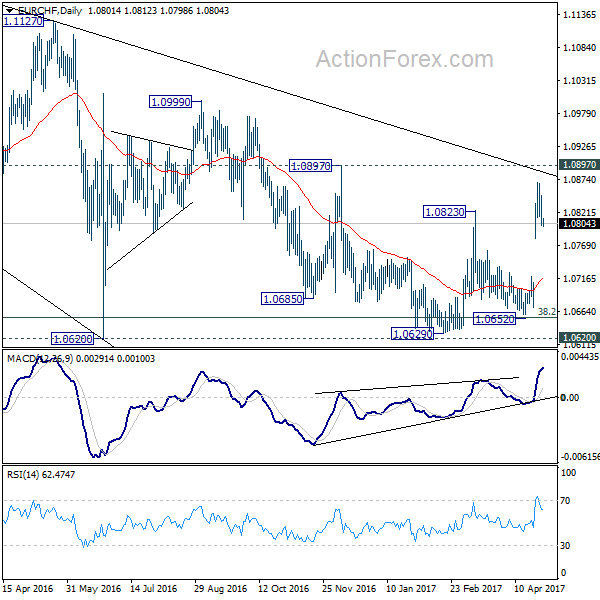
EUR/CHF Daily Outlook
Daily Pivots: (S1) 1.0791; (P) 1.0819; (R1) 1.0838; More...
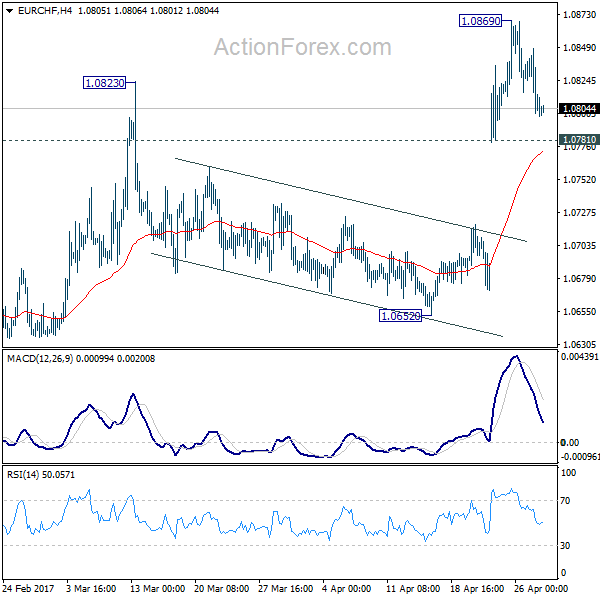
Intraday bias in EUR/CHF remains neutral for consolidation below 1.0869 temporary top. We'd expect downside of retreat to be contained by 1.0781 minor support and bring another rally. Above 1.0869 will target 1.0897 resistance next. Break there will confirm trend reversal. Nonetheless, break of 1.0781 will bring deeper fall back towards 1.0652 support instead.
In the bigger picture, the price actions from 1.1198 are seen as a corrective move. Current strong rebound is raising the chance that it's completed after defending 38.2% retracement of 0.9771 to 1.1198 at 1.0653. Decisive break of 1.0823 resistance will affirm this bullish case. Further break of 1.0999 will target a test on 1.1198 high. For now, this will be the preferred case as long as 1.0652 support holds.
Silver Hits A Key Support Zone And Gets Ready To Rally
Key Points:
- Silver reaches key support zone.
- RSI Oscillator nearing over sold territory.
- Watch for a move towards the $18.62 upside target in the week ahead.
Silver has demonstrated a relatively poor performance over the past few weeks as the metal has come under renewed pressure in light of announcements from the Trump's White House on potential tax breaks for businesses. Subsequently, the bears have poured into the position and the metal is now trading around the significant depressed $17.26 an ounce mark. However, the metal could be about to turn around as some interesting technical indicators appear on the charts.
A quick review of Silver's chart on the daily timeframe shows the recent decline of price action towards what is a relatively strong level of support at $17.08. In addition, the RSI Oscillator is also relatively close to oversold levels, which suggests we may now see a reversal, or at least a period of moderation. Also, the 100 day moving average is just starting to tick lower and is likely to be squeezing the metal's price action in the coming week. Subsequently, there are plenty of technical factors suggesting that we are above to see a bullish leg form for the embattled metal in the near term.
Encouragingly, the metal is also in demand, from a physical point of view, but there appears to be a very real disconnect between the physical and derivative markets. However, there is the ever present risk of additional fiscally conservative action from the Trump administration that is likely to complicate the metal's valuation. In particular, the purported tax cuts could potentially prove to stimulative for U.S. growth and thereby depress Gold and Silver prices. However, at the time of writing this research note the chance of any such cuts passing through congress is limited at best. The reality is these elected representatives are experts at including a variety of loopholes for special interests and any potential tax deal will suffer the same fate.
Ultimately, the technical hypothesis is likely to win out in the near term and this is likely to bring about additional buoyancy for Silver. The most likely scenario is, one of a short period of sideways movement, before we see price action moving back above the 100 day moving average with an upside target of $18.62 an ounce. This is especially prescient given that the current support level that price action is resting upon is a big one. So keep a close watch on Silver over the coming week because we might just be setting up for a significant gain.
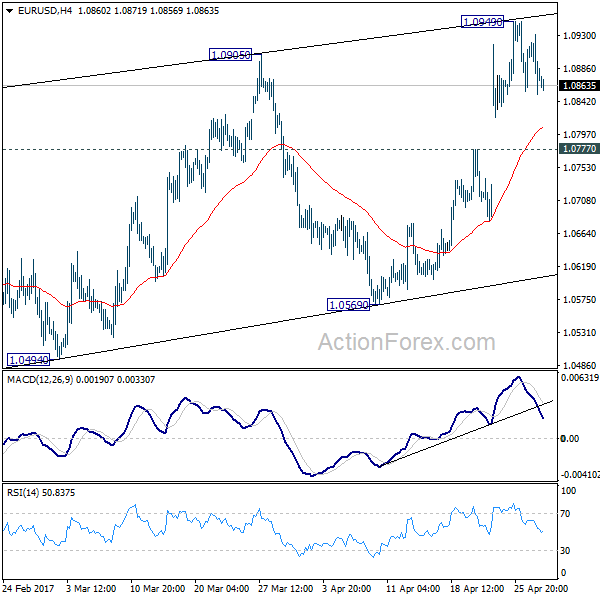
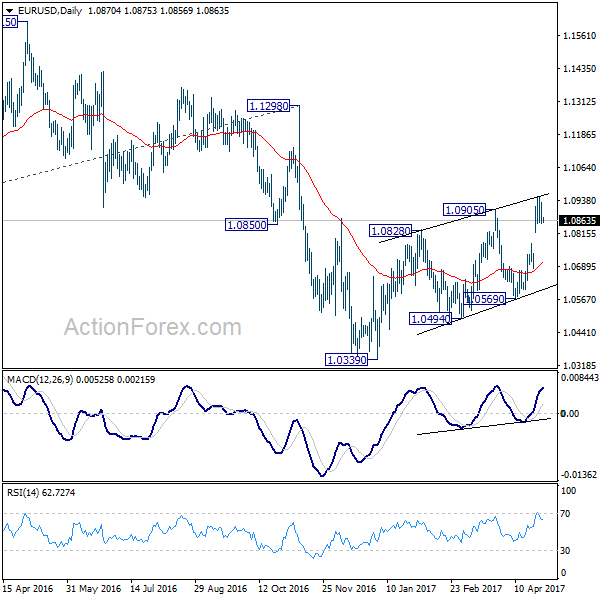
EUR/USD Daily Outlook
Daily Pivots: (S1) 1.0837; (P) 1.0885 (R1) 1.0918; More....
Intraday bias in EUR/USD remains neutral for the moment. At this point, another rise could be seen as long as 1.0777 support holds. But still, rise form 1.0339 is seen as a corrective move. Hence we'd pay attention to topping signal even if EUR/USD rises through 1.0949. On the downside, below 1.0777 minor support will turn bias to the downside for 1.0569 support first.
In the bigger picture, as long as 1.1298 key resistance holds, whole down trend from 1.6039 (2008 high) is still expected to continue. Break of 1.0339 low will send EUR/USD through parity to 61.8% projection of 1.3993 to 1.0461 from 1.1298 at 0.9115. However, considering bullish convergence condition in weekly MACD, break of 1.1298 will indicate term reversal. this would also be supported by sustained trading above 55 week EMA.
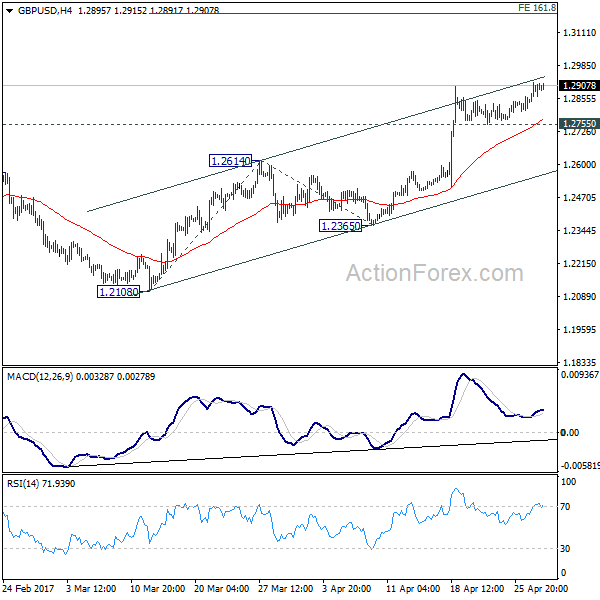
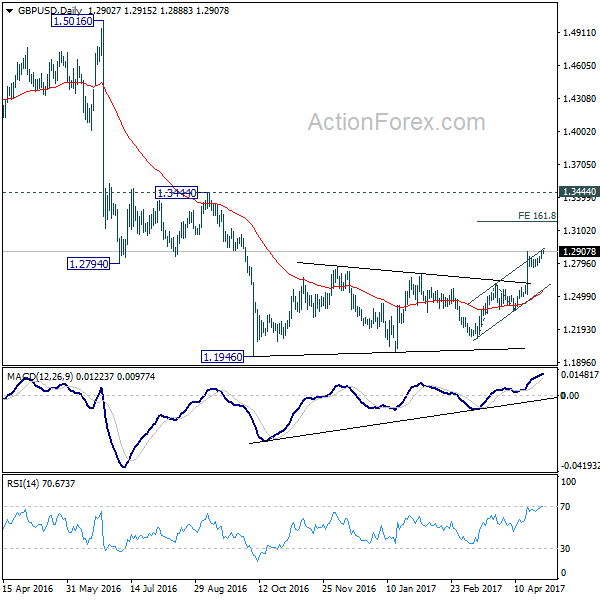
GBP/USD Daily Outlook
Daily Pivots: (S1) 1.2855; (P) 1.2885; (R1) 1.2933; More...
Intraday bias in GBP/USD remains on the upside. Current rise from 1.2108 should target 161.8% projection of 1.2108 to 1.2614 from 1.2365 at 1.3184. At this point, price actions from 1.1946 are still interpreted as a correction pattern. Therefore, we'd expect strong resistance below 1.3444 to bring larger down trend resumption. On the downside, break of 1.2755 minor support will turn bias to the downside. Further break of 1.2614 resistance turned support will now indicate near term reversal.
In the bigger picture, fall from 1.7190 is seen as part of the down trend from 2.1161. There is no sign of medium term reversal yet. Sustained trading below 61.8% projection of 2.1161 to 1.3503 from 1.7190 at 1.2457 will target 100% projection at 0.9532. Overall, break of 1.3444 resistance is needed to confirm medium term bottoming. Otherwise, outlook will remain bearish.