
Sample Category Title
Foreign Exchange Market Commentary: EUR/USD, USD/JPY, GBP/USD, GOLD, WTI CRUDE, DJIA, FTSE100, DAX
EUR/USD
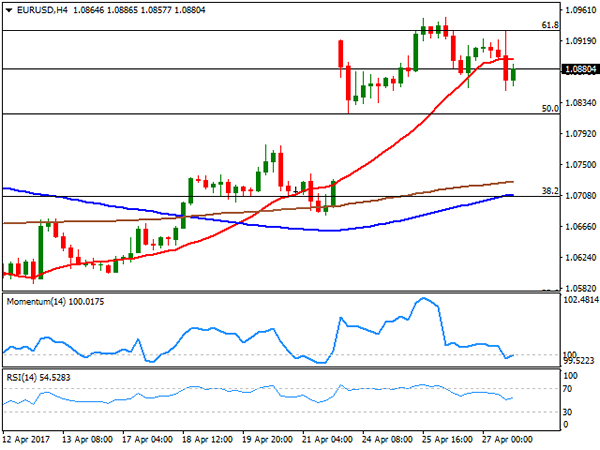
The EUR/USD pair closed the day marginally lower around 1.0880, down for a second consecutive, despite positive macroeconomic data released earlier on the day, as attention centered in the ECB's monetary policy decision. Market players ignored positive figures coming from Germany, where consumer confidence advanced further for May according to the GFK survey, which printed 10.2 against previous 9.8. Inflation in the country is expected to remain flat in April, better than the 0.1% decline forecasted, while yearly basis, is expected to have risen to 2.0% from previous 1.6%. Business sentiment improved in the EU although consumer sentiment remained unchanged at -3.6. As for the ECB, the Central Bank left its monetary policy unchanged, and even indicated confidence in the economic growth, with the risk seen more balanced. The picture however, was not that good for inflation, with policymakers indicating that the accommodative monetary policy will persists amid underlying inflation still being subdued. Additionally, the Central Bank said they did not discuss tapering.
After surging to 1.0932, the pair fell down to 1.0851, as disappointing US data kept the greenback in check across the board. Initial jobless claims rose to 257K worse than the 241K expected in the week ending April 21st, whilst eh goods trade deficit expanded to $65 billion in March. Durable Goods Orders for the same month rose just by 0.7%, missing expectations of a 1.2% advance, while the core figure fell by 0.2%, against the 0.4% forecasted. Finally, pending home sales fell in March by 0.8%, less than market's forecast of a 1.0% decline.
From a technical point of view, the pair continues consolidating its recent gains, although the upward potential has somehow faded, after another failed attempt to surpass the key resistance around 1.0930, the 61.8% retracement of the post-US election slide. The 4 hours chart, shows that the price settled below its 20 SMA for the first time this week, while technical indicators continued retreating, now flat around their mid-lines. Sellers stand in the area between the mentioned Fibonacci resistance and the weekly high of 1.0950, this last the level to surpass to confirm an upward extension, while below the weekly low of 1.0820, the weekly low and another Fibonacci support, the risk will turn towards the downside, with the pair targeting then 1.0730, the unfilled weekly opening gap.
Support levels: 1.0855 1.0820 1.0785
Resistance levels: 1.0910 1.0950 1.1000
USD/JPY
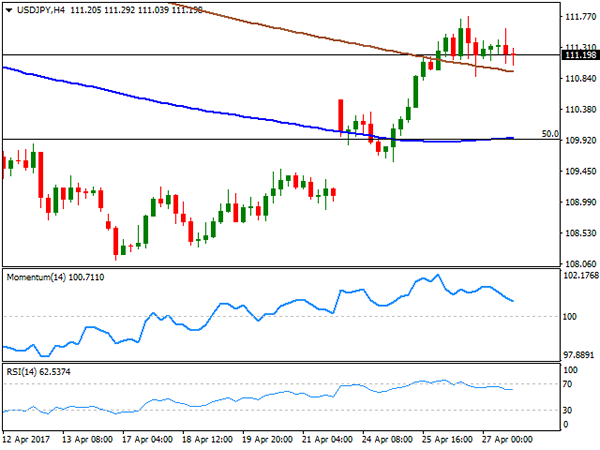
The USD/JPY pair traded uneventfully for a second consecutive day, erasing its intraday gains in the US afternoon, and settling pretty much flat around 111.20. The Bank of Japan monetary policy meeting barely affected the pair, as the ongoing policy was maintained unchanged. Policy makers raised the economic forecast, increasing its real GDP growth forecast for the 2017-18 fiscal year to 1.6% from the 1.5% projected in January, butt lowered its core inflation growth forecast to 1.4% from 1.5% in the same period. The yen found some support on falling US yields, following Draghi's statement, with the 10-year benchmark down to 2.29% from 2.31%. The pair traded within Wednesday's range, lacking directional strength ahead of Friday's opening. Japan will release a batch of first-tier data including National and Tokyo inflation, unemployment, industrial production and retail sales. The 4 hours chart shows that approaches to the 200 SMA continued to attract buying interest, but that the Momentum indicator extended its decline within positive territory, indicating decreasing buying interest. The RSI indicator in the mentioned chart remains flat around 60. The downside potential seems limited as long as the price holds above the mentioned SMA, currently around 110.95, while only beyond 112.00 the pair will be poised to resume its advance.
Support levels: 110.95 110.60 110.20
Resistance levels: 111.60 112.00 112.45
GBP/USD
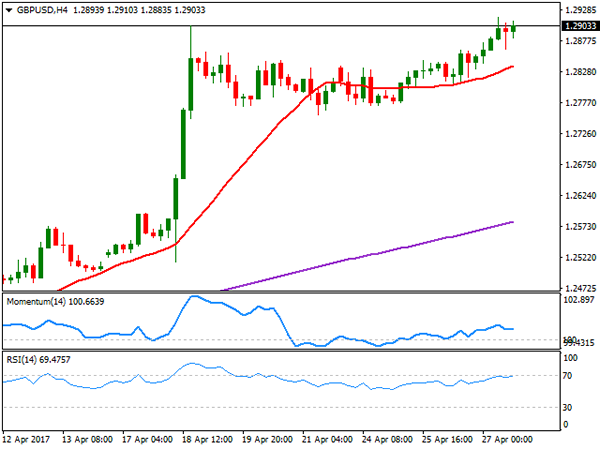
The GBP/USD pair surpassed its previous 2017 by a few pips, printing 1.2916 at the beginning of the European session, and settling above 1.2900. Grinding slowly higher, the absence of first-tier data or fresh Brexit headlines prevented the pair from advancing further, but the outlook remains bullish for the pair, although it will suffer a macroeconomic challenge this Friday, when it will release the first estimate of the Q1 GDP. The economy is expected to have grew by 0.4% in the three months to March, following a 0.7% advance in the previous quarter. In the meantime the pair remains near the mentioned high, and the 4 hours chart shows that the price remains above a recovering 20 SMA, whilst the RSI indicator continues consolidating near overbought levels and the Momentum indicator within positive territory. An acceleration through 1.2920, should favor additional gains, towards 1.2960 first, and up to 1.2710 afterwards.
Support levels: 1.2870 1.2830 1.2795
Resistance levels: 1.2920 1.2960 1.3010
GOLD
The GBP/USD pair surpassed its previous 2017 by a few pips, printing 1.2916 at the beginning of the European session, and settling above 1.2900. Grinding slowly higher, the absence of first-tier data or fresh Brexit headlines prevented the pair from advancing further, but the outlook remains bullish for the pair, although it will suffer a macroeconomic challenge this Friday, when it will release the first estimate of the Q1 GDP. The economy is expected to have grew by 0.4% in the three months to March, following a 0.7% advance in the previous quarter. In the meantime the pair remains near the mentioned high, and the 4 hours chart shows that the price remains above a recovering 20 SMA, whilst the RSI indicator continues consolidating near overbought levels and the Momentum indicator within positive territory. An acceleration through 1.2920, should favor additional gains, towards 1.2960 first, and up to 1.2710 afterwards.
Support levels: 1.2870 1.2830 1.2795
Resistance levels: 1.2920 1.2960 1.3010
WTI CRUDE OIL
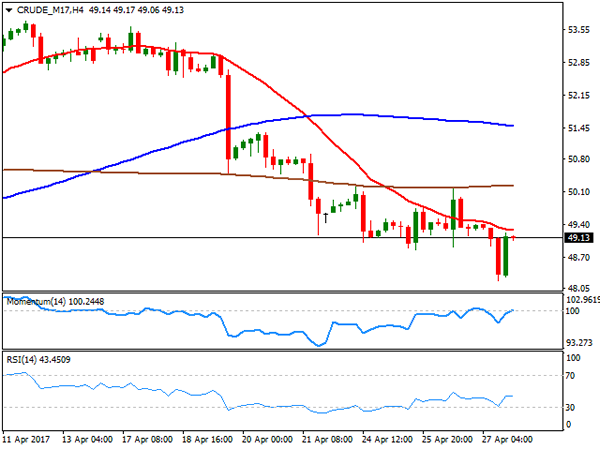
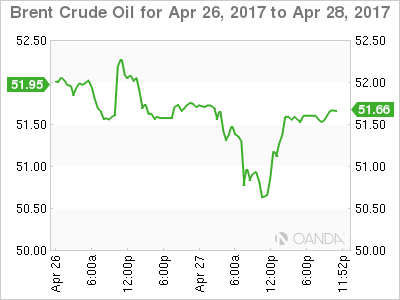
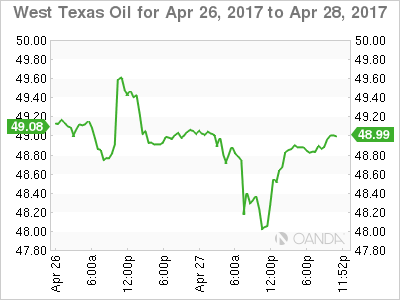
Crude oil prices plunged at the beginning of the day, with West Texas Intermediate crude futures printing a fresh 4-week low of $48.21 a barrel on news that Libya have resumed oil pumping for export in two key oilfields. The commodity, however, trimmed most of its intraday losses ahead of Wall Street's close, ending the day at $49.20 a barrel, as the dollar weakened in the US session following the release of soft local data. WTI retains a negative outlook, as in the daily chart, the price continued developing well below all of its moving averages, whilst technical indicators head south within bearish territory. In the 4 hours chart, the price is also below its moving averages, with the 20 SMA acting as an immediate resistance at 49.30, while technical indicators recovered within negative territory, but pared gains and turned flat around their mid-lines.
Support levels: 48.85 48.20 47.70
Resistance levels: 49.30 49.80 50.30
DJIA
Wall Street posted modest gains this Thursday, with the DJIA up 6 points, to 20,981.33 and the S&P surging by 0.06% to 2,388.77. The Nasdaq Composite out-stood, adding 23 points to 6,048.94, a record close. Amazon released its earnings report right after the close, hitting record highs after a positive statement, although Microsoft edged lower in the same scenario. Within the Dow, Home Depot was the best performer, adding 1.21% followed by Intel that added 1.18%. El du Pont lead declines with a 1.90% decline, followed by Caterpillar that shed 1.73%. Technically, the daily chart for the index shows that indicators lost directional strength within positive territory, but also that it holds above its moving averages, with the risk still towards the upside. In the shorter term, and according to the 4 hours chart, the index is barely holding above a bullish 20 SMA, this last at 20,945, while technical indicators head lower, indicating a possible downward corrective move on a break below the mentioned SMA.
Support levels: 20,945 20,914 20,869
Resistance levels: 21,035 21,071 22,010

FTSE100
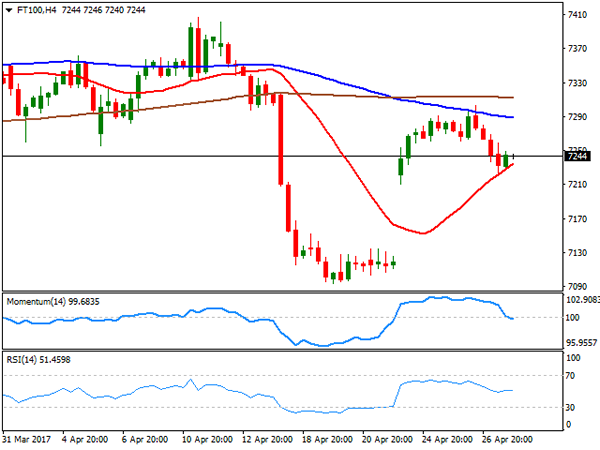
London shares followed the lead of European indexes, with the Footsie down 51 points daily basis to end at 7,237.17, undermined by persistent Pound's strength and weaker base metals. Despite banks were under pressure, Lloyds Banking group was among the best performers, ending the day up 2.31% after a positive earnings report. BHB Billiton led decliners, down 4.75%, followed by Glencore that shed 3.15% and Fresnillo that closed down 2.73%. Daily basis, the index is contained to the upside by a bearish 20 DMA, but holding above a bullish 100 DMA, this last at 7,218, the level to break to see further declines. Indicators in the mentioned time frame hold within negative territory, with the RSI turning modestly lower. In the 4 hours chart, a bullish 20 SMA attracted some short term buying interest, but the recovery has been limited, while technical indicators are biased lower within neutral territory, in line with the longer term perspective.
Support levels: 7,218 7,173 7,126
Resistance levels: 7,259 7,303 7,340
DAX
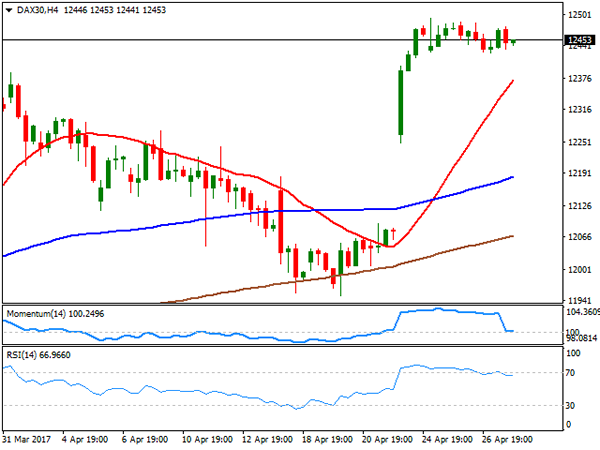
European major benchmarks closed mostly lower this Thursday, with the German DAX settling at 12,443.79, down by 29 points or 0.23%, with banks and automotive shares leading the way lower in the country. Despite an encouraging earnings report, Deutsche Bank plunged at the beginning of the day, ending 3.41% lower amid the increased earnings were achieved on the back of revenues around 9.0% lower, at 7.3 billion Euros. Bayer on the other hand, was the best performer, adding 4.33%. The daily chart shows that the index continued to consolidate at the upper end of its weekly range, maintaining a positive technical outlook given that it remains far above bullish moving averages, whilst technical indicators have resumed their advances within positive territory. In the 4 hours chart, the Momentum retreated towards its 100 level, but the RSI indicator holds around 66 as the 20 SMA maintains a strong bullish slope well below the current level, supporting some additional gains on a break above 12,495, the weekly high.
Support levels: 12,418 12,366 12,312
Resistance levels: 12,495 12,530 12,585
Market Morning Briefing: Almost All Stocks Are Stable And Could Consolidate For A Few Sessions
STOCKS
Almost all stocks are stable and could consolidate for a few sessions. Resistances are visible not very far from current levels and a sharp corrective dip thereafter is possible.
Dow (20981.33, +0.03%) was almost stable yesterday with and is not attempting t rise above 21000.Similarly Dax (12443.79, -0.23%) is also stable near 12500. Both the indices could consolidate for a few sessions and ty to move a little higher to test respective resistances near 21400 and 12600-12700 before coming off from there. However, upside is limited for the near term.
Shanghai (3141.63, -0.33%) could trade within the 3180-3100 region for at least the next 2-3 sessions before deciding the further course of direction. On the 3-day candles support is visible just below 3100 and is expected to hold in the medium term.
Nikkei (19213.09, -0.20%) has potential to test 19620 in the next week in case it breaks above 19300. Thereafter a corrective dip towards 18800 is possible.
Nifty (9342.15, -0.10%) has been slowly moving up towards 9400. Yesterday was a quiet day and we could soon expect a sharp fall in the medium term.
COMMODITIES
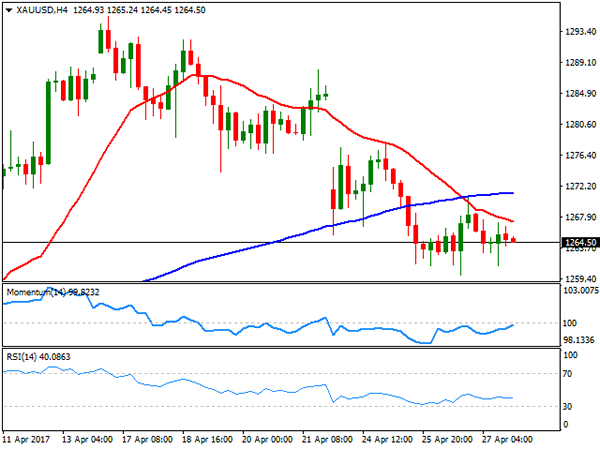
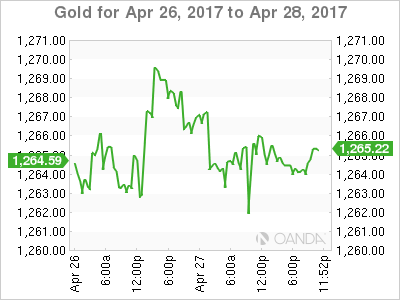
Gold (1266) is trading within the narrow range of 1265-1300.Buyers will take every dip as a further opportunity for buying while it is trading above 1260-65 levels. 1275-80 could be the levels where the price action has to be checked to assess the chances of further bounce to 1305 to 1330 levels.
Silver (17.28) is Oversold and trading within the range of 17-17.45.A close above that could open up 17.80 levels as well. Copper (2.58) has shown some strength as it manages to trade above its crucial support at 2.57. But only above 2.65-67, higher resistances of 2.72 -80 can come into consideration. If copper will manage to close above 2.65 levels then we might see sharp upside rally in silver too.
Muted price action had been seen in Brent (51.74) and WTI (49.31). While we have been expecting a bounce from 51.69 to 53.80 in Brent and 49.31 to 51.50 in WTI and we prefer to wait for higher levels to create fresh short positions.
FOREX
Dollar Index (99.04) still hovers just above the make or break support of 98.50 but requires a rise above 99.35 for a confirmed reversal signal and Euro (1.0867) has again come off the highs after being rejected from the major resistance of 1.0950, keeping open the possibility of a downward correction to 1.0824 and 1.0700.
Dollar-Yen (111.16) is holding below immediate resistance near 112 and could trade in the 112-111 zone for 1-2 sessions before coming off towards 110.50. Immediate support visible near 110 as mentioned yesterday.
Pound (1.2913) has moved up after initial consolidation in the 1.2864-1.27730 region and now while the upward momentum continues, we could see a rise towards 1.30 in the near term.
Aussie (0.7475) is almost stuck near support at 0.7450. ther could be a short bounce towards 0.75 in the next 2-sessions.
Dollar-Rupee (64.19) is trading higher and hovering around its crucial resistance at 64.20/25. It it will hold then we could see trade within the 63.90-64.20/25 region with a possible extension to 64.35. However, a dip towards 63.80 is on the cards possibly next week before a bounce back towards 64.25-35 is expected.
INTEREST RATES
The US yields are down as expected. . The 5Yr (1.82%), 10YR (2.29%) and the 30YR (2.96%) are all down 2bps and looks bearish in the enar term. The 10yr could come down to test 2.20% while the 30Yr may test 2.9% in the coming sessions.
The German-US 2Yr (-2.00%) and the 10YR (-1.99%) has shown some signs of reversal and if it sustains in the coming week, we could see a fall in Euro towards 1.07.
The US-Japan 10YR (2.27%) has fallen and could move towards 2.2% in the near term indicating a slight dip in Dollar-yen and Nikkei in the next 2-3 sessions.
Elliott Wave View: USDCAD Extending Higher
Short term Elliott Wave view in USDCAD suggest the decline to 1.322 ended Intermediate wave (X). The rally from there is unfolding as a double three Elliott Wave structure where Minute wave ((w)) ended at 1.3525 and Minute wave ((x)) ended at 1.3406. Minute wave ((w)) is subdivided as a Flat Elliott wave structure where Minutte wave (a) ended at 1.3338 and Minutte wave (b) ended at 1.3258. Pair is currently within Minute wave ((y)) which is unfolding as a double three Elliott Wave structure where Minutte wave (w) ended at 1.3626 and Minutte wave (x) FLAT ended at 1.3526. Near term, while pullbacks stay above 1.3406, expect pair to extend higher towards 1.3714 – 1.3787 area to end cycle from 4/13 low before a larger pullback in 3 waves can be seen at minimum to correct cycle from 4/13 low. We don’t like selling the proposed pullback.
USDCAD 1 hour Elliott Wave Chart
Oil And Gold Slip Sideways Into Friday
Crude oil staged a dead cat bounce overnight after an initial sell-off, whilst gold flat-lined into Friday.
Both Brent and WTI fell a dollar overnight to make new lows for the week but rebounded aggressively to finish unchanged from Wednesday at 51.50 and 48.90 respectively. Although the talk was of renewed Libyan production, the price action looks suspiciously stop loss driven in our opinion as both broke weekly lows flushing out yet more long-suffering bulls.
Oil’s recovery was probably helped by the International Energy Agency announcing that final investment decisions in new fields had dropped to the lowest level since the 1940’s. That will be a story for another day, more interestingly from a technical standpoint was that both contracts broke their 200-day moving averages intra-day, only to close back then as the New York session ended. Although crude has had something of a dead cat bounce, it may imply we have seen the worst of the sell-off for this week at least.
BRENT
Brent spot opens at 51.50 this morning with support at the 200 DMA at 50.90 followed by the overnight low at 50.0 and then 49.50. Resistance lies just above at 51.80 and then 52.50.
WTI
WTI spot trades at 48.85 with its 200 DMA just below at 48.70, followed by its overnight low at 47.90 and then 46.50. Resistance is just above at 49.00 and then the 50.00 a barrel region.
GOLD
Gold heads into the end of the week with more of a whimper than a roar after a deadly quiet session overnight, closing almost unchanged at 1264.50 where it presently trades in Asia. The price action though continues to suggest that gold is treading water before another move down rather than a rally.
With the world an apparently more certain place, the safe haven bid is dissipating which could slowly but surely erode gold’s pricing premium, and a stronger U.S. dollar against the G10 currencies will not be helping.
From a technical perspective, gold has continued to make lower highs on a daily basis over the last two weeks. Gold has initial support at 1259.50 and then the 200-day moving average at 1253.70. The key support region follows this at 1240, a break of which would imply possibly much lower levels.
Resistance lies at 1270 followed by 1280 and then the April highs at 1295.70.
Aussie To Remain In Offered Mode ?
The Australian dollar caught a bit of a tailwind heading into this morning’s private sector credit and the Purchaser’s Price Inflation Index releases, coming off session lows below .7450 as the market pared back some overnight shorts. But with the overhang from Trump uncertainty weighing on investor sentiment, it remains unlikely the market will take a significant position in either direction more so as next week could offer some challenges for 'yield appeal' with the FOMC on tap.With so much priced out of Fed policy this year, the only real surprise in my view would be a more hawkish lean from the Fed than the market expects.
Australian Q 1 Producer Price Index came in .5% vs .5% expected and year on year 1.3% vs .7 % prior .Private sector credit contracted .3 vs .5 % expected .But with national data taking a back seat to the bigger global picture while focusing on next week’s RBA response to their concerns about the labour markets, we should expect the Aussie to remain in offer mode over the near term.
Waiting in the weeds for regional risk sentiment is how Chinese authorities extend their attempt to tame the China Money Ball and avoid a credit bubble explosion. Overnight the Shanghai interbank overnight rate was nudged to 2.792 % culling liquidity in the interbank markets in their challenge to deleverage an overheated economy
GOLD – Vulnerable, Risk Remains Lower
GOLD - The commodity continues to hold on to its downside pressure on correction. On the downside, support comes in at the 1,260.00 level where a break will turn attention to the 1,250.00 level. Further down, a cut through here will open the door for a move lower towards the 1,240.00 level. Below here if seen could trigger further downside pressure targeting the 1,230.00 level. Conversely, resistance resides at the 1,270.00 level where a break will aim at the 1,280.00 level. A turn above there will expose the 1,290.00 level. Further out, resistance stands at the 1,300.00 level. All in all, GOLD looks to weaken further.
USD/JPY Daily Support Flips To Resistance
Thank god it's Friday.
Back in March, the Fed certainly failed to bring USD/JPY longs into play as we were watching for, but the higher time frame support level remains in play.
USD/JPY Daily:
As you can see when you compare the daily chart above to that on the previous blog that I've linked to in the 2nd paragraph, it's all about this particular higher time frame support/resistance level.
A key aspect to these major levels is not that they have been broken, but the way in which they've been broken. Take a look at how price had serious momentum behind it when it broke down through the level.
It was then retested from the bottom as resistance where it held and essentially reactivated.
USD/JPY 15 Minute:
Zooming into an intraday chart, it's always the same. Look for a short term pullback where previous support could turn to resistance in the direction of the higher time frame level.
Something else to keep in mind is that this USD/JPY trade is similar to the EUR/JPY trade that we spoke about earlier in the week.
Ringgit Weekly Wrap Up
It was an excellent week for the Ringgit as the regional tone, despite the overhang from Geopolitical concerns, has remained buoyant while risk sentiment rocketed higher follow the French Elections first ballot. Investors are likely to feed on this supportive environment for riskier assets, and local investors sentiment should remain supportive following the second round of elections. I say this with caution as the markets will continue to tussle with the plethora of Trump headlines, which could buckle confidence at any moment.
There has been a definite shift in sentiment after the BNM’s timely move to increase liberalisation in the foreign exchange markets. After last month’s massive volume of MGS bond outflows, the writing was on the wall, and the BNM made tremendous efforts to reassure foreign investors that Malaysia was indeed open for business and was actively moving to greater liberalisation of onshore market. It seems to have worked, as outflows have dropped to a trickle while the currency has shown signs or appreciating.
Also, the lead weight from the 1MDB scandal that rocked investor confidence back in 2015 appears to be coming to an investor friendly conclusion. Malaysia’s finance ministry and 1MDB had agreed to pay $1.2 billion to the Abu Dhabi fund by the end of the year as part of an agreement overseen by an arbitration panel in London.
Next week could offer some challenges with the FOMC on tap. With so much priced out of Fed policy this year, the only real surprise in my view would be a more hawkish lean from the Fed than the market expects. But with the likelihood of only two rate US rate hikes this year, I don’t think this will pose too much of concern to local sentiment and in particular, the Malaysia capital market which is arguably undervalued compared to its ASEAN counterparts.
While I expect the all too familiar oil markets balancing act to remain front and centre, one of the negatives I view for the Ringgit is that there remains a risk for weaker oil prices as we move through 2017 due to constant supply coming from shale oil producers.
At the end of the day, investor positioning in the MYR is light, which suggests that the Ringgit has room to strengthen palpably by next week; even more so if USD momentum loses steam on underwhelming Trump policy.
A Trainwreck Waiting To Happen
A Trainwreck waiting to happen
The sheer volumes of political noise, Trump uncertainty, and central bank musings has ground down investor sentiment in this battle-worn week for the currency markets. Despite all the noise overnight, the overall impact has been relatively mute, in spite of surging volumes with the ECB fall out, which generated the lion's share of the day trader volume. On the broader spectrum, longer term players were reluctant to aggressively test the water as restraint upstaged bravado in this extremely muddled landscape.
Political Front
NAFTA remains an extremely touchy topic and despite Trump's about face, I suspect we have not heard the last word on this subject. The Canadian dollar underperformed the rest of the commodity currency bloc due to lingering trade concerns and another slide in WTI.
The Stop Gap bill appears stuck in the mud as the Republicans, despite controlling the majority in both house and senate, are again and again relying on the Democrat vote as the Conservative hardliners are in constant opposition to even the most common sense spending proposal.
As for Obamacare, well that only adds to the confusion as it remains uncertain whether Speaker Paul Ryan will bring a revised health care reform bill to Congress for a vote today.
Central Banks
ECB: Draghi focused on the unchanged inflation landscape; short-term interest rates buckled and the EURO slid to an overnight low of 1.0855.
BOJ: At some point, the BOJ is expected to slow the pace of JGB purchases, but with inflation remaining stubbornly below 2%, we are still a bit off from that time. While currency concerns are not within the BoJ overall purview, but the Yen's near to medium term tangent will likely be determined by interest rate differentials. The BoJ will be doggedly cautious to avoid any language that could be confused as an adjustment in monetary easing.
Australian Dollar
The plethora of headlines generated by the Trump administration has produced very choppy trading in the Commonwealth currencies. Commodity currencies were again dragged through the mud as the AUD hit a four-month low, trading in sympathy with the Canadian Dollar as the US protectionist viewpoint continues to rear its ugly head. Whether it's softwood lumber, aluminum or take your pick, it looks like downside momentum could carry on, as the fears of US protectionism are not leaving the airwaves anytime soon.
Japanese Yen
Expect a headline driven trade to dominate, as both the Healthcare train wreck and Stop Gap debacle fill the airwaves. Look for short-term gaps and quick nature liquidation to continue, but as trader headline fatigue set in, level heads may opt for the sidelines.
USD/CAD Canadian Dollar Lower Despite Trump Giving Nafta A Shot
The Canadian dollar was lower on Thursday when it touched daily and weekly lows after the Trump administration retracted on comments in was working on an executive order to pull out of NAFTA. Trump said that after talking to the president and prime minister of Mexico and Canada he decided to give the renegotiation route a shot. The US dollar is still rising after a lukewarm reception of the Trump tax reform outline and the hope the government avoiding a shutdown.
There was no economic releases in Canada and the US had a mixed session with the core durable goods miss to be the most relevant as it could signal an economic slowdown that could be verified on Friday when the US releases the GDP for the first quarter. The market consensus already is pricing in a slowdown but being the first estimate there can still be surprises for investors.
The oil supply disruption ended in Libya as the two key oilfields are back online putting pressure on the price of crude. The Organization of the Petroleum Exporting Countries (OPEC) production cut agreement stabilized prices, but the rise in shale production still puts supply ahead of demand. The extension on the deal is expected to happen in May, but it all hinges on Russia who agreed to it last time, but it will take some persuasion from Saudi Arabia for the nation to commit a second time.
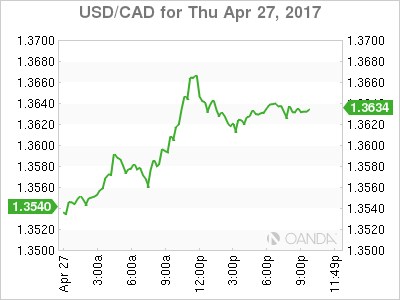
The USD/CAD gained 0.1 percent in the last 24 hours. The pair is trading at 1.3671 after the Trump administration walked back their comments about tearing up the NAFTA treaty. The loonie has recovered from daily lows of 1.3671 but is still trading near those levels which are also weekly lows for the loonie.
The Toronto Stock Market (TSX) was hit as the Home Capital Group saga continues. The alternative lender has been in trouble for the past two years, but as housing concerns keep pointing to a bubble in prices the trouble for the company could be signalling an end to rising prices. The firm has approached banks in an apparent attempt at a sale as its stock price has plunged by 60 percent following the news it had secured a 2 billion line of credit after there was a $591 million drop in high interest saving accounts. in the past month.
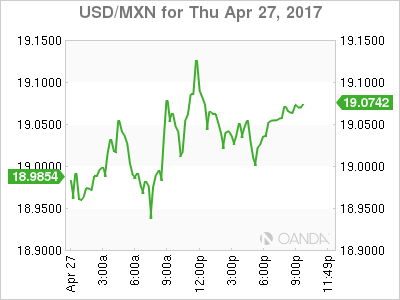
The USD/MXN lost 0.888 percent on Thursday. The pair is trading at 19.0211 after the Trump administration said it will the NAFTA treaty a good strong shot, before pulling the plug completely. This is a reversal from Wednesday’s rumblings of an executive order being drafter to terminate the US involvement in the deal. Trump says he reached that decision after calls with the Mexican president and the Canadian prime minister. The peso gained after the plans to renegotiate NAFTA replaced the idea of tearing it down outright. There is still the legal question if Trump could unilaterally end the deal, as it was implemented through legislation. The fact that the trade agreement has winners and losers in all three nations means that it could prove unpopular in some US states who could lose direct investment.
Market events to watch this week:
Friday, April 28
4:30am GBP Prelim GDP q/q
8:30am CAD GDP m/m
8:30am USD Advance GDP q/q