
Sample Category Title
EUR/CHF Daily Outlook
Daily Pivots: (S1) 0.9293; (P) 0.9318; (R1) 0.9366; More....
EUR/CHF's break of 0.9343 resistance confirms resumption of rebound from 0.9204. Intraday bias stays on the upside for 100% projection of 0.9204 to 0.9343 from 0.9254 at 0.9393. Firm break there could prompt upside acceleration to 0.9444 resistance next. On the downside, below 0.9329 minor support will turn intraday bias neutral again first.
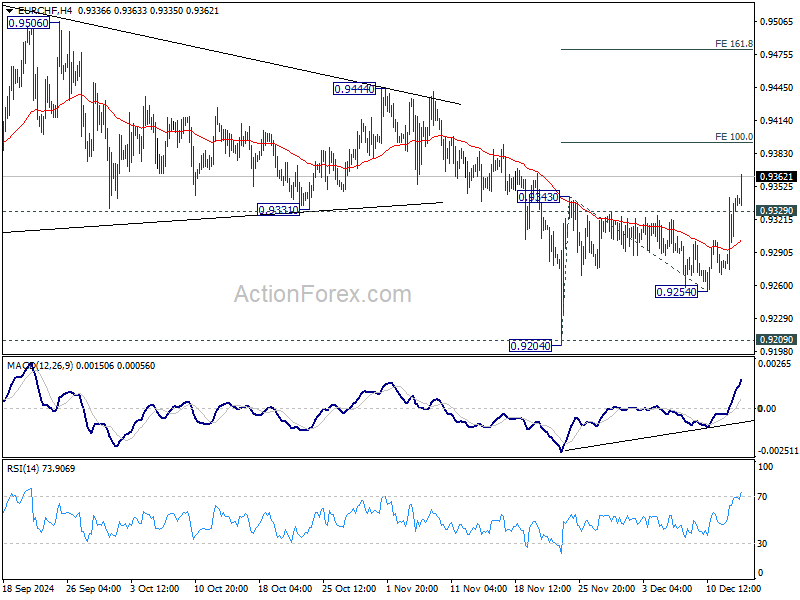
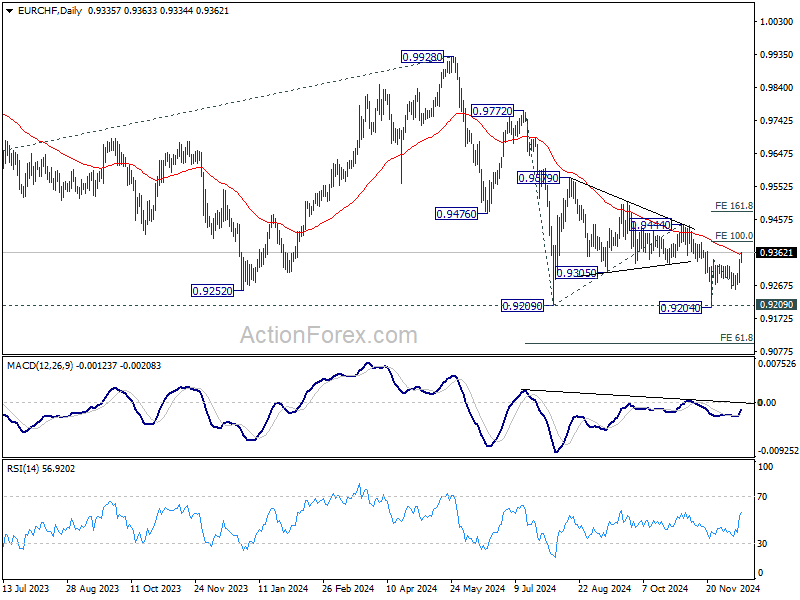
In the bigger picture, outlook will stay bearish as long as 0.9444 resistance holds. Decisive break of 0.9209 low will resume long term down trend to 61.8% projection of 0.9772 to 0.9209 from 0.9444 at 0.9096 next. Nevertheless, firm break of 0.9444 will be the first sign of bullish trend reversal.
USD/CAD Daily Outlook
Daily Pivots: (S1) 1.4159; (P) 1.4194; (R1) 1.4256; More...
USD/CAD's rally resumed after brief consolidations and intraday bias is back on the upside. Current rise is part of the larger up trend and should target 1.4391 projection level. On the downside, below 1.4119 support will turn intraday bias neutral again and bring consolidations again, before staging another rally.
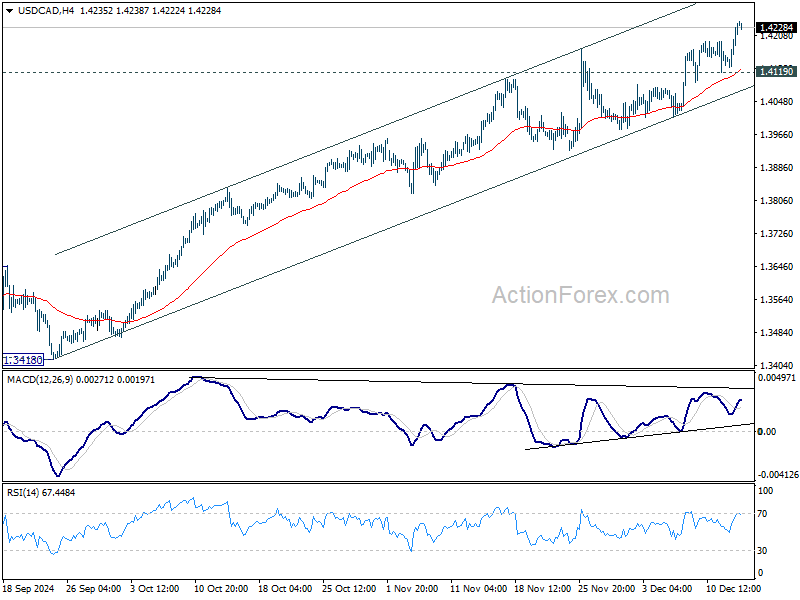
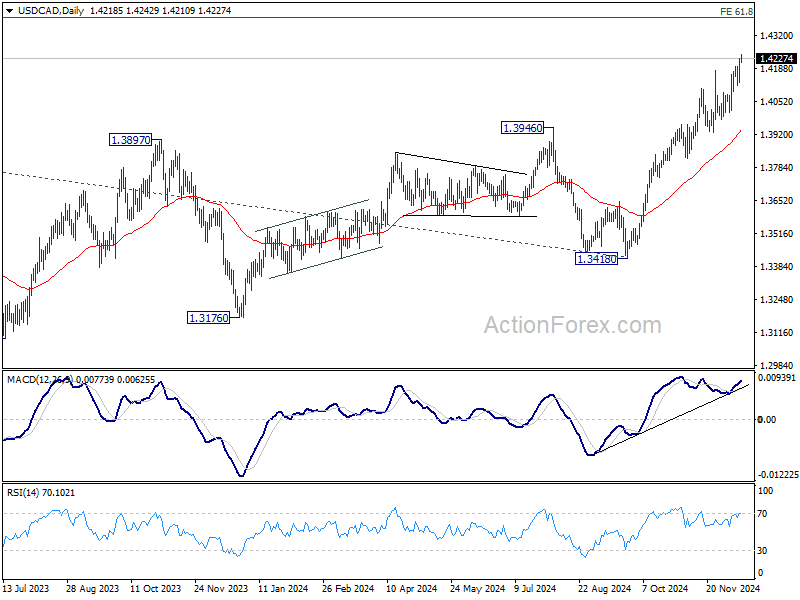
In the bigger picture, up trend from 1.2005 (2021) is in progress. Next target is 61.8% projection of 1.2401 to 1.3976 from 1.3418 at 1.4391. Now, medium term outlook will remain bullish as long as 1.3418 support holds, even in case of deep pullback.
AUD/USD Daily Report
Daily Pivots: (S1) 0.6343; (P) 0.6386; (R1) 0.6411; More...
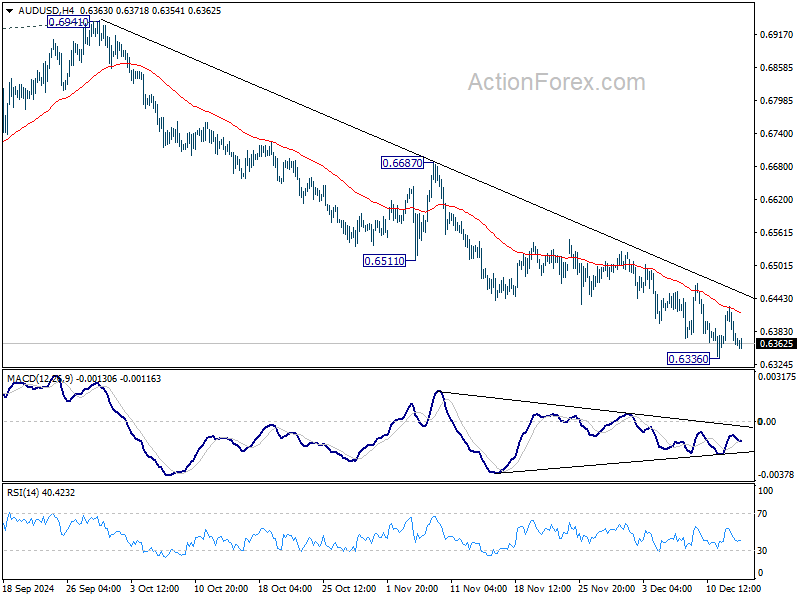
Intraday bias in AUD/USD remains neutral as consolidation continues above 0.6336 temporary low. While another recovery cannot be ruled out, outlook will stay bearish as long as 55 D EMA (now at 0.6546) holds. Break of 0.6336 will resume the fall from 0.6941 to 0.6269 support next.
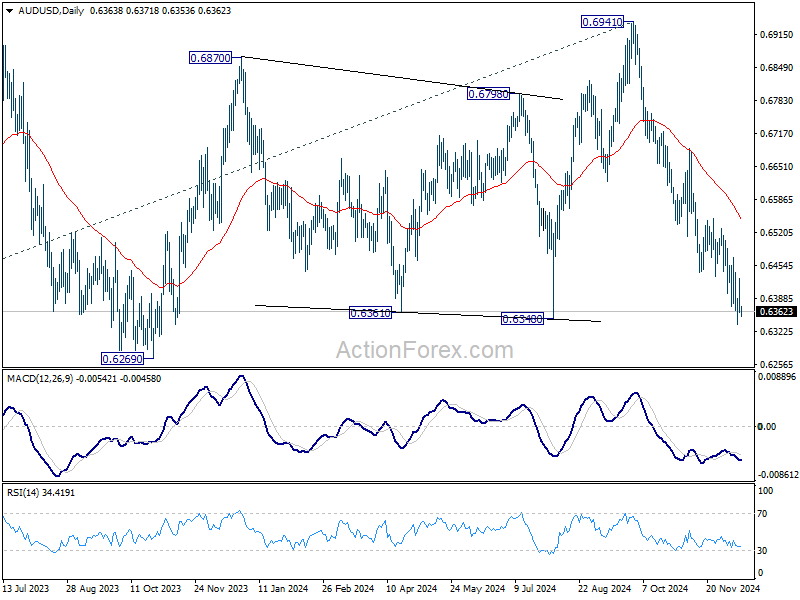
In the bigger picture, price actions from 0.6169 (2022 low) are seen as a medium term consolidation to the down trend from 0.8006. More sideway trading could be seen above 0.6169, but overall outlook will stay bearish as long as 0.6941 resistance holds. Firm break of 0.6169 will resume the down trend to 61.8% projection of 0.8006 to 0.6169 from 0.6941 at 0.5806 next.
USD/JPY Daily Outlook
Daily Pivots: (S1) 152.05; (P) 152.41; (R1) 153.03; More...
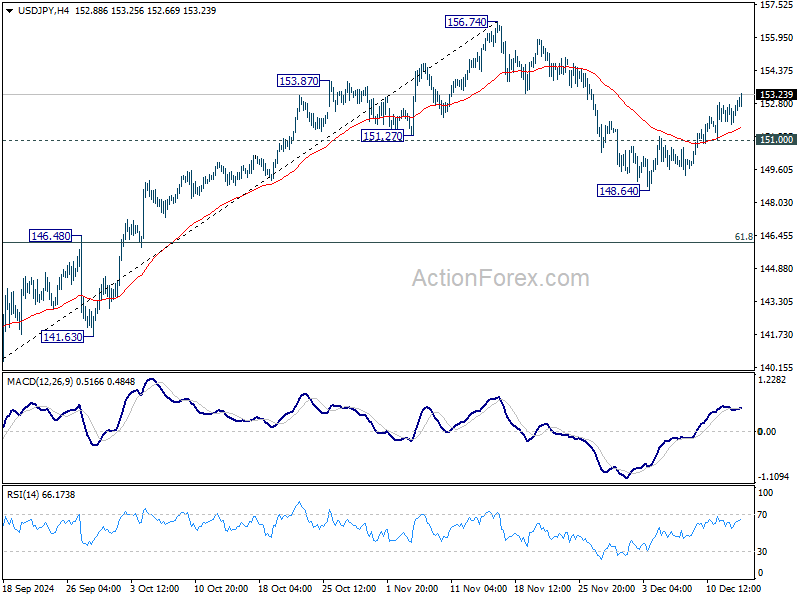
Intraday bias in USD/JPY remains on the upside for retesting 156.74 resistance. Current development suggests that rise from 139.57 might still be in progress and break of 156.74 will confirm resumption. On the downside, below 151.00 minor support will turn intraday bias neutral first. But risk will stay on the upside as long as 148.64 support holds, in case of retreat.
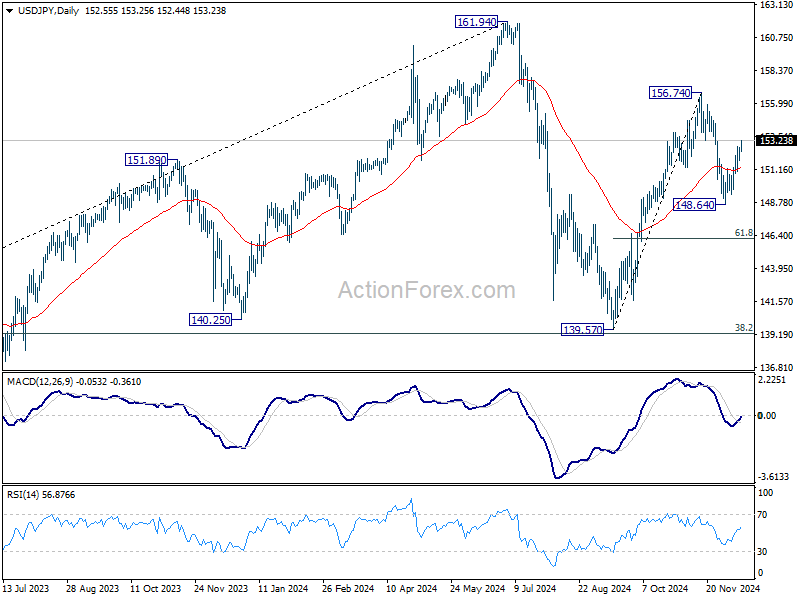
In the bigger picture, price actions from 161.94 are seen as a corrective pattern to rise from 102.58 (2021 low). The range of medium term consolidation should be set between 38.2% retracement of 102.58 to 161.94 at 139.26 and 161.94. Nevertheless, sustained break of 139.26 would open up deeper medium term decline to 61.8% retracement at 125.25.
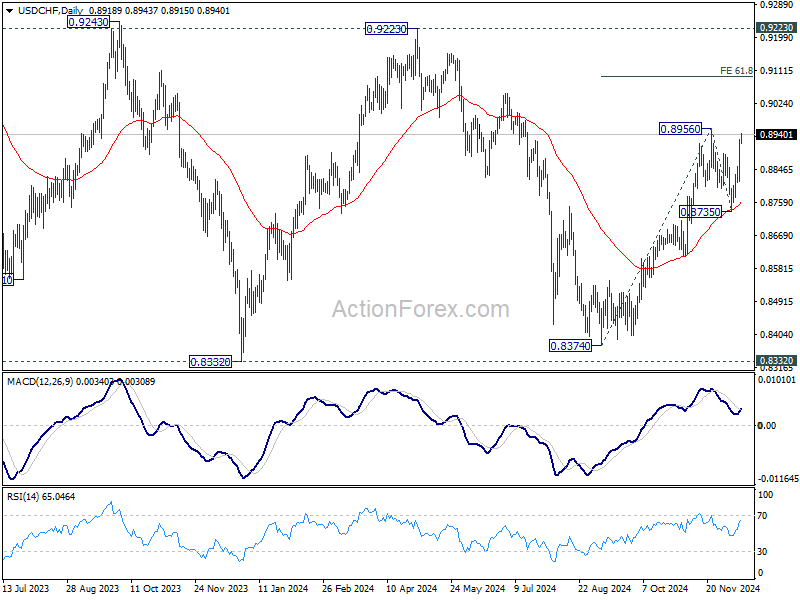
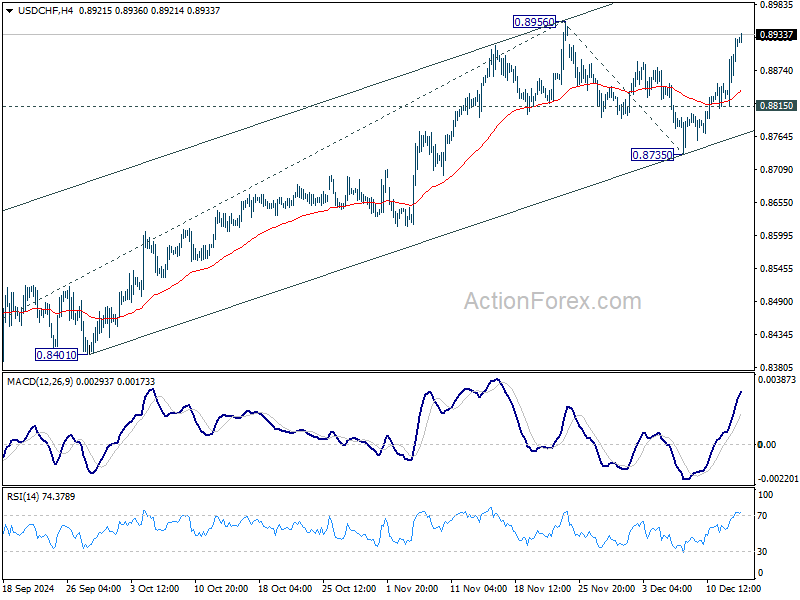
USD/CHF Daily Outlook
Daily Pivots: (S1) 0.8851; (P) 0.8890; (R1) 0.8962; More…
USD/CHF's rally is in progress and intraday bias stays on the upside. Firm break of 0.8965 resistance will resume the whole rally from 0.8374. Next target is 61.8% projection of 0.8374 to 0.8956 from 0.8735 at 0.9095. On the downside, below 0.8853 minor support will turn intraday bias neutral first. But risk will stay on the upside as long as 0.8735 support holds, in case of retreat.
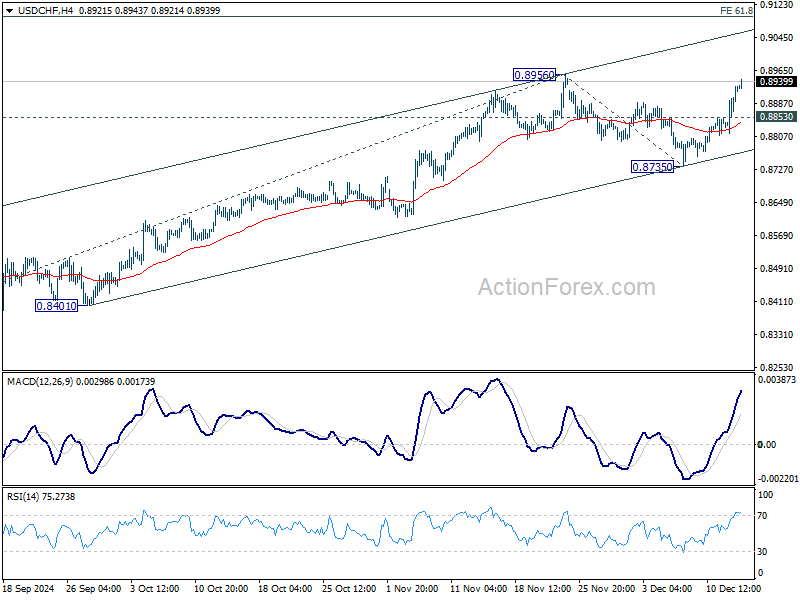
In the bigger picture, price actions from 0.8332 (2023 low) are currently seen as a medium term corrective pattern, with rise from 0.8374 as the third leg. Overall outlook will continue to stay bearish as long as 0.9223 resistance holds. Break of 0.8332 low is in favor at a later stage when the consolidation completes.
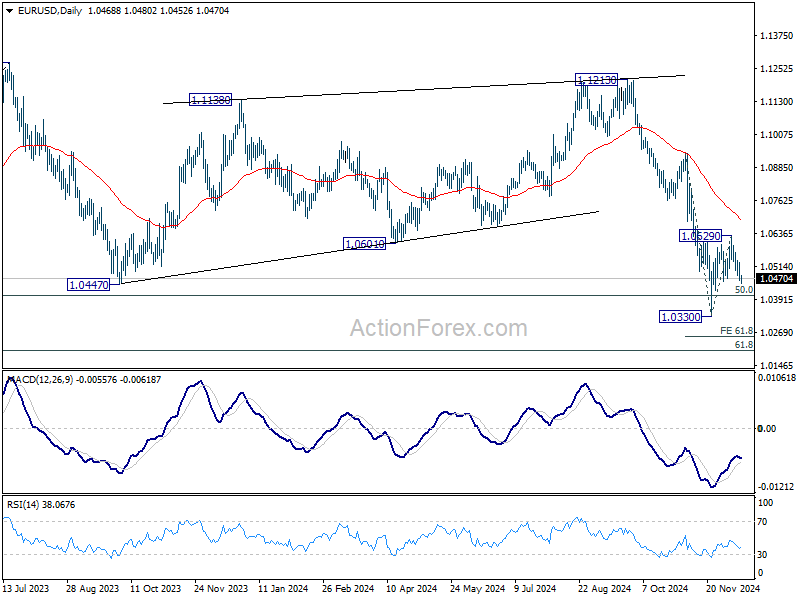
EUR/USD Daily Outlook
Daily Pivots: (S1) 1.0443; (P) 1.0487; (R1) 1.0510; More...
Break of 1.0471 support suggests that EUR/USD's corrective recovery from 1.0330 has completed at 1.0629 already. Intraday bias is back on the downside for retesting 1.0330 low first. Firm break there will resume the fall from 1.1213 to 61.8% projection of 1.0936 to 1.0330 from 1.0629 at 1.0254. Also, in this case, sustained trading below 1.0404 key fibonacci level will carry larger bearish implication. For now, risk will stay on the downside as long as 1.0629 resistance holds, in case of recovery.
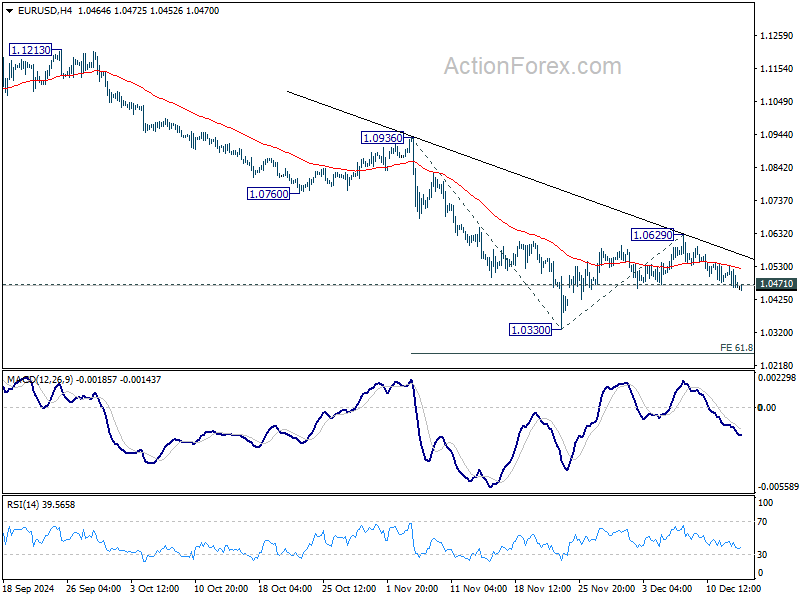
In the bigger picture, focus stays on 50% retracement of 0.9534 (2022 low) to 1.1274 at 1.0404. Strong rebound from this level will keep price actions from 1.1273 (2023 high) as a medium term consolidation pattern only. However, sustained break of 1.0404 will raise the chance that whole up trend from 0.9534 has reversed. That would pave the way to 61.8% retracement at 1.0199 first. Firm break there will target 0.9534 low again.
GBP/USD Daily Outlook
Daily Pivots: (S1) 1.2631; (P) 1.2710; (R1) 1.2752; More...
Sterling's extended decline today suggests that corrective rebound from 1.2486 has completed at 1.2810 already. Immediate focus is now on 1.2615 minor support. Firm break there will bring retest of 1.2486 first. Break there will resume whole decline from 1.3433 to 1.2298 cluster support zone.
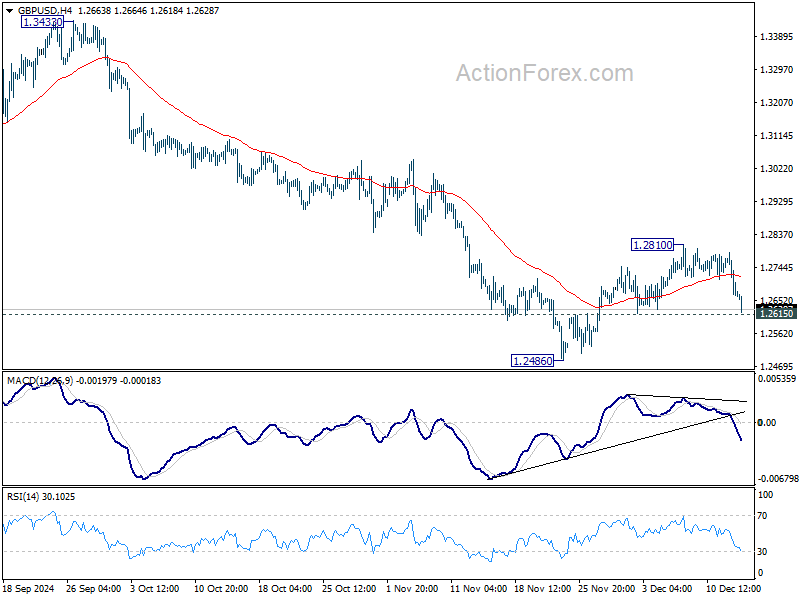
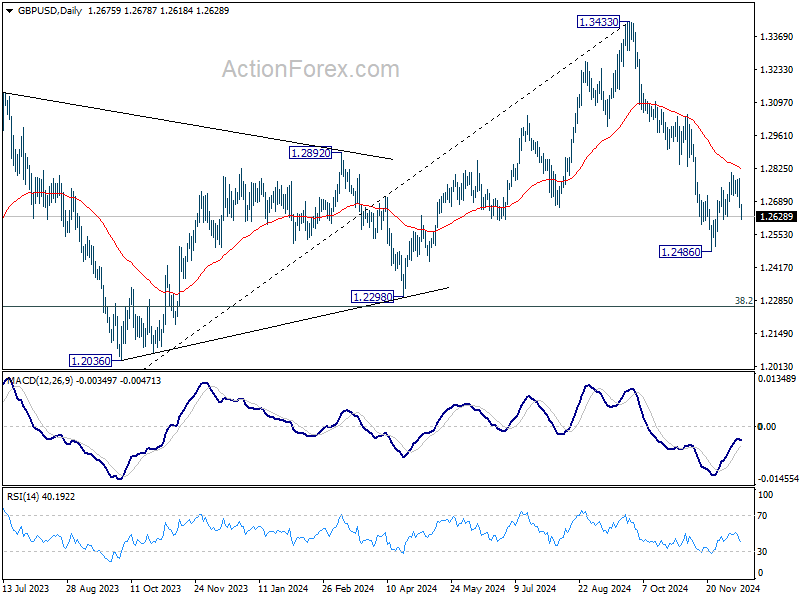
In the bigger picture, price actions from 1.3433 medium term are seen as correcting whole up trend from 1.0351 (2022 low). Deeper decline could be seen to 38.2% retracement of 1.0351 to 1.3433 at 1.2256, which is close to 1.2298 structural support. But strong support is expected there to bring rebound to extend the corrective pattern.
Sterling Drops on Surprise UK GDP Contraction, Dollar Strengthens
Sterling slumped broadly today after UK GDP unexpectedly contracted in October, missing forecasts of modest growth. This contraction underscores the challenges facing the UK economy, which has been grappling with persistent inflation and uncertainty following the Autumn Budget. The government’s recent pledge to transform the UK into the fastest-growing G7 economy now seems even more "ambitious". While BoE is expected to keep interest rates unchanged at next week’s meeting, deteriorating economic conditions could challenge expectations of four rate cuts in 2025, particularly if the growth outlook weakens further.
Meanwhile, Dollar surged overnight, supported partly by the dovish 25bps rate cut by ECB and stronger-than-anticipated US PPI data. 10-year Treasury yield climbed above the 4.3% mark, reflecting worries over ongoing inflationary pressures. Coupled with recent CPI data showing a plateau in disinflation, Fed remains on track for a pause in its rate-cutting cycle after this month’s expected 25bps reduction. The path of rate easing next year looks more set to be gradual, with terminal rates potentially higher than previously anticipated, reinforcing support for the greenback.
So far this week, Dollar has emerged as the strongest performer, followed by Australian Dollar, which drew strength from surprisingly robust employment data. Canadian Dollar ranks third. At the other end of the spectrum, Japanese Yen is the weakest, with limited reaction to the Tankan Survey data released today. Swiss Franc and New Zealand Dollar also underperformed, while Euro and Sterling occupy a neutral middle ground.
Technically, Dollar is gaining bullish momentum again with break of 1.0471 minor support in EUR/USD. Retest of 1.0330 should be seen next. To solidify Dollar's momentum, some more progress will be needed including breaking of 1.2615 minor support in GBP/USD, 0.6336 support in AUD/USD, and 0.8956 resistance in USD/CHF.
In Asia, Nikkei fell -0.95%. Hong Kong HSI is down -1.82%. China Shanghai SSE is down -2.01%. Singapore strait times is up 0.16%. Japan 10-year JGB yield fell -0.0083 to 1.043. Overnight, DOW fell -0.53%. S&P 500 fell -0.54%. NASDAQ fell -0.66%. 10-year yield rose 0.053 to 4.324.
UK economy contracts -0.1% mom in Oct, dragged down by weak production
UK GDP fell by -0.1% mom in October, disappointing expectations for 0.1% mom growth. The decline was primarily driven by a -0.6% mom contraction in production output, with no growth observed in services and a -0.4% mom decline in construction output.
On a rolling three-month basis, GDP showed a marginal increase of 0.1% in the period ending October, compared to the prior three-month period. This modest growth was supported by a 0.1% expansion in services and a 0.4% rise in construction output. However, production output contracted by -0.3%, weighing on overall performance.
Japan's Tankan Survey: Manufacturing Confidence Improves to 14
Confidence among Japan’s major manufacturers showed a modest recovery in Q4, breaking a two-quarter decline. The Tankan large manufacturing index rose to 14 from 13, slightly exceeding market expectations. However, the outlook dipped marginally from 14 to 13, though still better than the anticipated 11.
In contrast, the non-manufacturing sector, which includes services, saw its index decline to 33 from 34, marking the first deterioration in two quarters. The outlook for non-manufacturers held steady at 28.
On a bright note, large Japanese companies across sectors plan to boost capital expenditure by 11.3% in the fiscal year ending March 2025. This is a notable increase from the 10.6% projection in the September survey and surpasses market forecasts of 9.6%.
NZ BNZ PMI falls to 45.5, 21st month of contraction
New Zealand’s BNZ Performance of Manufacturing Index dipped from 45.7 to 45.5 in November, marking its lowest reading since July 2024 and extending the contraction streak to 21 consecutive months. Despite some improvement in select components, the sector remains under significant strain, highlighting the challenges of achieving a meaningful turnaround.
Production weakened further, dropping from 44.0 to 42.5, signaling continued struggles in output. New orders also plunged from 48.5 to 44.8, underlining the persistent lack of demand. In contrast, employment improved modestly from 46.0 to 46.9, and finished stocks edged higher from 47.8 to 49.3. Deliveries saw the most notable recovery, rising from 44.9 to 49.9, yet still narrowly missed returning to expansion territory.
The sentiment among respondents remains predominantly negative, with 56% of comments in November reflecting pessimism, slightly up from 53.5% in October. Recurring concerns revolve around weak order volumes and the enduring pressures of high living costs. However, this negativity has moderated from its peak of 71.1% in mid-2024, suggesting some stabilization.
Doug Steel, Senior Economist at BNZ, noted that while manufacturers are beginning to show improved confidence about the future, “the main message of a manufacturing sector still under significant pressure remains. There is scant evidence of a general turnaround in activity to date.”
GBP/USD Daily Outlook
Daily Pivots: (S1) 1.2631; (P) 1.2710; (R1) 1.2752; More...
Sterling's extended decline today suggests that corrective rebound from 1.2486 has completed at 1.2810 already. Immediate focus is now on 1.2615 minor support. Firm break there will bring retest of 1.2486 first. Break there will resume whole decline from 1.3433 to 1.2298 cluster support zone.
In the bigger picture, price actions from 1.3433 medium term are seen as correcting whole up trend from 1.0351 (2022 low). Deeper decline could be seen to 38.2% retracement of 1.0351 to 1.3433 at 1.2256, which is close to 1.2298 structural support. But strong support is expected there to bring rebound to extend the corrective pattern.
UK economy contracts -0.1% mom in Oct, dragged down by weak production
UK GDP fell by -0.1% mom in October, disappointing expectations for 0.1% mom growth. The decline was primarily driven by a -0.6% mom contraction in production output, with no growth observed in services and a -0.4% mom decline in construction output.
On a rolling three-month basis, GDP showed a marginal increase of 0.1% in the period ending October, compared to the prior three-month period. This modest growth was supported by a 0.1% expansion in services and a 0.4% rise in construction output. However, production output contracted by -0.3%, weighing on overall performance.
Keeping Up With the Central Banks
This week has been rich in terms of interest rate cuts from major central banks. The Reserve Bank of Australia (RBA) didn’t cut its rates but gave an unexpectedly dovish statement, citing that the RBA officials are turning more confident that inflation is on path toward their policy goal. The Bank of Canada (BoC) delivered a second 50bp cut in a row, following three 25bp cuts before that. Then, the Swiss National Bank (SNB) delivered a 50bp cut – it was not the base case scenario but it was not a surprise, either. The SNB has recently stepped up efforts to counter the franc’s appreciation, especially given the accelerated selloff in the euro since Trump’s election which pulled the EURCHF down to the lowest levels on record. The EURCHF rebounded after the SNB decision, the USDCHF also made a significant move to the upside and the SMI gained. The aggressive messaging from the SNB – warning that it could go negative on rates if it is needed – will hopefully help the franc lose field in the coming months. But one thing is certain, the SNB should remain more dovish than its peers to give the franc the opportunity to weaken without intervention. Otherwise, the global political and geopolitical uncertainties will continue to play in favour of the franc. What a problem to have!
Elsewhere, the European Central Bank (ECB) also cut, but the European officials decided to go ahead with a cautious 25bp cut before Xmas, and Lagarde didn’t say much about what the ECB would do in the next meetings. She stuck to the ‘data dependence’ rhetoric. But, still, the ECB lowered its growth and inflation forecasts – reviving hope of back-to-back cuts next year – but not too much either as Lagarde highlighted that inflation has come down but remains strong and that risks to inflation remains high. She talked about geopolitical risks that could boost energy prices and climate risks that could boost food prices. She didn’t mention Trump, she rather said that the euro zone countries should consider Mario Draghi’s innovation booster plan to give the European economies a boost. She is right but the Europeans have bigger problems today, they should first get their leadership issues right. Anyway, the ECB decision and Lagarde’s speech had a hawkish flavour yesterday, the Stoxx 600 index closed slightly down.
The EURUSD fell, however, but the selloff was mostly explained by a higher-than-expected US PPI print that landed just between the ECB decision and Lagarde’s press conference. The data showed that the producer price inflation in the US ticked higher to 3% in November, up from 2.6% printed a month earlier and expected by analysts. But the surge in egg prices was one of the major drivers. As such, the November reading was interpreted as being ‘probably less informative (and threatening) on the overall trend’ than the headline figure suggested. Nonetheless, the US 2-year yield advanced past the 4.20%, the major equity indices gave back gains and the US dollar jumped – the rise of the dollar was also due to the weakening yuan after the Chinese authorities said this week that they would let the yuan weaken to boost exports, and due to rate cuts from other major central banks throughout this week. As a result, the dollar looks stronger this Friday than it looked last Friday. The probability of a 25bp cut slightly eased but activity on Fed funds futures continues to asses a very comfortable 96% probability for an additional 25bp cut that the US probably doesn’t need in December. But it’s probably too late to turn for the gigantic Fed ship a few days before their next decision – they only do that when it’s a dovish surprise. But the chances of a January cut are melting by the day, and that’s supportive of the US dollar. As such, the ECB’s cautious tone could slow down the euro’s depreciation but will not stop it if the Fed expectations turn more hawkish at the beginning of next year. The EURUSD fell yesterday to 1.0460, Cable was lower too, on the back of a broadly stronger US dollar, and the USDJPY is flirting with the 153 level this morning as traders are scaling back their Bank of Japan (BoJ) rate hike bets for next week. Still, around 60% of economists in a recent Reuters poll think that a 25bp hike is still on the menu of the December meeting – an expectation that should limit the USDJPY’s upside potential into 155.