
Sample Category Title
USD/JPY Daily Outlook
Daily Pivots: (S1) 108.85; (P) 109.17; (R1) 109.63; More....
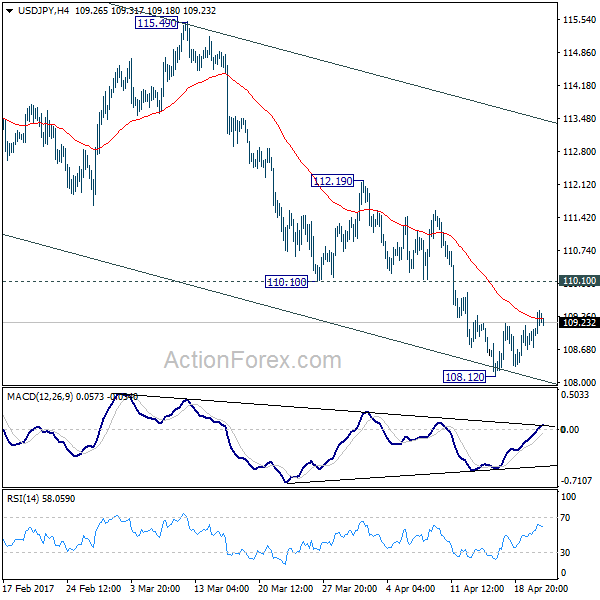
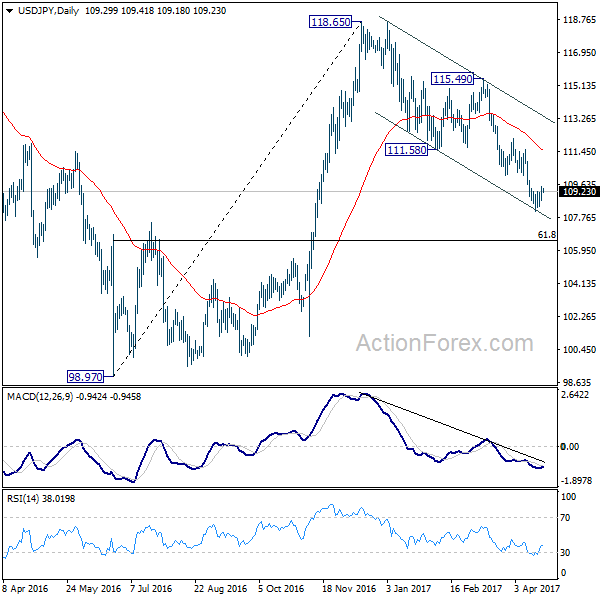
USD/JPY's consolidative trading from 108.12 is still in progress and intraday bias stays neutral. With 110.10 resistance intact, near term outlook remains bearish. Rise from 98.97 is finished at 118.65 and fall from there would extend. On the downside, break of 108.12 will target 61.8% retracement of 98.97 to 118.65 at 106.48. Sustained break there will pave the way back to 98.97 low. Nonetheless, break of 110.10 will be the first sign of near term bottoming and turn bias back to the upside for 112.19 resistance instead.
In the bigger picture, price actions from 125.85 high are seen as a corrective pattern. Current development suggests that it's not completed yet and is extending. In case of deeper decline, downside should be contained by 61.8% retracement of 75.56 to 125.85 at 94.77 to bring rebound. Rise from 75.56 is still expected to resume later after the correction from 125.85 completes.
USD/CHF Daily Outlook
Daily Pivots: (S1) 0.9954; (P) 0.9971; (R1) 1.0001; More.....
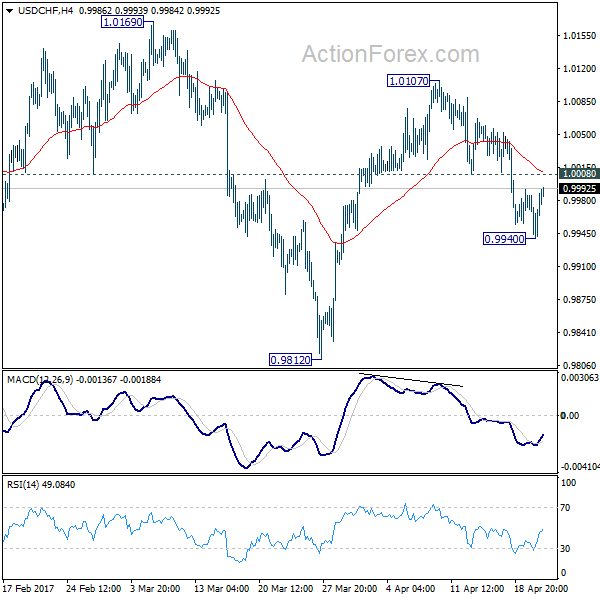
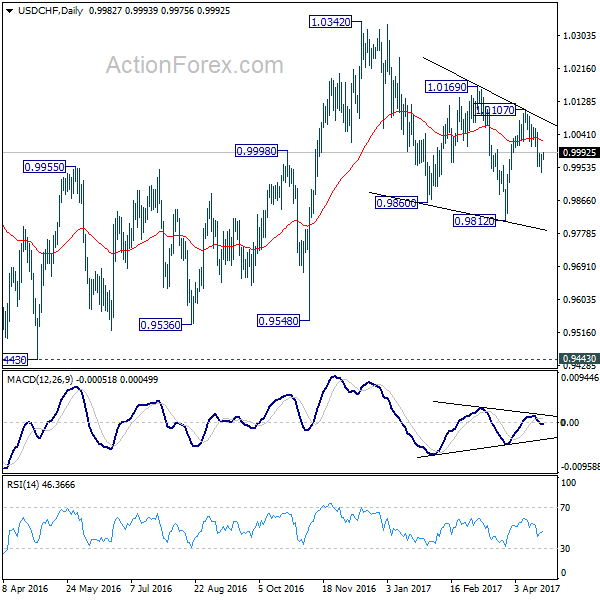
A temporary low is in place at 0.9940 in USD/CHF and intraday bias is turned neutral. Another decline is in favor as long as 1.0008 minor resistance holds. Below 0.9940 will target 0.9812 and below. Fall from 1.0342 is seen as a correction. Hence, we'll look for bottoming signal below 0.9812. Meanwhile, on the upside, above 1.0008 minor resistance will turn bias back to the upside for 1.0107 resistance instead.
In the bigger picture, we're still maintaining that firm break of 1.0342 key resistance is needed to confirm underlying bullish momentum in the cross. However, the corrective nature of the fall from 1.0342 is starting to give the medium term outlook a bullish favor. Hence, in stead of looking for topping signal around 1.0342, we'd now pay closer attention to upside acceleration as USD/CHF approaches this level again.
Daily Technical Analysis: EURUSD, GBPUSD, USDJPY, USDCHF
EURUSD
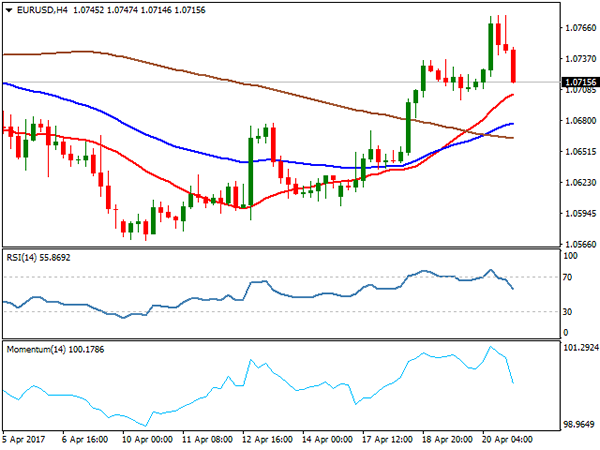
The EURUSD attempted to push higher yesterday topped at 1.0777 but closed lower at 1.0715, formed a pin bar formation just below the EMA 200 as you can see on my daily chart below. The bias is bearish in nearest term retesting the trend line support and 1.0650/25 area which also remains a key support and good place to buy with a tight stop loss. Immediate resistance is seen around 1.0750. A clear break above that area could lead price to neutral zone in nearest term testing 1.0777 and the daily EMA 200 located around 1.0800. Overall I remain neutral.
GBPUSD
The GBPUSD had a moderate bullish momentum yesterday topped at 1.2847 but closed a little bit lower at 1.2810. The bias is neutral in nearest term. The double bottom bullish scenario should remain valid but we still need a consistent and convincing movement above the daily EMA 200 (1.2780). Immediate support remains around 1.2750. A clear break and daily/weekly close below that area would expose 1.2650 or lower next week. On the upside, a clear break and daily/weekly close above 1.2850 – 1.2900 would give us further confirmation of the double bottom bullish scenario with nearest target seen around 1.3000 – 1.3050.
USDJPY
The USDJPY continued its bullish momentum yesterday topped at 109.48. The bias is bullish in nearest term testing 110.10 and the trend line resistance as you can see on my H1 chart below which is a good place to sell as we know that the current short-term bullish trend is just a corrective movement. Immediate support is seen around 109.20. A clear break below that area could lead price to neutral zone in nearest term testing 108.70 region but only a clear break back below 108.13 would end the current bullish correction phase.
USDCHF
The USDCHF attempted to push lower yesterday bottomed at 0.9940 but closed higher at 0.9986 and hit 0.9991 earlier today in Asian session. The bias is neutral in nearest term probably with a little bullish bias testing 1.0020 resistance area which remains a good place to sell with a tight stop loss targeting 0.9880. Immediate support is seen around 0.9940. A clear break and daily/weekly close below that area would expose 0.9880 – 0.9813 next week. Overall I remain neutral.
Wolves Circle Oil And Gold Ahead Of Le Crunch
Oil continues it's bearish consolidation, while precious metals await this weekend's French election.
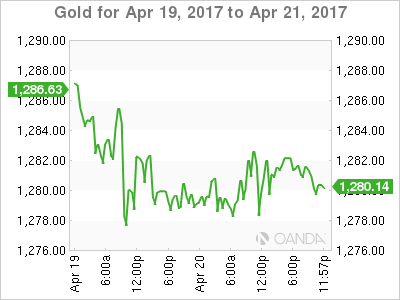
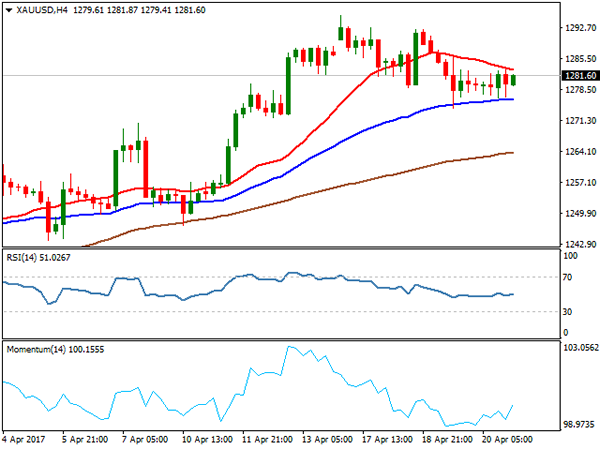
Gold has spent the overnight session consolidating to open quietly mid-range at 1281 this morning in Asia. The fact that gold is almost unchanged from its open of the previous day suggests that traders are now positioned and in a wait and see mode ahead of this weekend's French presidential voting.
From a chart perspective, however, gold appears to have run out of momentum, having made a series of lower highs over the past few days. Assuming the weekend passes without surprises election wise, there is potential for a correction on Monday as safe-haven hedges are lightened. However, a surprise win by both the extreme left and right candidates could make gold's price action when it opens early Monday emotional, to say the least.
Key levels for the Asian session and into the weekend are supports at 1270 and 1260 with resistance at 1296, 1300 and 1308.
Silver
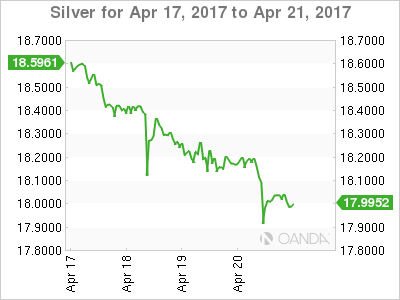
Silver meanwhile, it looking even less constructive on the charts. Since peaking on Monday at 18.6550, Silver has made a series of lower daily highs and lows and is now perched precariously on its 200-day moving average at 18.0200. Clearly, this weekend's vote in France will set the price agenda into the next week, but like gold, its price action is not constructive from a technical perspective.
For today's session, Silver has support at 17.8650 initially and then 17.7400. Resistance lies at 18.2400 with a close above implying a move back to the 18.5000 area.
OIL
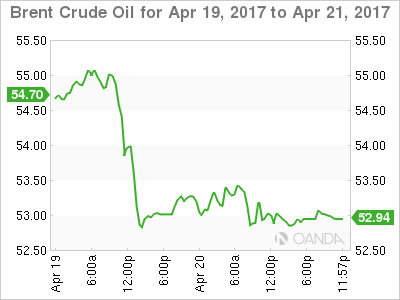
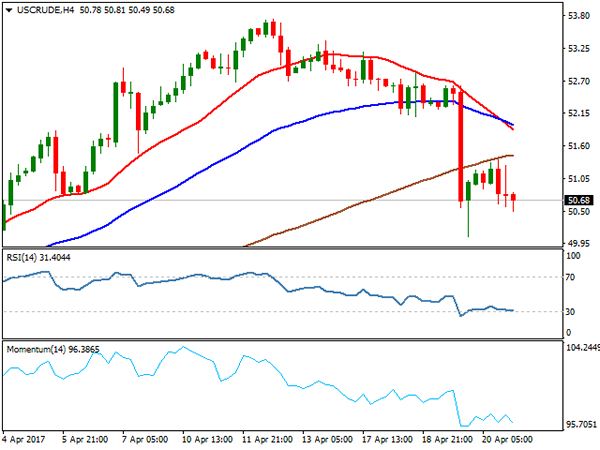
Crude has consolidated near the bottom of its recent ranges as Asian trading gets under way. After the midweek clean out of long positioning, traders appear averse to initiating fresh longs as the Street frets about record oil inventories globally and rising U.S. production.
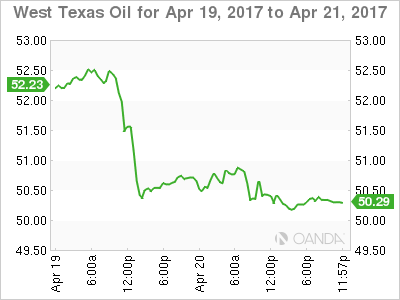
From a technical perspective, neither Brent nor WTI's price action is constructive. Instead, both seem to be making bearish consolidation patterns before another move to the downside.
Brent spot has clearly defined support at 52.50 with resistance at 53.50 intraday.
WTI spot has support at 50.00 with resistance at 51.00 intraday.
The price action over the last 48 hours, suggests a break of the support levels in both, could trigger more stop-loss selling as optimism meets reality.
Summary
Were it not for the French election this weekend; commodities would not be looking constructive technically. However with “Le Crunch” this Sunday, surprises cannot be ruled out, and they have the potential to override the technical picture. Some more short-term consolidation cannot be ruled out over today's session, but traders should be watching their news feeds late Sunday, and the metals open at 6 am Singapore for further clues.
Market Morning Briefing: Muted Price Action Had Been Seen In Gold
STOCKS
Almost all major indices have bounced from immediate support levels and could move up for at least the next 2-3 sessions.
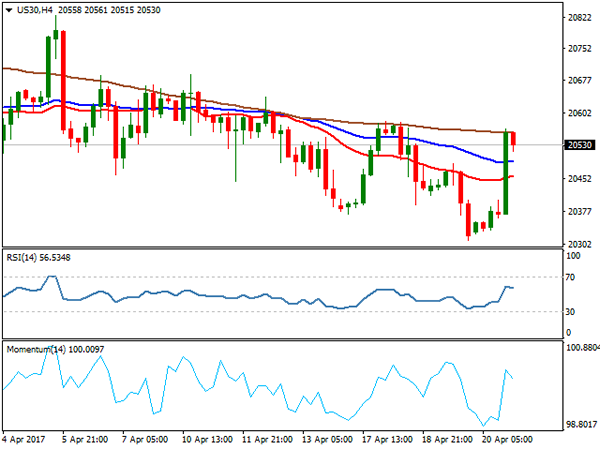
Dow (20578.71, +0.85%) has bounced back from support near 20400 as expected. A rise towards 20700 is a possibility in the near term.
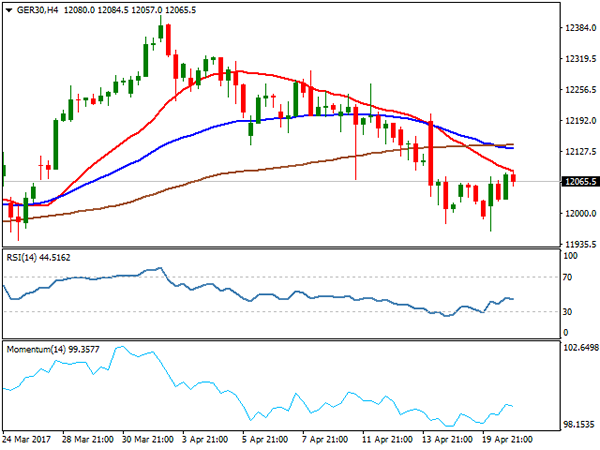
Dax (12027.32, +0.09%) is also up from levels near 11930 and could move back towards 12100-12200in the coming sessions if this holds.
Shanghai (3175.86, +0.12%) has moved up from 3150 and is testing important resistance near 3175-3180 levels. In case 3180 produces a rejection, we could see a re-test of 3150 and may be even lower. A sustained break above 3180 is needed to ensure a rise towards 3225 for the near term.
Nikkei (18585.31, +0.84%) is also trading higher while the support near 18227 holds good. At the same time also note that we could see a slight dip from 18650-18745 region in the near term which could possibly bring back the price towards 18230.
9160-9075 is an important near term band for Nifty (9136.40, +0.36%). A break on either side would decide the next course of movement. We should be prepared to a see a fall towards 9000 in case of a break below 9100-9075 levels. But while 9100-9075 holds, we prefer a bounce back to higher levels in the medium term.
COMMODITIES
Muted price action had been seen in Gold (1281).Correction towards 1260-65 can be expected due to near-term overbought condition. We have been expecting 1260 to hold for some time as buyers are taking every dip as a further opportunity for buying. 1301 could be a level where the price action has to be checked to assess the chances of further bounce to 1328 to 1350 levels.
Silver (17.98) had also moved lower in line with our expectation. Immediate trading range could be 17.70-18.35. We think that the corrective phase could be restricted till 17.60-70 levels due to near term oversold condition.
Copper (2.54) has been stuck in the range of 2.50-2.66. A close below 2.50 could open up 2.48 and 2.45 levels respectively. Gradual buying at 2.45-48 levels can’t be ruled out due to near term oversold condition. Only above 2.66, higher resistances of 2.72 -80 can come into consideration.
Brent (53.06) and WTI (50.30) both had moved lower in line with our expectation. They are within their trading ranges of 52.20-53.60 and 50.30-51.70 respectively. Brent may consolidate within these levels for few more sessions though the possibility of a decline towards supports can’t be ruled out, but a close below 50.30 could drag WTI towards 48.36 levels. We will remain bearish while Brent and WTI are trading below 53.60 and 51.70 levels respectively.
FOREX
Dollar Index (99.74) is hovering around its pivot of 99.80 of its entire trading range of 98.80-100.75. If it breaches its pivot then we might see 100.45-80 within 3 to 5 trading sessions.
Euro (1.0716) was rejected from levels near 1.0770 yesterday. We could see a pause in Euro today trading within the 1.0770-1.0680 region. Looking at the German-US 10Yr yield spread (REFER TO INTEREST RATES SECTION BELOW) there could be some possibility that further upside for euro could be limited just now.
Pound (1.2799) is in a pause mode after the recent sharp rise from levels near 1.25. We may see trade within 1.2750-1.29 for the next 2-sessions. 1.29 may act as a decent resistance for the coming sessions.
Dollar-Yen (109.215) could test 109.50-110.08 levels before dipping back to 109-108.5 levels again. Overall some sideways consolidation might be on the cards for the coming sessions.
Aussie (0.7526) could move up towards 0.760-0.761 in the next 2-3 sessions before again coming off towards 0.7450 levels. As mentioned yesterday, the 0.76-0.7450 region could hold for a few more sessions.
Dollar-Rupee (64.56) could open near resistance at 64.70/80 today and may see a dip in the later hours of the session today. It would be important to watch if the pair moves above 64.70/80 or comes off from there to reinforce 64.40/30 on the downside.
INTEREST RATES
The US yields have moved up as expected. We could see some more rise in the near term.
The German-US 2Yr (-1.97%) and the 10Yr (-2.00%) have risen. The 2Yr yield spread has broken above immediate resistance level whereas the 10yr spread is testing important resistance at current levels. In case the 10Yr spread comes off from current levels in the early sessions of next week, we could expect a dip in Euro also in the neat week.
The UK-US 10yr (-1.19%) is trying to come off from a long term channel resistance and while that holds, we could see a fall towards -1.25%. in that case Pound may either consolidate sideways or come down in the near term.
The 10YR GOI may rise towards 6.95-7% if it breaks above 6.90%. Else a fall towards 6.85 or lower is possible.
EUR/USD Daily Outlook
Daily Pivots: (S1) 1.0688; (P) 1.0733 (R1) 1.0759; More....
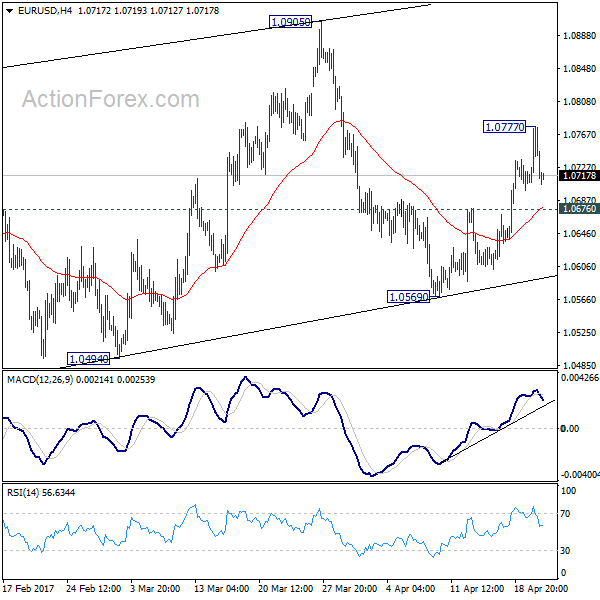
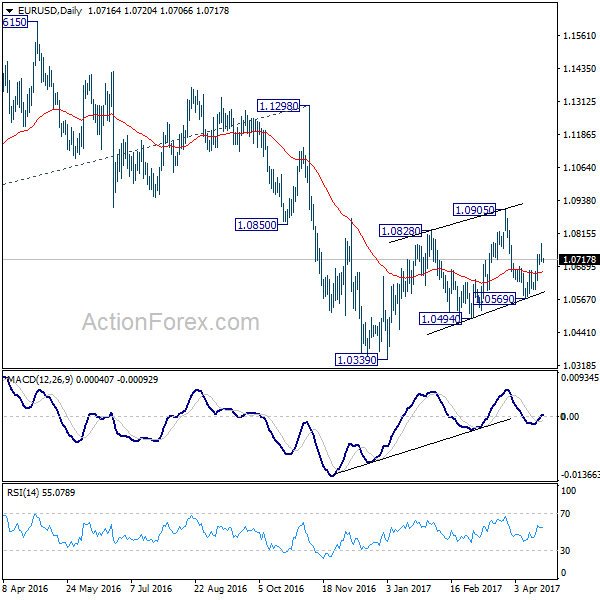
A temporary top is in place at 1.0777 in EUR/USD and intraday bias is turned neutral first. With 1.0676 minor support intact another rise is in favor. Above 1.0777 will target 1.0905 and above. But still, choppy rise from 1.0339 is still seen as a correction. Hence, we'll pay attention to topping signal above 1.0905 again, as we'd expect larger down trend to resume later. On the downside, break of 1.0676 minor support will turn intraday bias back to the downside for 1.0569 instead.
In the bigger picture, as long as 1.1298 key resistance holds, whole down trend from 1.6039 (2008 high) is still expected to continue. Break of 1.0339 low will send EUR/USD through parity to 61.8% projection of 1.3993 to 1.0461 from 1.1298 at 0.9115. However, considering bullish convergence condition in weekly MACD, break of 1.1298 will indicate term reversal. this would also be supported by sustained trading above 55 week EMA.
Euro Drops on Paris Terrorist Shooting ahead of Election, Dollar Lifted as Tax Reform News
Euro dropped notably against Dollar overnight after news of terrorist attack in Paris, just ahead of presidential election this Sunday. A shooting occurred on the famous Champs-Elysees shopping boulevard, resulting in death of one police and injuries of two others. The Islamic State group claimed responsibility for the shooting. The incident disrupts the election campaign as conservative candidate Francois Fillon cancelled his trip to the Alps to "first show our solidarity with the police". Far-left Jean-Luc Melenchon said urged people to "attend to our duties as citizens: no panic, we shouldn't interrupt our democratic process". Far-right Marine Le Pen said she was "deeply angry" on the shooting and sad for the victims. Centrist Emmanuel Macron said that "this threat, this imponderable problem, is part of our daily lives for the years to come."
For the moment, Macron and Le Pen are still tipped by polls to win the election on Sunday to go through to the run-off on May 7. But markets would be lightening up position on Euro, in case that both Euro sceptic Le Pen and Melenchon win. For the moment, EUR/USD is holding above 1.0676 minor support and further rise is still expected technically. But the common currency is staying bearish against Sterling and Yen. EUR/GBP is holding below 0.8511 resistance while EUR/JPY is kept below 118.23 resistance. Euro could turn softer before weekly close.
US Treasury Mnuchin: Close to bring forward major tax reform
On the other hand, US equities, treasury yields and Dollar were lifted by comments from US Treasury secretary Steven Mnuchin. Mnuchin said yesterday that Donald Trump's administration is close to bringing forward "major tax reform". And, he hoped that passing the tax overhaul bills won't "take till the end of the year". Mnuchin changed his tone on the issue and said that "whether health care gets done or health care doesn't get done, we're going to get tax reform done." Separately, Trump's economic adviser Gary Cohn said that the administration is going to come up with a "unified, united tax proposal from the White House that will include individual as well as corporate". Nonetheless, no detail is given to the public by any one so far.
Staying in US, President Donald Trump praised Chinese efforts regarding North Korea and said Chinese President Xi Jinping would "try very hard" on it. However, on the other hand, Trump launched a probe against exporters of cheap steel, including China, to US. And he emphasized that steel is "critical" to both the economy and military. Meanwhile, Trump's earlier comments that Korea used to be a part of China infuriated people in South Korea. South Korean foreign ministry spokesman Cho June Hyuck said yesterday that "it's a clear fact acknowledged by the international community that, for thousands of years of history, Korea has never been part of China." Meanwhile, the Liberal Korea Party presidential candidate Hong Joon Pyso said through a spokesman that Trump's comment " is clearly a distortion of history and an invasion of the Republic of Korea's sovereignty."
Dallas Fed president Robert Kaplan said yesterday that "three rate increases this year...is still a good baseline." And, "if the economy develops a little more slowly, then we can do less than that and if the economy is a little stronger, we can do more than that." Regarding unwinding the balance sheet, Kaplan said that "as soon as later this year or maybe early next year, we should begin the process of letting the balance sheet roll off."
On the data front
Japan PMI manufacturing rose to 52.8 in April, up from 52.4 and beat expectation of 52.5. New export jumped to 53.9, up fro 51.9. Output rose to 53.6, up from 53.0. Markit noted that "April's PMI data signaled continued healthy growth of Japans manufacturing sector, and the latest results were again consistent with production rising at a quarterly rate of around 2 percent."
Eurozone PMIs will be released in European session today while UK retail sales will be featured. Canada will release CPI. US will release PMIs and existing home sales.
EUR/USD Daily Outlook
Daily Pivots: (S1) 1.0688; (P) 1.0733 (R1) 1.0759; More....
A temporary top is in place at 1.0777 in EUR/USD and intraday bias is turned neutral first. With 1.0676 minor support intact another rise is in favor. Above 1.0777 will target 1.0905 and above. But still, choppy rise from 1.0339 is still seen as a correction. Hence, we'll pay attention to topping signal above 1.0905 again, as we'd expect larger down trend to resume later. On the downside, break of 1.0676 minor support will turn intraday bias back to the downside for 1.0569 instead.
In the bigger picture, as long as 1.1298 key resistance holds, whole down trend from 1.6039 (2008 high) is still expected to continue. Break of 1.0339 low will send EUR/USD through parity to 61.8% projection of 1.3993 to 1.0461 from 1.1298 at 0.9115. However, considering bullish convergence condition in weekly MACD, break of 1.1298 will indicate term reversal. this would also be supported by sustained trading above 55 week EMA.
Economic Indicators Update
| GMT | Ccy | Events | Actual | Forecast | Previous | Revised |
|---|---|---|---|---|---|---|
| 00:30 | JPY | PMI Manufacturing Apr P | 52.8 | 52.5 | 52.4 | |
| 04:30 | JPY | Tertiary Industry Index M/M Feb | 0.30% | 0.00% | ||
| 07:00 | EUR | France Manufacturing PMI Apr P | 53.2 | 53.3 | ||
| 07:00 | EUR | France Services PMI Apr P | 57.2 | 57.5 | ||
| 07:30 | EUR | Germany Manufacturing PMI Apr P | 58.1 | 58.3 | ||
| 07:30 | EUR | Germany Services PMI Apr P | 55.5 | 55.6 | ||
| 08:00 | EUR | Eurozone Manufacturing PMI Apr P | 56.1 | 56.2 | ||
| 08:00 | EUR | Eurozone Services PMI Apr P | 56 | 56 | ||
| 08:00 | EUR | Eurozone Current Account (EUR) Feb | 26.3B | 24.1B | ||
| 08:30 | GBP | Retail Sales M/M Mar | -0.30% | 1.40% | ||
| 12:30 | CAD | CPI M/M Mar | 0.40% | 0.20% | ||
| 12:30 | CAD | CPI Y/Y Mar | 2.00% | |||
| 12:30 | CAD | CPI Core - Trim Y/Y Mar | 1.60% | |||
| 12:30 | CAD | CPI Core - Median Y/Y Mar | 1.90% | |||
| 12:30 | CAD | CPI Core - Common Y/Y Mar | 1.30% | |||
| 13:45 | USD | Manufacturing PMI Apr P | 53.9 | 53.3 | ||
| 13:45 | USD | Services PMI Apr P | 53.7 | 52.8 | ||
| 14:00 | USD | Existing Home Sales Mar | 5.61M | 5.48M |
Elliott Wave View: INDU Further Downside
Short term Elliott Wave view in INDU ( Dow) suggest that instrument is showing 5 swings sequence from 3/03 peak (21018) favoring more downside. From 3/03 peak INDU is following a Double three Elliott wave Structure , where Minor wave W ended at 20579 low and Minor wave X ended at 20887 peak. Index has since broken below the 20412 low, suggesting the next leg lower in Minor wave Y has started already. The Internal Subdivision of Minor wave Y is also unfolding as Double three Elliott wave structure where Minute wave ((w)) ended at 20453 and Minute wave ((x)) bounce turns out to be a flat correction . Where the Minutte wave (a) ended at 20644 peak and Minutte wave (b) at 20379 low, above from there index could have ended the 5 waves in Minutte wave (c) of a flat within blue box area at yesterday’s peak 20629, while near term bounces fails below there & more importantly as far as pivot from 20888 peak Minute wave X connector’s peak stays intact index has scope to resume lower 1 more leg at least. we don’t like selling the index.
INDU 1 Hour Elliott Wave Chart
Foreign Exchange Market Commentary: EUR/USD, USD/JPY, GBP/USD,AUDUSD, GBPCAD, GOLD, WTI CRUDE, DJIA, FTSE100, DAX
EUR/USD
The EURUSD pair broke above daily Kijun-sen barrier at 1.0738 which capped upside attempts in past two day and met next target at 1.0776 (Fibonacci 61.8% retracement of 1.0906/1.0570 downleg. Initial attempt higher was short-lived, as the pair failed to hold gains and fell back bear key 1.0700 support after strong bearish signal was generated on formation of hourly double-top pattern.
Quick reversal was so far contained by the top of hourly Ichimoku cloud (spanned between 1.0715 & 1.0685) within 1.0700 support lies, marking strong support zone.
Dips are expected to hold above these supports in order to keep near-term studies in bullish alignment, as the pair remains biased higher overall, keeping positive tone ahead of Sunday’s French election.
However, close below Kijun-sen line and Thursday’s daily candle with long upper wick is expected to weigh on near-term action.
The pair may hold in extended consolidation between 1.0700 and 1.0738 ahead of releases of Eurozone PMI data, due on Friday which are expected to come out slightly below previous month’s figures and may further pressure the Euro on weaker-than-expected numbers.
Bearish scenario requires firm break below hourly Ichimoku cloud to signal further retracement of 1.0601/1.0776 upleg.
Otherwise, renewed attempts higher could be expected while 1.0715/00 supports hold. Close above daily Kijun-sen will be bullish signal, while lift above 1.0776 pivot would signal bullish continuation towards 1.0800/26 targets.
Support: 1.0715, 1.0700, 1.0684, 1.0658
Resistance: 1.0738, 1.0777, 1.0800, 1.0826
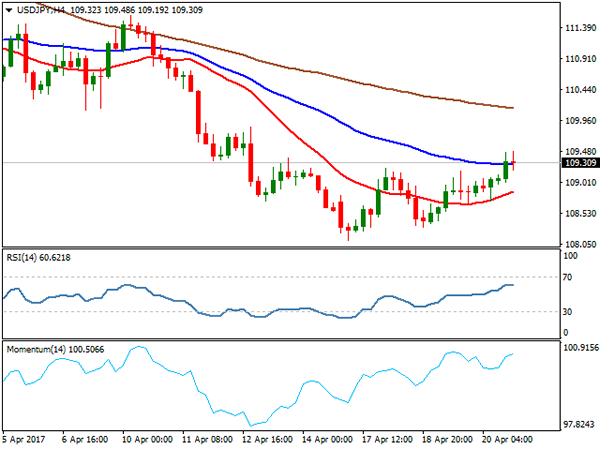
USD/JPY
USD JPY pair is on track for the second consecutive bullish daily close, signalling that consolidation above fresh low at 108.11 may extend higher. Thursday’s rally that firmly broke above 200SMA (108.87) and now acting as support, also cracked next pivot at 109.43 (Fibonacci 38.2% retracement of 111.57/108.11 downleg), signalled fresh strength of the dollar, despite weaker-than-expected releases of US economic indicators. US weekly jobless claims rose by 10K to 244K, above forecasted 242K, while Philadelphia Fed Manufacturing Index came at 22.0 in April, missing forecast at 25.0 and holding well below 32.8 release of March.
Extended recovery on close above 109.43 may challenge next strong barriers at 109.84 (daily Tenkan-sen) and psychological 110.00 barrier, as daily indicators that emerged from oversold territory show more room at the upside.
The pair is also on track for positive weekly close after two consecutive weeks in red which may signal further recovery.
Firmer bullish signal could be expected on sustained break above 109.84/110.00 pivots.
Support: 108.85, 108.68, 108.32, 108.11
Resistance: 109.48, 109.84, 110.00, 110.25
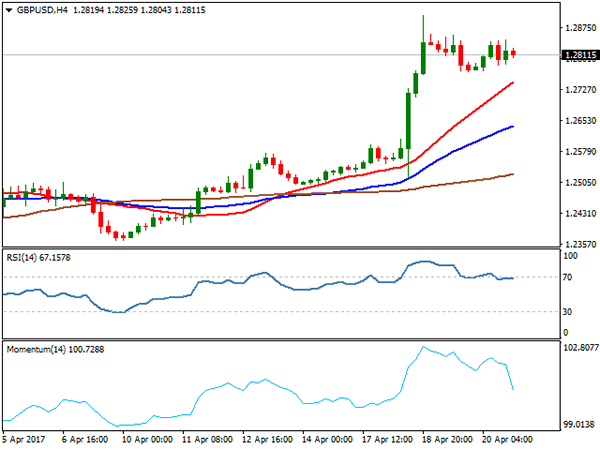
GBP/USD
GBPUSD currency pair remains in extended consolidation below fresh multi-month high at 1.2905, with downside being limited at 1.2770 (lows of Wed / Thu). Consolidation is forming bullish flag pattern on 4-hr chart which may signal fresh upside attempts towards 1.2905 and attack at psychological 1.3000 barrier in extension. Strong bullish sentiment continues to underpin the pound, along with bullish technical studies.
However, risk of deeper correction remains on the table, signalled by extended daily studies, as daily RSI and slow stochastic are hovering around overbought boundary line, but remain in sideways mode in the near-term and without firmer bearish signal so far.
On the other side, cable is on track for the second strong weekly close which is seen supportive for fresh advance.
Initial support lies at 1.2770, guarding 1.2750 (Fibonacci 38.2% retracement of 1.2500/1.2905 rally) and firm break here would generate stronger bearish signal for extended pullback.
The pair is looking for release of UK Retail Sales data for March on Friday, which may impact pair near-term action. Monthly Retail Sales are forecasted at -0.2% in March, well below Feb’s 1.4% release, with forecast for annualized Retail Sales at 3.4%, also being under previous month’s release at 3.7%.
Support: 1.2701, 1.2750, 1.2702, 1.2654
Resistance: 1.2846, 1.2859, 1.2905, 1.2950
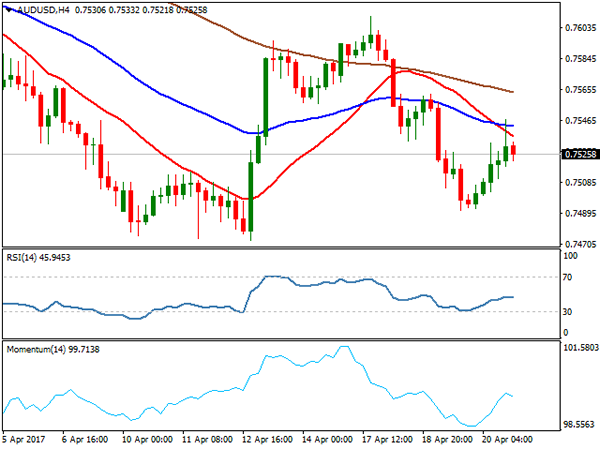
AUDUSD
The AUDUSD pair recovered part of past two-day strong fall from 0.7610 that found footstep at 0.7490, just ahead of key near-term support at 0.7472 (lows of Apr 10,11,12 / base of thick daily Ichimoku cloud). Thursday’s bounce could be seen as a breather of downmove from 0.7610, before final attack at 0.7472 pivot, as daily technical studies remain in firm bearish setup and extended upticks on Thursday were capped under 200SMA (0.7550) and remain below strong resistance zone at 0.7541/50, formed by daily Tenkan-sen and 200SMA.
While the latter barriers hold, the downside is expected to remain at risk for renewed attempt through 0.7472, which would signal stronger bearish acceleration and expose targets at 0.7453 (50% retracement of 0.7158/0.7749 rally) and 0.7384 (Fibonacci 61.8% retracement) in extension.
Alternative scenario needs firm break and close above 200SMA to shift near-term focus higher.
Support: 0.7510, 0.7490, 0.7472, 0.7453
Resistance: 0.7541, 0.7550, 0.7576, 0.7596
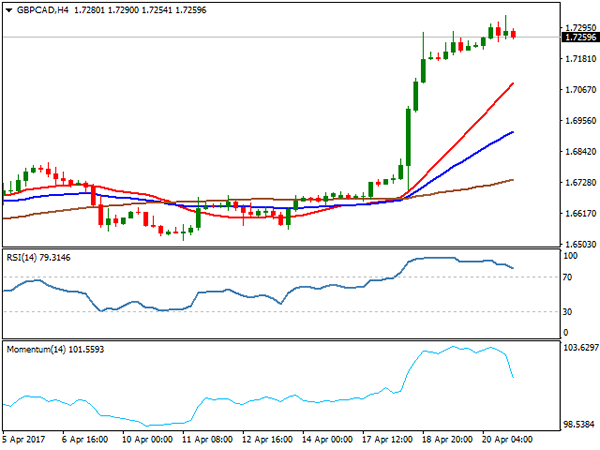
GBPCAD
The GBPCAD cross maintains firm bullish tone and posted fresh high at 1.7340, the highest level since mid-September 2016. The pair continues to move higher despite strongly overbought daily studies, which are lacking to produce any firmer bearish signal. However, correction should be anticipated before the pair attacks next target at 1.7436 (50% retracement of Jun/Oct 2016 1.9127/1.5745 descend.
Daily candles with long upper wicks could be seen as initial signal of strong rally running out of steam.
Initial supports lay at 1.7215/1.7176, with 1.7024/00 zone expected to ideally contain correction.
Support: 1.7215, 1.7176, 1.7145, 1.7100
Resistance: 1.7340, 1.7436, 1.7524, 1.7542
GOLD
Spot Gold recovered part of losses of the previous day on Thursday, recovering from correction low at $1274, after pullback was contained by Fibonacci 38.2% retracement of $1243/$1295 upleg. The yellow metal bounced after the biggest one-day drop since Mar 30, after weaker than expected US jobs and manufacturing data released on Thursday, dented the tone of strengthening of US economy. Gold is also eyeing French election on Sunday, which may boost its existing safe haven appeal, built on recent uncertainty on rising geopolitical tensions that triggered strong risk-off mode among the traders.
From technical point of view, overall structure remains firmly bullish, with corrective easing on overbought studies seen preceding fresh upside actions.
Technical studies on lower timeframes are mixed and suggest prolonged consolidation phase. Thursday’s recovery was capped by thin hourly cloud (spanned between $1281 & $1283), break above which would gain fresh bullish momentum for further retracement of $1295/$1274 bear-leg and expose pivots at $1287 (Fibonacci 61.8%) and lower top at $1292.
Conversely, weakness below $1274 and violation of next pivot at $1271 (daily Tenkan-sen) would weaken near-term structure and risk stronger correction.
Support: 1276, 1274, 1275, 1271
Resistance: 1283, 1287, 1292, 1295
WTI CRUDE OIL
WTI oil remained in red on Thursday but managed to hold above Wednesday’s spike low at $50.06, as concerns over rising U.S. oil production offset bullish comments from oil producers on a possible extension to the OPEC-led deal to cut global supply. Oil price moved in and out of positive territory in volatile Thursday’s trading, but settled lower, despite bullish comments from OPEC members Saudi Arabia and Kuwait concerning a possible extension to the OPEC-led deal to cut global supply.
Technical studies remain negatively aligned and keep downside at risk, as price approached cracked Kijun-sen support at $50.40 and see risk of renewed attack at psychological $50.00 support, as the price closed below thickening daily Ichimoku cloud, which is seen as negative signal.
Support: 50.40, 50.00, 49.62, 48.92
Resistance: 51.36, 51.54, 51.84, 51.90
DJIA
Dow Jones bounced on Thursday and made strong bullish close after two days in red. The price found footstep at at 20310 and returned back into thick daily cloud after closing below cloud base on Wednesday, signalling false break lower.
Wall Street was higher on Thursday, led by a sharp rally in the shares of American Express , after the company posted better than expected earnings, as comments of US Treasury secretary Mnuchin on tax reform lifted sentiment.
Fresh rally on Thursday improved Dow’ s near-term sentiment, as Thursday’s rally marks the biggest one-day gains since Mar 1 and rally also cracked significant resistance at 20500 (daily Tenkan-sen). Recovery needs to regain next pivots at 20580 and 20669 (daily Kijun-sen) to expose daily Ichimoku cloud top at 20757 and signal stronger recovery on break.
On the downside, daily cloud base is expected to hold and maintain fresh bullish sentiment.
Support: 20500, 20385, 20310, 20211
Resistance: 20567, 20580, 20669, 20757
FTSE100
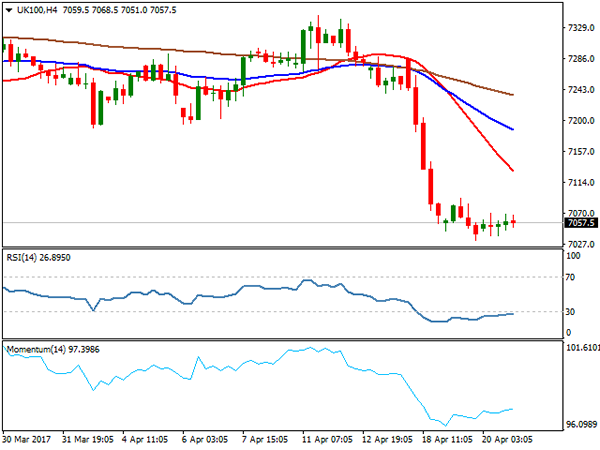
FTSE index is holding in narrowing consolidation for the second day, following strong fall on Tuesday, which so far found footstep at 7032. Firm bearish setup on daily technical studies keeps the downside in focus, as strong bearish sentiment remains in play on firm pound.
The price is looking for test of psychological 7000 support, break of which will open way towards next pivotal support at 6969 (Fibonacci 61.8% retracement of larger 6675/7444 rally.
Recovery attempts were limited for now and capped at 7092 (Fibonacci 23.6% of 7285/7032 fall) keeping intact more significant barriers at 7129 (Fibonacci 38.2%) and 7147 (broken 100SMA) which guard upper triggers at 7189/97 (daily Tenkan-sen / Ichimoku cloud base).
Support: 7032, 7024, 7000, 6969
Resistance: 7070, 7092, 7144, 7192
DAX
DAX ended Thursday’s trading positively, after spiking lower to 11962, but repeated probe below 12000 handle was short-lived and contained by rising 55SMA. Index was dragged higher by improved sentiment and Wall St rally and bounced back to broken Fibonacci 61.8% support at 12081, which capped the rally on Thursday.
Daily studies remain weak, but oversold conditions suggest extended correction, as daily indicators are turning up.
We look for recovery extension to 12133 (Fibonacci 38.2% of 12410/11962 pullback) which is expected to ideally cap, as barrier is reinforced by bearish-cross of daily Tenkan-sen / Kijun-sen lines.
Only sustained break above the latter would improve the structure and signal further recovery.
Support: 12026, 11962, 11943, 11878
Resistance: 12081, 12133, 12144, 12220
Countdown to the French Election
First there was Brexit, then Trump and now it's the French election; or at least that's the narrative playing out in the markets. We take a closer look. The Australian dollar was the top performer Thursday while the yen lagged. The Japan Nikkei PMI is due next. The Premium Insights closed the EURCAD long at 1.4495 for a 235-pip gain in order to make a way for a tactical dual EUR trade on Friday ahead of Sunday's French elections.
Polls showed fractional momentum for Macron, helping to boost the CAC-40 in countdown mode to the Sunday's 1st round vote. That uptick may be telling because a large number of voters said they were undecided earlier in the month.
A poll from Harris showed Macron at 24.5%, Le Pen at 21%, Fillon at 20% and Melenchon at 19%. Given the margin of error and other factors like turnout and undecideds, it's conceivable the second round could be the far right candidate Le Pen and the far left candidate Melenchon. Polls show Melenchon would win that contest but German Fin Min Schaeuble called it a 'nightmare scenario' because both are euroskeptics.
What's important to remember is that's a highly unlikely scenario and the only result that could immediately upend the euro. If Macron finishes in the top-two and moves to the runoff, he's heavily favoured against any of the candidates. Fillon would also be a big favorite against Le Pen or Melenchon.
So while the market sees this as a potential redux of Brexit or Trump, it would take a far bigger swing. Brexit polls were close in the days ahead of the vote and Trump lost the popular vote but won the electoral college. In France, it's a national popular vote so polling is simplified.
That said, there is always the risk that voters are playing coy with pollsters again or could swing late. The risks may be even higher after what looked like a terrorist attack on the Champs Elysee late Thursday. That alone could add to jitters Friday.
After talking with many traders and analysts, there is a distinct fear of history repeating itself but those fears (and market pricing) overstate the odds of a major surprise.
Sunday Afternoon Volatility
Watch for exit polls hitting at 8 pm Paris time on Sunday (7 pm London, 2 pm New York), coinciding with the market open in the Pacific.
Before that, we'll watch for continue comments from leaders at IMF meetings in Washington and the Japan Nikkei PMI at 0030 GMT. The prior was 52.4.