
Sample Category Title
EUR/CAD Elliott Wave Analysis
EUR/CAD – 1.4523
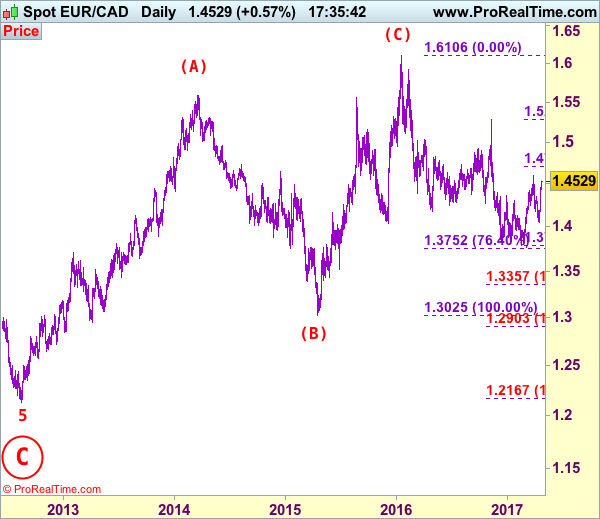
EUR/CAD: Wave 4 ended at 1.4380 and wave 5 as well as circle wave C has possibly ended at 1.2129, major (A)-(B)-(C) correction has commenced and indicated target at 1.6000 had been met.
Although the single currency fell to as low as 1.4053 earlier this month, as euro found decent demand there and has staged a strong rebound, suggesting the retreat from 1.4600 has ended at 1.4053 and consolidation with upside bias is seen for test of said resistance at 1.4600, a break there would add credence to our view that low has been formed at 1.3784 back in February and bullishness remains for this erratic rise to bring a stronger retracement of recent decline to 1.4710 (61.8% Fibonacci retracement of 1.5282-1.3784) and later towards 1.4800.
Our latest preferred count is that larger degree wave [C] from 1.3289 as well as circle wave B ended at 1.7509 in Dec 2008 with (A): 1.6325, (B): 1.4719 followed by wave (C) at 1.7509, hence circle wave C is unfolding with wave 1 ended at 1.5186 (diagonal wave 1), wave 2 at 1.6096, impulsive wave 3 has ended at 1.2451, followed by wave 4 at 1.4380, in view of recent strong rebound, we are now treating the wave 5 as well as larger degree circle wave C has ended at 1.2129, hence (A)-(B)-(C) correction has commenced from there with impulsive wave (C) now unfolding and indicated initial upside target at 1.6000 had been met and reckon 1.6500 would hold.
On the downside, whilst pullback to 1.4450-60 is likely, reckon 1.4390-00 would limit downside and bring another rise to aforesaid upside targets. Below 1.4350-55 would defer and risk weakness to 1.4300 but reckon downside would be limited to 1.4250 and 1.4170-75 should remain intact, bring another rebound later.
Recommendation: Buy at 1.4400 for 1.4600 with stop below 1.4300.
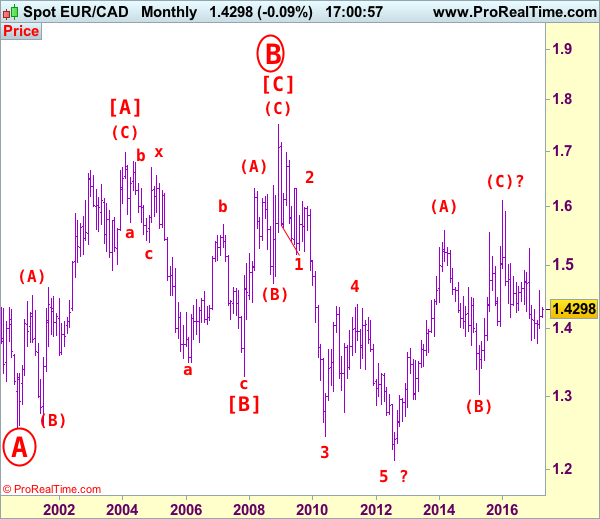
On the bigger picture, our long-term count on the monthly chart is that a big sideways consolidation from 2000 low of 1.2557 has possibly ended at 1.7509 as circle wave B with [A]: 1.6976 ( (A): 1.4513, (B): 1.2612, (C): 1.6976), wave [B]: 1.3289 is a double three with 1st a-b-c: 1.5384, x: 1.6709 and 2nd a-b-c: 1.3289. As indicated above, the wave [C] has ended at 1.7509. The selloff from there is now unfolding which itself should be labeled as an impulsive wave with wave 1: 1.5186 (diagonal wave 1), followed by wave 2: 1.6096 and wave 3: 1.2451, wave 4: 1.4380, wave 5 as well as larger degree circle wave C has possibly ended at 1.2129 and major correction has possibly commenced for retracement of recent decline towards 1.4000, then 1.4180-90 (38.2% Fibonacci retracement of 1.7509-1.2129). Below said support at 1.2129 would risk weakness to psychological support at 1.2000 and then 1.1851 (50% projection of 1.7509-1.2451 measuring from 1.4380) but reckon 1.1500 would remain intact, bring reversal later.
USD/CHF Challenging Its Support At 0.9955, USD/CAD The Resistance At 1.3456 Has Been Broken, AUD/USD Weak Bounce Thus Far.
USD/CHF Challenging its support at 0.9955.
USD/CHF failed to breach 1.0107 dropping sharply to support. The short-term technical structure is negative as long as prices remain below the hourly resistance at 1.0171 (07/03/2017). Monitor hourly support is given at 0.9955 (30/03/2017 base low) then 0.9814 (27/03/2017 low).
In the long-term, the pair is still trading in range since 2011 despite some turmoil when the SNB unpegged the CHF. Key support can be found 0.8986 (30/01/2015 low). The technical structure favours nonetheless a long term bullish bias since the unpeg in January 2015.
USD/CAD The resistance at 1.3456 has been broken.
USD/CAD is moving sharply higher from hourly support at 1.3265 confirming an underlying bullish trend. Resistances can now be found 1.3535 (09/03/2017 high). Hourly support can be located at 1.3456 (04/04/2017 high) then 1.3353 (20/01/2017 high).
In the longer term, there is a golden cross with the 50 dma crossing the 200 dma indicating further upside pressures. Strong resistance is given at 1.4690 (22/01/2016 high). Long-term support can be found at 1.2461 (16/03/2015 low).
AUD/USD Weak bounce thus far.
AUD/USD is trying to bounce off strong support at 0.7494. However, as long as prices remain below the resistance at 0.7608 (17/04/2017 high), the short-term technical structure is negative. Key resistance stands at 0.7681 (30/03/2017 high).
In the long-term, we are waiting for further signs that the current downtrend is ending. Key supports stand at 0.6009 (31/10/2008 low) . A break of the key resistance at 0.8295 (15/01/2015 high) is needed to invalidate our long-term bearish view.
AUD/USD Elliott Wave Analysis
AUD/USD – 0.7519
AUD/USD – Wave 5 of C and (B) has possibly ended at 1.1081
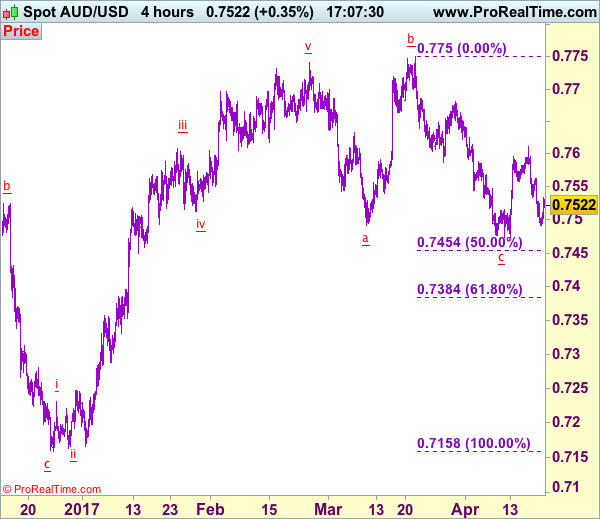
Although aussie rebounded last week, renewed selling interest emerged at 0.7611 and the pair has retreated, suggesting the rebound from 0.7473 has ended there and bearishness remains for another test of said support, break there would extend the fall demo 0.7750 top for at least a strong correction of the rise from 0.7158 (Dec 2016 low), initial downside target is seen at 0.7450-55 (50% Fibonacci retracement of 0.7158-0.7750), then towards 0.7380-85 (61.8% Fibonacci retracement), however, near term oversold condition should prevent sharp fall below 0.7300-10 and reckon 0.7280-85 would hold from here, bring rebound later.
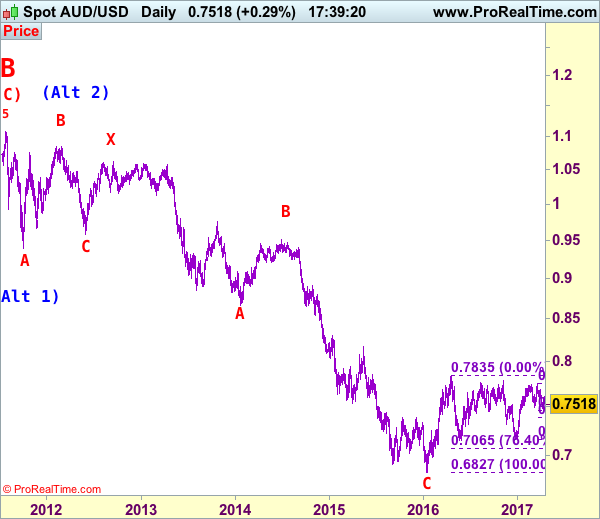
We are keeping our count that top has been formed at 1.1081 (wave 5 of V) and major correction (A-B-C-X-A-B-C) has commenced, indicated downside targets at 0.7945 (61.8% Fibonacci retracement of entire rise from 0.6007-1.1081) and 0.7750 had been met and downside bias is seen for further weakness to 0.6800, then 0.6700 but reckon 0.6500 would hold from here.
Our preferred count is that the rally from 0.6007 to 0.7270 (7 Jan 2009) is marked as wave A, the retreat to 0.6248 (2 Feb 2009) is wave B and the subsequent upmove is labeled as wave C with wave (iii) and wave (iv) ended at 0.8265 and 0.7700 respectively and wave (v) as well as 3 ended at 0.9407, then wave 4 ended at 0.8066 (instead of 0.8578). The wave 5 has met our indicated projection target of 1.1060 and could ended at 1.1081, this level is now treated as the peak of wave (C) as well as larger degree wave B, hence major fall in wave C has commenced, our initial downside target at psychological support at 0.7000 has just been met and further weakness to 0.6500 would be seen later.
On the upside, whilst initial recovery to 0.7560-65 cannot be ruled out, reckon 0.7590-00 would cap upside and bring another decline later to aforesaid downside retracement targets. A daily close above said resistance at 0.7611 would defer and risk a stronger rebound to 0.7640-45 but only break of resistance at 0.7680 would abort and suggest the fall from 0.7750 has ended instead,
Recommendation: Hold short entered at 0.7570 for 0.7390 with stop below 0.7620
Our alternate count on the daily chart treated the top formed in 2008 at 0.9851 could be a larger degree wave I and was followed by a deep and sharp correction in wave II to 0.6007 and wave III is unfolding from there.
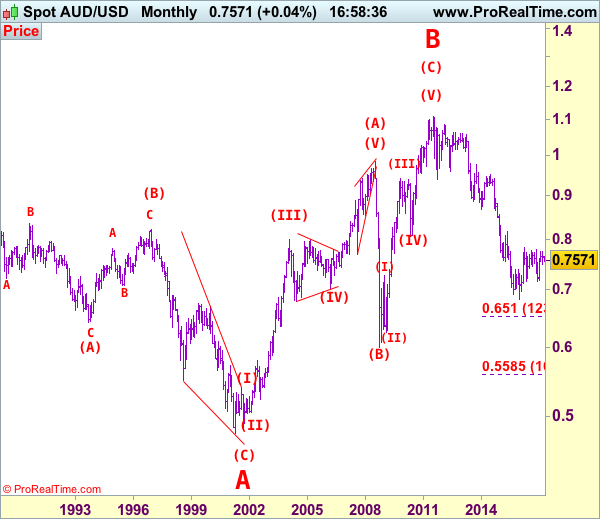
The long-term uptrend started from 0.4775 (2 Apr 2001) with an impulsive structure. Wave I is labeled as 0.4775 to 0.9851 (15 Jul 2008), wave II has ended at 0.6007 (Oct 2008) and wave III is still in progress which may extend further gain to 1.1265.
EUR/USD Finding New Demand, GBP/USD Minor Pullback, USD/JPY Sideways.
EUR/USD Finding new demand.
EUR/USD has further improved as seen by the break of the resistances area given by 1.0679. Hourly support can be found at 1.0703 (intraday base) then 1.0570 (11.04.2017 low). Stronger support can be found at 1.0494 (22/02/2017 low). A key resistance stands at 1.0874.
In the longer term, the death cross late October indicated a further bearish bias. The pair has broken key support given at 1.0458 (16/03/2015 low). Key resistance holds at 1.1714 (24/08/2015 high). Expected to head towards parity.
GBP/USD Minor pullback.
GBP/USD has pause after sharp bullish rally. Resistance stands at 1.2953. Monitor the hourly support at 1.2773 (intraday base) as a break would confirm a weakening short-term bullish momentum. Hourly resistance is located at 1.2905 (18/04/2017 reaction high).
The long-term technical pattern is even more negative since the Brexit vote has paved the way for further decline. Long-term support given at 1.0520 (01/03/85) represents a decent target. Long-term resistance is given at 1.5018 (24/06/2015) and would indicate a long-term reversal in the negative trend. Yet, it is very unlikely at the moment.
USD/JPY Sideways.
USD/JPY has recently moved sideways. Next support can be located at 108.22 (17/04/2017 low). Other key supports lie at a distant 106.04 (11/11/2016 low). Hourly resistance stands at 109.10 (18/04/2017 high). Other resistance can be found at 110.11, while a key resistance stands at 112.20 (31/03/2017 high).
We favor a long-term bearish bias. Support is now given at 96.57 (10/08/2013 low). A gradual rise towards the major resistance at 135.15 (01/02/2002 high) seems absolutely unlikely. Expected to decline further support at 93.79 (13/06/2013 low).
Trade Idea: EUR/JPY – Sell at 118.40 or buy at 115.80
EUR/JPY - 117.43
Recent wave: wave v of (C) ended at 94.12 and major correction in wave A has ended at 149.79
Trend: Near term down
Original strategy:
Sell at 118.00, Target: 116.00, Stop: 118.60
O.C.O.
Buy at 115.80, Target: 117.80, Stop: 115.20
Position: -
Target: -
Stop: -
New strategy :
Sell at 118.40, Target: 116.40, Stop: 119.00
O.C.O.
Buy at 115.80, Target: 117.80, Stop: 115.20
Position: -
Target: -
Stop:-
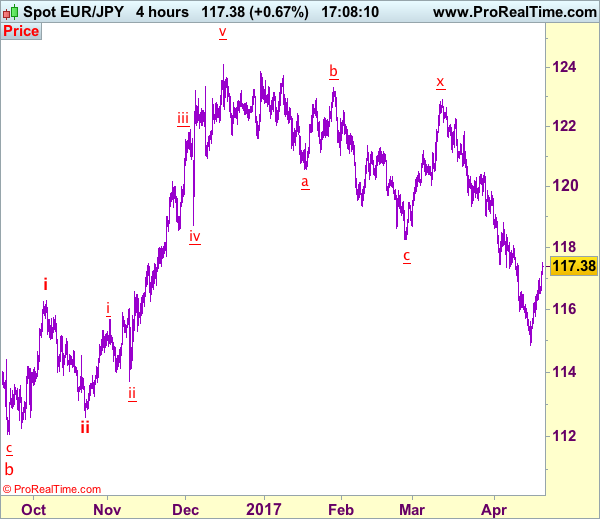
As the single currency has continued moving higher after staging a strong rebound from 114.85, adding credence to our view that a temporary low has been formed there and consolidation with mild upside bias remains for further gain to 117.80, then 118.00-10, however, reckon upside would be limited to 118.40-50 and bring retreat later, below 116.25-30 would bring weakness to 115.75-80 but reckon 115.40-50 would hold, bring another rebound later.
In view of this, whilst we are looking to turn long on dips, we would also sell euro on subsequent rebound towards 118.40-50. Only below said support at 114.85 would signal recent entire fall from 124.10 top is still in progress and downside risk remains for further weakness to 114.40-50, then towards 114.00-10, however, near term oversold condition should prevent sharp fall below latter level and risk from there is seen for a much-needed rebound to take place later.
Our latest preferred count is that wave (ii) is ABC-X-ABC which ended at 123.33 and wave (iii) is unfolding with wave iii ended at 100.77, followed by wave iv at 111.57 and wave v as well as the wave (iii) has ended at 97.04, followed by wave (iv) at 111.43 and wave (v) has ended at 94.12 which is also the end of the larger degree v, this also implied the major wave (C) has also ended there, hence major correction has commenced from there with (A) leg unfolding in its lower degree wave c which has possibly ended at 145.69. Under this count, A-B-C wave (B) has commenced with A leg ended at 136.23, wave B at 143.79 and wave C has possibly ended at 149.79.
Our larger degree count is that the decline from 139.26 is wave (C) and is sub-divided into a diagonal triangle i-ii-iii-iv-v with wave i - 105.44, wave ii- 123.33, wave iii - 97.03, wave iv - 111.43, followed by the final wave v as well as the end of wave (C) at 94.12, this also mark the bottom of larger degree wave B. Under this count, major rise in wave C has commenced as an impulsive wave with minor wave III ended at 145.69, wave V is still in progress for further gain to 150.00. Having said that, this so-called wave V could well be the first leg of larger degree 5-waver wave C and this wave C should bring at least a retest of wave A top at 169.97 (July 2008).
New Zealand’s Inflation Accelerates Above RBNZ’s Target Midpoint
Overnight, New Zealand's CPI rate for Q1 surged to +2.2% yoy from +1.3% in Q4. This was the first time in 5 years inflation propped above the midpoint of the RBNZ's inflation target range of 1-3%. Although StatsNZ noted that inflation was lifted by rising petrol prices and the annual rise in cigarette and tobacco tax, excluding those, the CPI rate stands at +1.5 yoy which is still within the Bank's target band.
At its latest gathering, the Bank kept the door open for further easing, and noted that it expects inflation to return to the midpoint over the “medium-term”. As such, we think that today's acceleration above that midpoint diminishes significantly the likelihood for any further rate cuts by the Bank, at least at the upcoming gatherings. This view is amplified by the fact that the nation's 2-year inflation expectations have been in a positive trend recently and they are now almost in line with the Bank's midpoint as well.
NZD/USD was waiting for the data near the 0.7000 (S1) key support and spiked higher as soon as the numbers were out. The price structure on the 4-hour chart suggests that the short-term outlook of the pair is somewhat positive. On the 13th of April, the rate emerged above the downtrend line taken from the 7th of February and since then, it's been printing higher peaks and higher troughs. A break above the 0.7050 (R1) hurdle is possible to initially aim for the next resistance of 0.7075 (R2), where another break is possible to target the 0.7110 (R3) barrier.
Oil falls to a two-week low on bearish inventory data
WTI tumbled on Wednesday, after the Energy Information Administration (EIA) reported that US crude inventories fell less than expected, while gasoline inventories built up instead of dropping as forecasted. The glut in US inventories comes just a day after the EIA monthly Drilling Productivity report showed that US shale production in May is set for its biggest monthly increase in more than two years.
All these confirm our long-standing view that continued gains in oil prices invite US shale producers back to the market, which in turn increases supply and thereby keeps any potential gains limited.
WTI tumbled on the US inventories report falling back below the key support (now turned into resistance) zone of 51.50 (R1). The plunge was stopped by the 50.50 (S1) level and then, the price rebounded somewhat. Even if that recovery continues for a while, the price structure on the 4-hour chart suggests a short-term downtrend. As such, we would treat any further rebound as a corrective move. We would expect the bears to take the reins again soon and aim for another test near 50.50 (S1). A dip below that line could challenge the round figure of 50.00 (S2).
Now the focus turns to the OPEC and non-OPEC meeting in Vienna on the 25th of May. A number of key producers, including Saudi Arabia, support extending the November production cut agreement into the second half of 2017, if all participating members agree.
Today:
The European day starts with Germany's PPI data for March. The PPI rate is expected to have ticked up, but in any case, PPI data are usually not a major market mover. Investors prefer to focus on the CPI instead of the PPI inflation measure. Later in the day, we also get Eurozone's preliminary consumer confidence index for March.
From the US, initial jobless claims for the week ended on April 14th are coming out. Expectations are for jobless claims to have risen to 242k from 234k the previous week. This would bring the 4-wk moving average down to 243k from 247k. The Philly Fed business activity index for April is also coming out.
Besides the economic indicators, in Washington, Finance ministers and Central Bank governors from the G20 will meet on the sidelines of the bi-annual conference of the IMF and the World Bank, which is from Thursday until Sunday.
NZD/USD
Support: 0.7000 (S1), 0.6970 (S2), 0.6925 (S3)
Resistance: 0.7050 (R1), 0.7075 (R2), 0.7110 (R3)
WTI
Support: 50.50 (S1), 50.00 (S2), 49.00 (S3)
Resistance: 51.50 (R1), 52.50 (R2), 53.20 (R3)
Trade Idea: AUD/USD – Stand aside
AUD/USD – 0.7521
Recent wave: Wave 5 ended at 1.1081 and major correction has commenced for fall to 0.7000 and then towards 0.6500-10
Trend: Near term down
New strategy :
Stand aside
Position: -
Target: -
Stop:-
Aussie’s retreat after meeting resistance at 0.7611 earlier this week suggests consolidation with mild downside bias is seen for weakness to 0.7485-90, however, a break of indicated previous support at 0.7473 is needed to retain bearishness and extend the fall from 0.7750 top to 0.7450-55 (50% Fibonacci retracement of 0.7158-0.7750) but oversold condition should limit downside to 0.7380-85 (61.8% Fibonacci retracement), risk from there is seen for a rebound later.
In view of this, would not chase this fall here and would be prudent to stand aside for now. Above 0.7560-65 would prolong consolidation and bring another bounce to 0.7600 but break of said resistance at 0.7611 is needed to revive bullishness, bring a stronger rebound towards resistance at 0.7680 which is likely to hold from here.
On the 4-hour chart, the move from 0.8066 is the wave 5 with i: 0.8860, ii: 0.8315, wave iii is an extended move ended at 1.0183, iv: 0.9706 and wave v has ended at 1.1081 (also the top of entire wave 5). The subsequent selloff is the major correction which is unfolding as ABC-X-ABC and 2nd A leg has ended at 0.8848, followed by a-b-c wave B which ended at 0.9758, hence, 2nd C wave is now in progress and indicated downside target at 0.7000 and 0.6950 had been met, so further fall to 0.6710-20 cannot be ruled out.
NZD/USD Candlesticks and Ichimoku Analysis
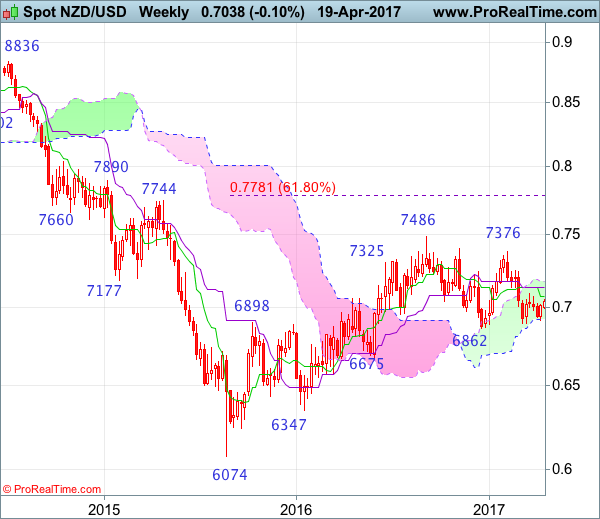
Weekly
• Last Candlesticks pattern: Shooting star
• Time of formation: 5 Sep 2016
• Trend bias: Down
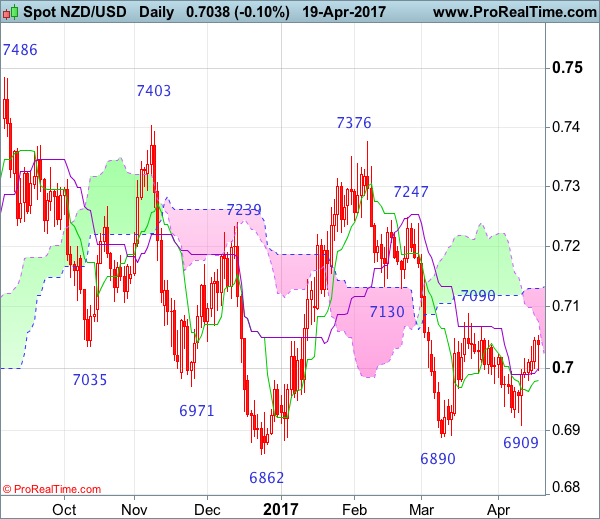
Daily
• Last Candlesticks pattern: Hammer
• Time of formation: 14 Mar 2017
• Trend bias: Near term up
NZD/USD – 0.6974
Kiwi found renewed buying interest at 0.6909 and has staged a strong rebound, retaining our view that further consolidation above recent low at 0.6890 would be seen and mild upside bias remains for test of indicated resistance at 0.7090 but break there is needed to signal another leg of rebound from 0.6890 low is underway to bring at least a retracement of recent decline from 0.7376 to the upper Kumo (now at 0.7131), however, break there is needed to retain bullishness and encourage for further subsequent rise to 0.7185-90 but resistance at 0.7247 should remain intact.
On the downside, whilst initial pullback to the Tenkan-Sen (now at 0.6981) cannot be ruled out, reckon downside would be limited to 0.6940-50 and bring another rebound later. Only a break of said support at 0.6890 would abort and revive bearishness for the fall from 0.7376 top to extend weakness to 0.6862, then towards 0.6775-80 (50% Fibonacci retracement of 0.6074-0.7486) but price should stay well above previous chart support at 0.6675.
Recommendation: Hold long at 0.6980 for 0.7180 with stop below 0.6940
On the weekly chart, as kiwi has rebounded after finding support at 0.6909 last week, retaining our near term bullishness for another bounce to 0.7090 resistance, break there would bring test of the Kijun-Sen (now at 0.7133), however, a weekly close above there is needed to add credence to our view that the fall from 0.7376 has ended at 0.6890 and encourage for further gain towards resistance at 0.7247. Having said that, as broad outlook remains consolidative, reckon upside would be limited to 0.7300-10 and price should falter below said resistance at 0.7376, bring retreat later.
On the downside, expect pullback to be limited to 0.6970-80 and bring another rebound. Only below said support at 0.6890 would abort and bring test of previous support at 0.6862, however, a breach of latter level is needed to retain bearishness and extend the erratic decline from 0.7486 top to 0.6780 (50% Fibonacci retracement of 0.6074-0.7486) and later towards previous chart support at 0.6675 which is likely to hold from here.
Technical Outlook: AUDUSD Falling Hourly Cloud/200SMA To Cap Near-Term Recovery Attempts
The Aussie dollar bounced in early Thursday's reading after strong two-day fall found support at 0.7490 and improving tone of stocks and base metals underpinned AUD's near-term recovery. Steep descend in past two days that took out important supports and weakened near-term structure, as bears approached key support at 0.7472 (lows of 10-12 Apr, reinforced by the base of rising daily cloud) loss of which would trigger fresh bearish extension of descend from 0.7747 high, towards 0.7453 and 0.7384 (Fibo 50% and 61.8% of 0.7159/0.7747 rally) respectively. Overall bearish structure sees limited recovery before fresh weakness, with falling hourly cloud (spanned between 0.7537 and 0.7556) reinforced by 200SMA (0.7549) expected to cap rallies.
Res: 0.7537, 0.7549, 0.7556, 0.7570
Sup: 0.7520, 0.7490, 0.7471, 0.7453
Far-Left And Far-Right Candidates The Most Likely To Decide France’s And European Future
After recent news and market headlines were dominated by the UK snap general election announcement, the markets are now turning their attention towards the upcoming French presidential election. The outcome of the French presidential election will most likely result in heightened volatility for the Euro and European stock markets which look likely to be most affected by the introduction of the far-right candidate Marie Le Pen.
The first round of the French election will be held this Sunday April 23. Altogether there are eleven candidates. If none of the candidates gets more than 50% of the votes in the first round, the two winners will enter the second round of the vote will be held on May 7.
The consensus thus far is that the Centrist Macron and the far-right wing Le Pen are most likely to pass into the second round, with Macron being the favourite to win the final vote. But if the past year has thought us anything, polls do not always accurately gauge public sentiment and there is a possibility that La Pen could win the election.
The far-right wing Le Pen, and the far-left wing Jean-Luc Melenchon are the focuses of the election because of their extreme political stances, and Jean-Luc Melenchon is the only candidate among the four whose share of vote saw an increase recently.
Le Pen takes a similar stance to Trump, the focus of her policies are France first, including anti-globalization, anti-immigrants, trade protectionism, repealing the Euro and reusing the Franc, and most noticeably: making France leave the EU.
Many French voters are in favour of Le Pen's policies, due to France's high unemployment rate and recent terror attacks; provoking citizens' anti-foreigner sentiment. France and Germany are the EU's largest economies. If Le Pen wins, France might leave the EU, following the UK, and triggering a level of uncertainty that could well lead to the downfall of the single market.
Regardless of this weekend's outcome we can expect to see volatility across European markets as the election moves towards the second round of voting on May 7th.