Sample Category Title
Daily Technical Analysis: GBP/USD Retracement Returns To 38.2% Fibonacci At 1.2750
Currency pair GBP/USD
The Members of the British Parliament have approved the Prime Minister’s plan yesterday to organise an early general election on June 8. The vast majority of the Parliament Members approved the motion (522 out of 650) clearing the bar of the two-thirds needed for accepting the plan.
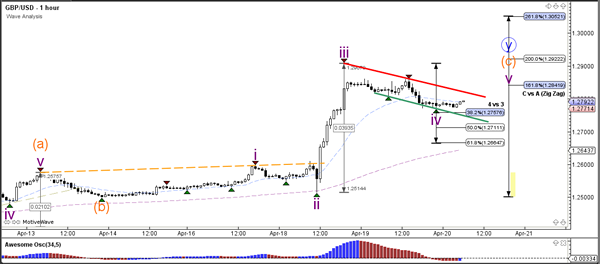
The election news did not impact the GBP/USD as much as it did on Tuesday. The Cable currency moved sideways which is forming a bull flag chart pattern (green/red lines) in the meantime. Price is testing the 61.8% Fibonacci level of wave 4 (purple) and could show one more higher high if it breaks above the bull flag.
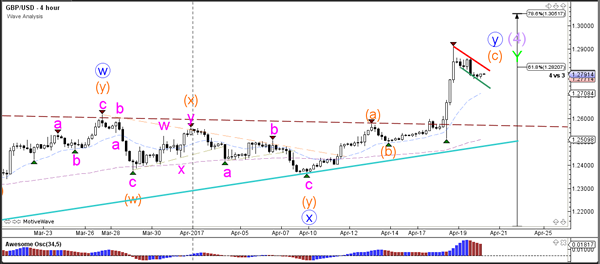
The GBP/USD retracement has reached the 38.2% Fibonacci retracement level at 1.2750 which could act as a bounce zone if price is indeed in a wave 4 (purple) correction. A break below the 61.8% Fibonacci level makes a wave 4 invalid. A break above the bull flag could see a wave 5 (purple) develop.
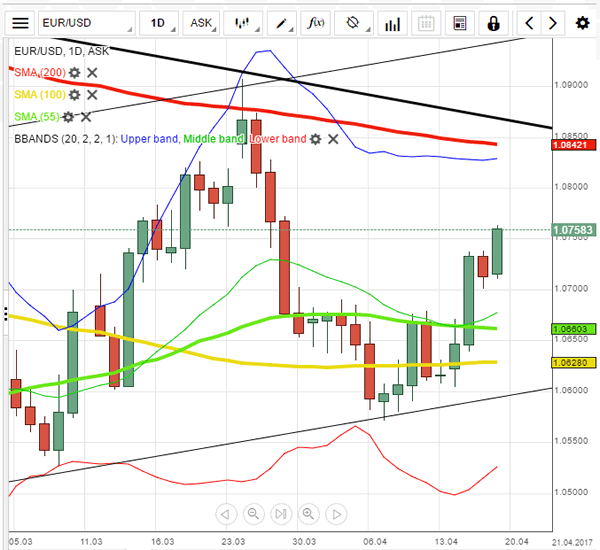
Currency pair EUR/USD
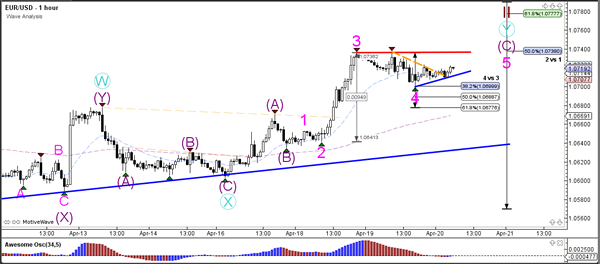
The EUR/USD has paused at the 50% Fibonacci retracement level of wave 2 (brown) but a continuation breakout could see price challenge higher Fibonacci levels.
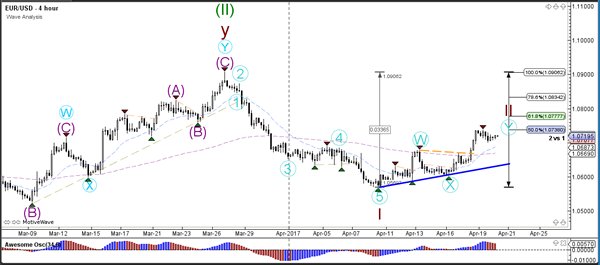
The EUR/USD has retraced to the 38.2% Fibonacci level of wave 4 (pink). A break below the 61.8% Fib invalidates the wave 4 (pink) but otherwise a wave 5 (pink) within wave C (purple) is likely to develop.
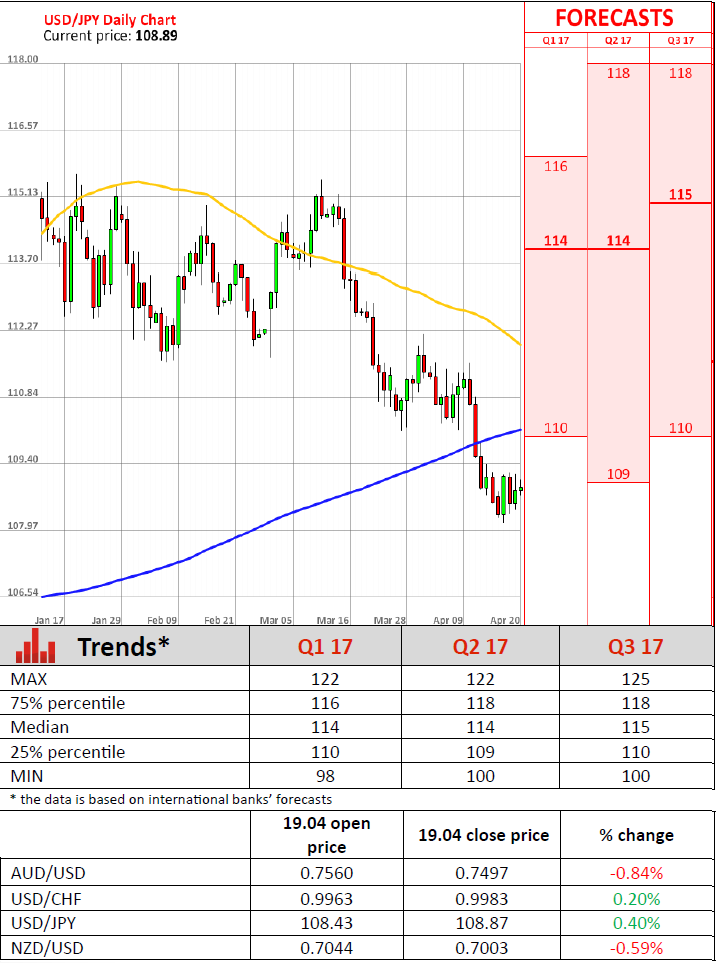
Currency pair USD/JPY
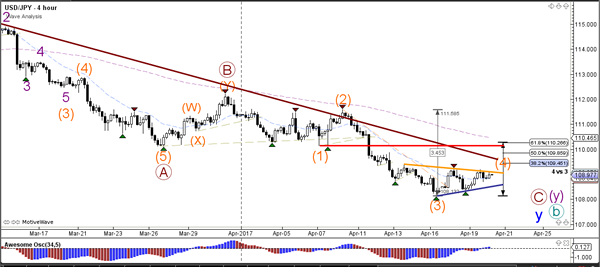
The USD/JPY is building a potential wave 4 correction (orange), which would become invalid if price retraced above the bottom of wave 1 (red line). A break below the support level (blue) could indicate a bearish breakout and completion of wave 4 (orange).
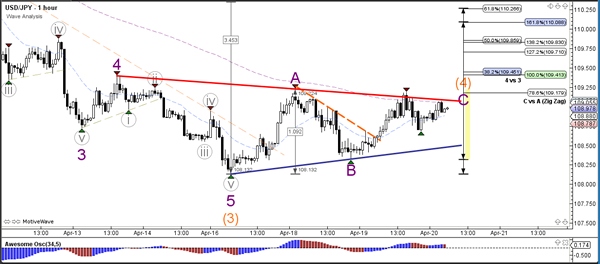
The USD/JPY could be building an ABC (purple) zigzag correction towards the Fibonacci levels of wave 4 (orange) where a break above the resistance level (red) could spark a wave C (purple).
Euro Zone Inflation Growth Slows In March In Line With Forecasts
'…We have not yet seen sufficient evidence to materially alter our assessment of the inflation outlook – which remains conditional on a very substantial degree of monetary accommodation. Hence a reassessment of the current monetary policy stance is not warranted at this stage.' - Mario Draghi, European Central Bank
Consumer inflation in the Euro zone rose in line with analysts' expectations last month, official figures revealed on Wednesday. Eurostat reported that its Final Consumer Price Index came in at 1.5%, compared to the preceding month's gain of 2.0%. However, the March figure came in line with forecasts. Back in February, the headline inflation rate hit the European Central Bank's target, raising expectations of a major change in the Bank's monetary policy. Nevertheless, following the February release, the ECB President Mario Draghi noted that inflation was in large part boosted by rising oil prices, while core inflation growth remained subdued. Wednesday's data confirmed Mario Draghi's outlook and lowered the possibility of the ECB tightening its monetary policy. The Bank's QE programme is set to run until December. Policymakers turned their attention to the upcoming elections in France and the region's largest economy, Germany, which continued boosting uncertainty in the region. Therefore, analysts do not expect the ECB to act until the presidential race ends. The first round of the French presidential election will be held on April 23. Latest opinion polls showed that Emmanuel Macron and Marine le Pen would likely make it to the final round.
US Crude Oil Inventories Post 1.0M-Barrel Drop Last Week
'A build to gasoline inventories is tilted a little bearish, although a build of 2.5 million barrels on the Gulf Coast was in response to higher refining activity.' - Matt Smith, ClipperData
US crude oil inventories dropped last week, whereas gasoline stocks rose unexpectedly, the Energy Information Administration reported on Wednesday. According to the EIA, US crude stocks fell 1.0M barrels in the week ended April 14, following the preceding week's decline of 2.2M barrels and meeting market analysts' expectations. Nevertheless, gasoline inventories climbed 1.5M barrels, falling behind a 1.9M-barrel fall forecast. Unusually high gasoline stockpiles raised concerns and sent the gasoline price 0.6% lower to $1.0701. The price of oil also dropped following the release. West Texas Intermediate futures fell to $52.24 per barrel, whereas Brent futures slipped to $54.75 per barrel. Refineries added 241,000 barrels per day in crude oil production, with the Gulf Coat contributing the most to the increase. Thus, the utilisation rate advanced 1.9% last week. Crude inventories at the Cushing, Oklahoma, dropped 778,000 barrels. Data also showed that distillate stockpiles that include heating oil and diesel decreased 2M barrels, compared to a 1M-barrel decline forecast. The EIA highlighted that distillate inventories hit their lowest levels since November 2015. Yesterday, the OPEC reported that it would meet with non-OPEC countries at its next conference on May 25 to discuss further oil production cuts.
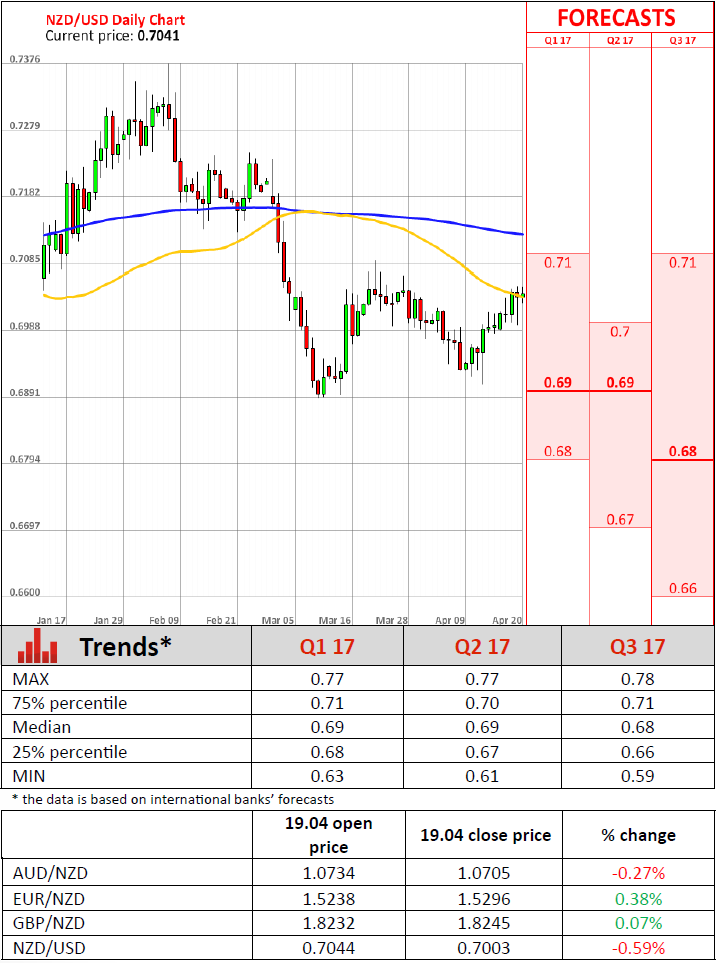
New Zealand(NZ) Inflation Rises At Stronger Than Expect Rate In Q1 Of 2017
'The core reading is still low and the trimmed mean is creeping back into the target band but it's still on the lower end. Inflation is still pretty soft by historical standards. For us, the RBNZ will probably just remain on the sidelines from here.' - Tom Kennedy, JP Morgan
Inflation growth in New Zealand hit its five-year high in the three-month period to March, surprising markets. Statistics New Zealand reported on Thursday that inflation rose at an annualised 2.2% rate in the Q1 of 2017, the highest level in five years. Thus, the inflation rate hit the mid-point of the Reserve Bank of New Zealand's inflationary target range of 1-3% for the first time in more than a year. On a quarterly basis, the Consumer Price Index climbed 1% in the March quarter, while market analysts anticipated a slighter increase of 0.8%. Therefore, annual inflation growth surpassed analysts' expectations for a 2.0% rise. Following the release, the New Zealand Dollar rose from 0.7000 to 0.7042 against its US counterpart. The Q1 inflation acceleration was in large part driven by higher oil and food prices and a tax hike on alcohol and tobacco. The housing market also provided a significant boost to inflation in the reported quarter. Nevertheless, New Zealand's Central bank is unlikely to change its monetary policy despite stronger-than-expect inflation data. The Bank's interest rates are also expected to remain unchanged at record lows of 1.75%. Excluding volatile items, such as petrol, alcohol and cigarettes, annual inflation climbed just 1.5% but remained within the Bank's target range.
EUR/USD Analysis: Remains Below Resistance
'Twenty-five Nobel Prize-winning economists have united to warn far-right candidate Marine Le Pen against using their ideas to campaign against the euro and the European Union in her bid for the French presidency.' – John Follain, Bloomberg
Pair's Outlook
On Thursday morning the common European currency against the Greenback remained below the second weekly resistance, which stopped the pair's Tuesday's jump. The resistance level is located at the 1.0729 mark. It is possible that the currency exchange rate will retreat to the 1.0687 level, where the 20-day SMA together with the monthly PP are located at. On the other hand a break of the weekly R2 would free up the range up to the weekly R3, which is located at the 1.0780 level. However, most likely the pair will remain at the current levels, as the markets are expecting the French presidential elections.
Traders' Sentiment
Traders remain bearish, as 53% of open positions are short. However, 54% of trader set up orders are to buy the Euro.
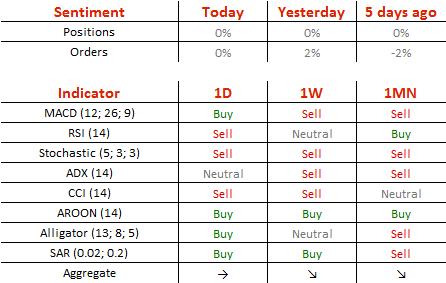
GBP/USD Analysis: Struggles To Remain At Seven-Month High
'The USD side also looks supportive for further gains in cable, which reflects softer US data surprises, a longer timeline for fiscal reform and a shift in Fed pricing.' – TD Securities (based on FXStreet)
Pair's Outlook
As was anticipated, the GBP/USD currency pair underwent a correction on Wednesday, passing through only the immediate support, namely the weekly R3. According to technical studies, the Cable should continue to weaken today, with the upper Bollinger band and the weekly R3 now acting as a relatively strong resistance area. In case bears do take over the market, the Sterling would risk slipping under 1.27, despite the weekly R2 providing support around that area. Ultimately, a plunge towards 1.2620 is possible, as geopolitical factors keep weighing on the given pair. On the other hand, another leg up is unlikely to cause the 1.2850 mark to get pierced today.
Traders' Sentiment
Today both the market sentiment and all pending orders reached a perfect equilibrium.
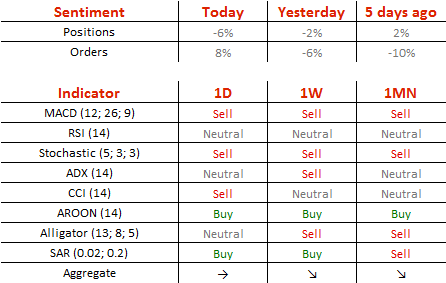
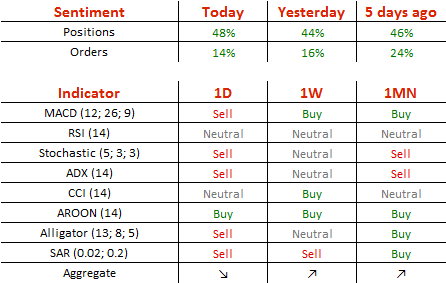
USD/JPY Analysis: Anchored Around The 200-Day SMA
'We still think the dollar is going to strengthen over time based on the outlook for US monetary policy... but for now, with markets not heavily focused on monetary policy, it could explain this consolidation (for the greenback).' – Wells Fargo (based on Business Recorder)
Pair's Outlook
The US Dollar managed to appreciate against the Yen on Wednesday, with the monthly S1 limiting upside volatility. Ultimately, trade closed in front of the 200-day SMA, but this level remains an unreliable resistance. Nevertheless, the Buck is still unlikely to post significant gains, as supply, represented by the monthly S1, is still intact. However, the RSI indicator suggests the Greenback is to keep recovering, thus, preserving the descending channel pattern. Overall, the majority of signals are bullish, despite other bearish signs. A lot of uncertainty is currently surrounding the USD/JPY, especially since political events and factors continue to pressure the US currency.
Traders' Sentiment
Nearly three quarters (74%) of all open positions are long today, whereas 57% of all pending orders are to acquire the Buck.
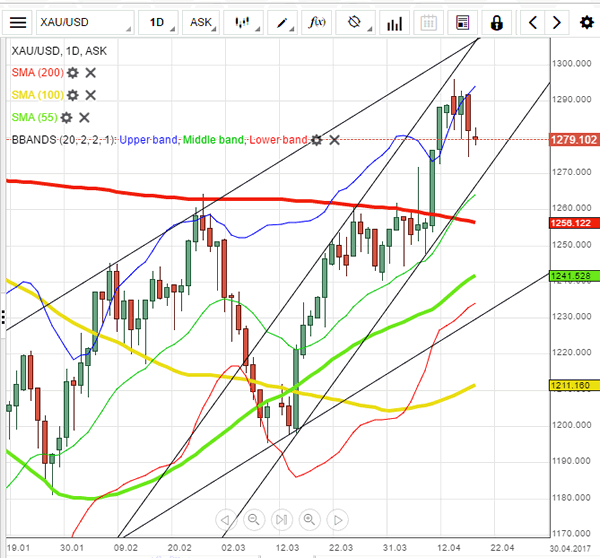
Gold Analysis: Trades Above Retracement Level
'It appears that large fund selling in the Far East overnight is also putting pressure on the price of gold, and this move has kept the Wall Street gold traders guarding their long positions.' – Walter Pehowich, Dillon Gage Metals (based on Reuters)
Pair's Outlook
As forecasted before the yellow metal has retreated to the support of the 61.80% Fibonacci retracement level, above which it remained on Thursday morning. The retracement level is located at the 1,278.73 level. It is supported by the monthly R1 at 1,275.52 and the weekly PP at 1,274.84. It is most likely that after finding support during the late hours of Wednesday trading the bullion's price will resume the surge, which was stopped short before reaching the 1,300 mark. The reason for that is the fact that there are no resistance levels up to the 1,300 level.
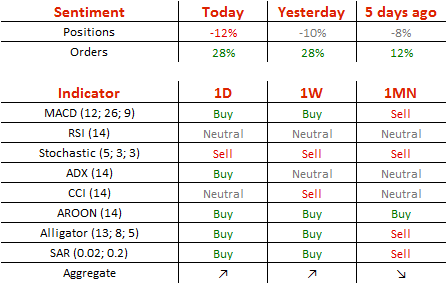
Traders' Sentiment
SWFX traders are bearish on the metal, as 56% of open positions are short. However, 64% of trader set up orders are to buy the metal.
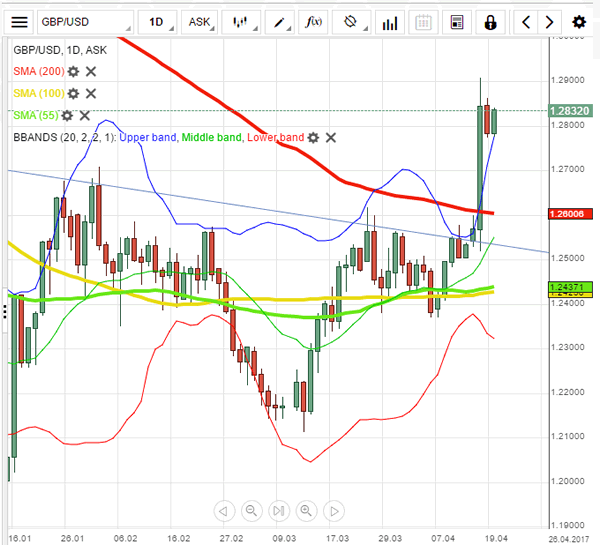
Technical Outlook: Cable – Hourly Cloud Contained Correction, N/T Focus Is Turning Higher
Cable bounced back above 1.2800 after correction from fresh multi-month high at 1.2904 was contained by thickening hourly cloud at 1.2770 that sidelines immediate threats of deeper pullback.
Bullish technical studies and positive sentiment on early election decision keep the pair supported.
However, the downside would remain vulnerable as daily studies are overbought, but no firmer bearish signal seen so far.
Hourly cloud (spanned between 1.2773 and 1.2708) marks significant support and break below it would signal further easing which would expose key support at 1.2620 (200SMA).
Tuesday's high at 1.2859 marks the first pivot ahead of key 1.2904 barrier, break of which would unlock psychological 1.3000 barrier.
Res: 1.2859, 1.2904, 1.2950, 1.3000
Sup: 1.2800, 1.2770, 1.2755, 1.2708
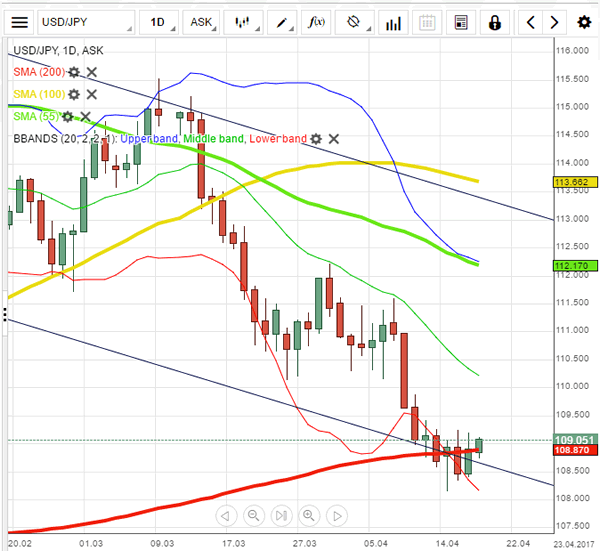
Technical Outlook: USDJPY Remains Biased Lower, Extended Consolidation To Precede Fresh Bears
The pair is trading in extended consolidation around 200SMA (currently at 108.85) after recent bear-leg from 111.56 (10 Apr high) found footstep just above 108.00 round-figure support. Near-term action is directionless and entrenched within 108.30/109.20 range, as studies on lower timeframes are neutral. Larger picture, however, shows bearish, with current consolidation seen as a pause of larger downtrend which eyes initial target at 107.84 (Fibo 61.8% of larger 101.17/118.65 rally) and may extend further down on break of the latter. Limited upside is seen for now, with falling 10SMA (currently at 109.33) reinforcing initial 109.20 barrier and extended upticks expected to hold below daily Tenkan-sen (currently at 109.84) and former lows at 110.10.
Res: 109.20, 109.33, 109.84, 110.10
Sup: 108.70, 108.30, 108.11, 107.84