
Sample Category Title
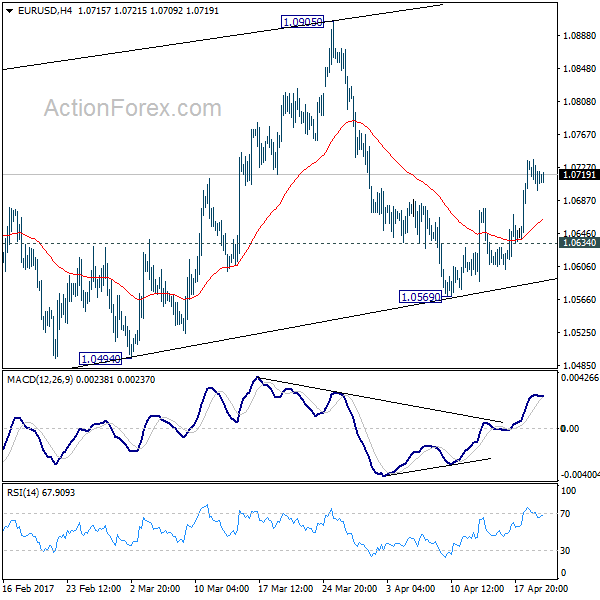
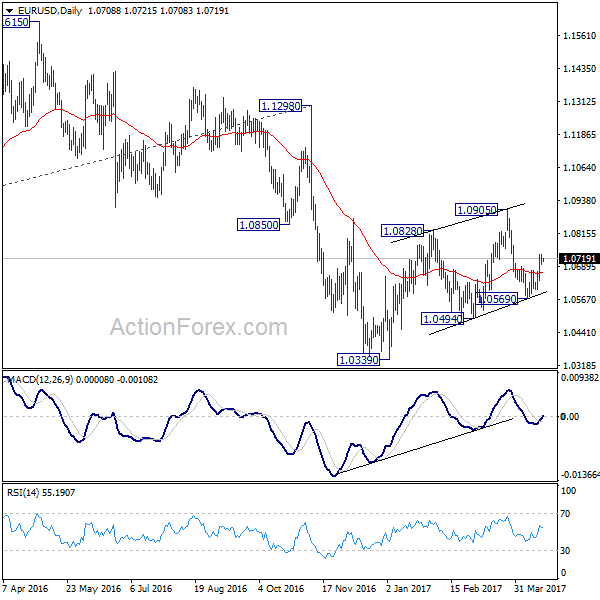
EUR/USD Daily Outlook
Daily Pivots: (S1) 1.0694; (P) 1.0715 (R1) 1.0732; More....
With 1.0634 minor support intact, further rise is expected in EUR/USD for 1.0905 resistance. As noted before, corrective rise from 1.0339 is still in progress with 1.0569 as another rising leg. Further rally would be seen to 1.0905 resistance and above. We'll pay attention to topping signal above 1.0905 again, as we'd expect larger down trend to resume later. On the downside, break of 1.0634 minor support will turn intraday bias back to the downside for 1.0569 instead.
In the bigger picture, as long as 1.1298 key resistance holds, whole down trend from 1.6039 (2008 high) is still expected to continue. Break of 1.0339 low will send EUR/USD through parity to 61.8% projection of 1.3993 to 1.0461 from 1.1298 at 0.9115. However, considering bullish convergence condition in weekly MACD, break of 1.1298 will indicate term reversal. this would also be supported by sustained trading above 55 week EMA.
Daily Technical Outlook And Review: EUR/USD, GBP/USD, AUD/USD, USD/JPY, USD/CAD, USD/CHF, DOW 30, GOLD
A note on lower timeframe confirming price action...
Waiting for lower timeframe confirmation is our main tool to confirm strength within higher timeframe zones, and has really been the key to our trading success. It takes a little time to understand the subtle nuances, however, as each trade is never the same, but once you master the rhythm so to speak, you will be saved from countless unnecessary losing trades. The following is a list of what we look for:
- A break/retest of supply or demand dependent on which way you're trading.
- A trendline break/retest.
- Buying/selling tails ... essentially we look for a cluster of very obvious spikes off of lower timeframe support and resistance levels within the higher timeframe zone.
- Candlestick patterns. We tend to only stick with pin bars and engulfing bars as these have proven to be the most effective.
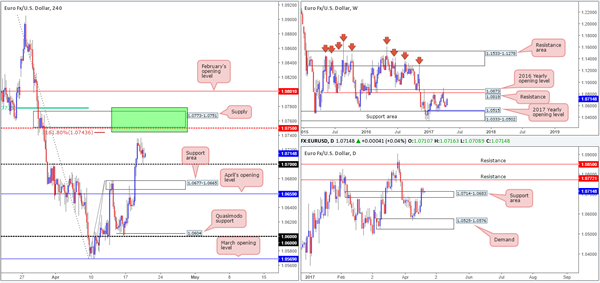
EUR/USD
In the early hours of yesterday's segment, the pair, as you can see, began to fade around the 1.0735 region. This consequently persuaded the shared currency to retest the 1.07 handle as support. In view of the somewhat compressed approach (little active demand – see H4 wicks) to this psychological band and the fact that daily candles are seen retesting a support area formed at 1.0714-1.0683, this may encourage buyers into the market today. Despite this, the main interest here remains around 1.0773-1.0751: a H4 supply zone that sits in between a H4 mid-level resistance at 1.0750/161.8% H4 Fib extension at 1.0743 (drawn from the low 1.0569) and a H4 61.8% Fib resistance at 1.0777 (taken from the high 1.0905). Also noteworthy is the daily resistance seen at 1.0772 located within the upper limits of the said H4 supply base.
Our suggestions: The above points all suggest that the single currency may find resistance within our green area drawn on the H4 chart at 1.0777/1.0743. Seeing as how the area is rather large and the weekly chart shows room to appreciate beyond the H4 sell zone, we'll wait for a reasonably sized H4 bearish candle to print within before looking to sell.
Data points to consider: US Philly Fed manufacturing survey report and US weekly unemployment claims at 1.30pm, US Treasury Sec Steven Mnuchin speaks at 6.15pm GMT+1.
Levels to watch/live orders:
- Buys: Flat (stop loss: N/A).
- Sells: 1.0777/1.0743 ([waiting for a reasonably sized H4 bear candle to form before pulling the trigger is advised] stop loss: ideally beyond the candle's wick).
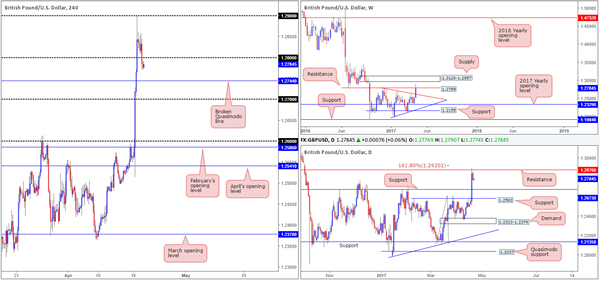
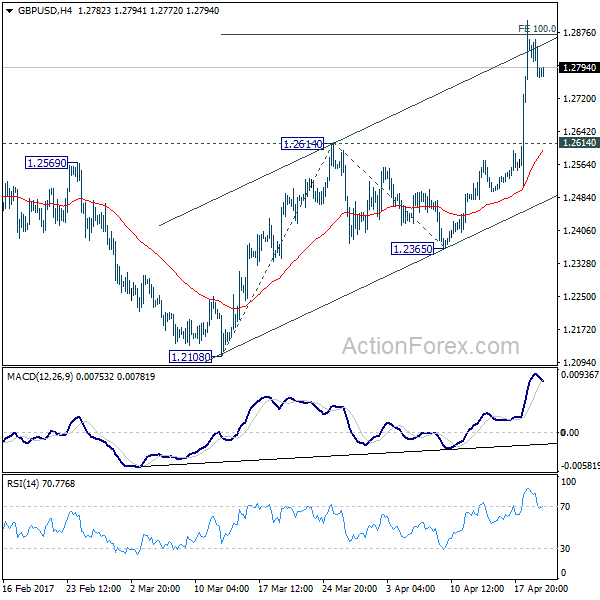
GBP/USD
During the course of yesterday's sessions, we saw the pair trim part of Tuesday's gains as price extended its downside move from the 1.29 handle. Bolstered by a daily resistance coming in at 1.2876 cable eventually managed to close below the 1.28 hurdle, and is now seen poised to test the H4 broken Quasimodo line penciled in at 1.2744. What Wednesday's move also accomplished was bringing weekly price back below resistance at 1.2789.
Although we believe a bounce is likely to be seen from the H4 broken Quasimodo line, trading long from here when both weekly and daily price are trading from structure is chancy, even with additional confirmation. Therefore, the best we feel we can do here is wait and see if the H4 candles retest the 1.28 line as resistance.
Our suggestions: In the event that H4 price retests 1.28 and manages to form a lower-timeframe sell signal (see the top of this report), a short from here is likely to achieve 1.2744, and quite possibly beyond should higher-timeframe sellers get involved.
Data points to consider: BoE Gov. Carney is scheduled to speak at 4.30pm and also 5.30pm in Washington DC. US Philly Fed manufacturing survey report and US weekly unemployment claims at 1.30pm, US Treasury Sec Steven Mnuchin speaks at 6.15pm GMT+1.
Levels to watch/live orders:
- Buys: Flat (stop loss: N/A).
- Sells: 1.28 region ([waiting for additional lower-timeframe confirming price action is advised] stop loss: dependent on where one confirms this area).
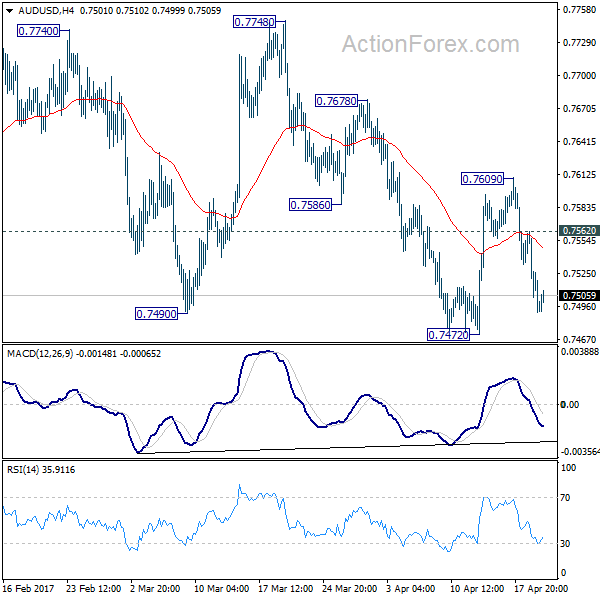
AUD/USD
The value of the Aussie weakened in aggressive fashion on Wednesday, ultimately clearing out bids around the 0.75 handle, which is currently being retested as resistance. Consequent to this, weekly price shows that the majority of last week's gains have been erased and the unit is now seen trading within the lower limits of a support area at 0.7524-0.7446. What's more, daily action is also now seen trading within the walls of a support area formed at 0.7449-0.7506, which happens to bolster the H4 demand at 0.7449-0.7475: the next downside target on the H4 scale.
Our suggestions: Given that the H4 demand is placed within both the said weekly and daily support areas, a long from here is a possibility. However, seeing as this would be considered the areas second time back, we would not feel comfortable pulling the trigger without additional confirmation in the form of a reasonably sized H4 bullish candle.
Data points to consider: US Philly Fed manufacturing survey report and US weekly unemployment claims at 1.30pm, US Treasury Sec Steven Mnuchin speaks at 6.15pm GMT+1.
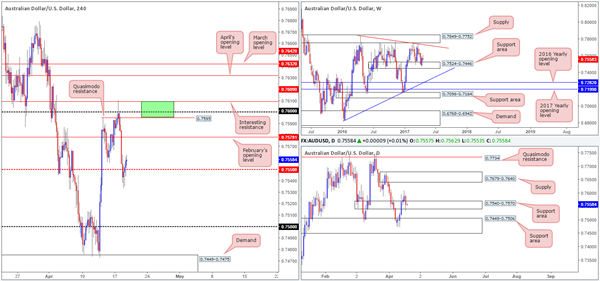
Levels to watch/live orders:
- Buys: 0.7449-0.7475 ([waiting for a reasonably sized H4 bull candle to form before pulling the trigger is advised] stop loss: ideally beyond the candle's tail).
- Sells: Flat (stop loss: N/A).
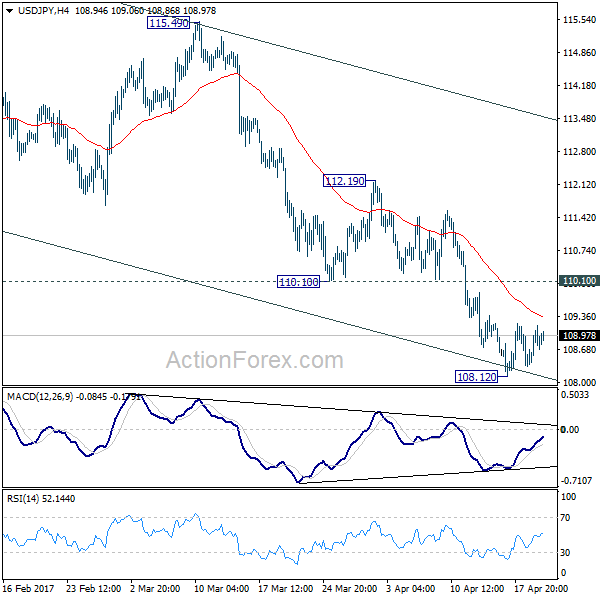
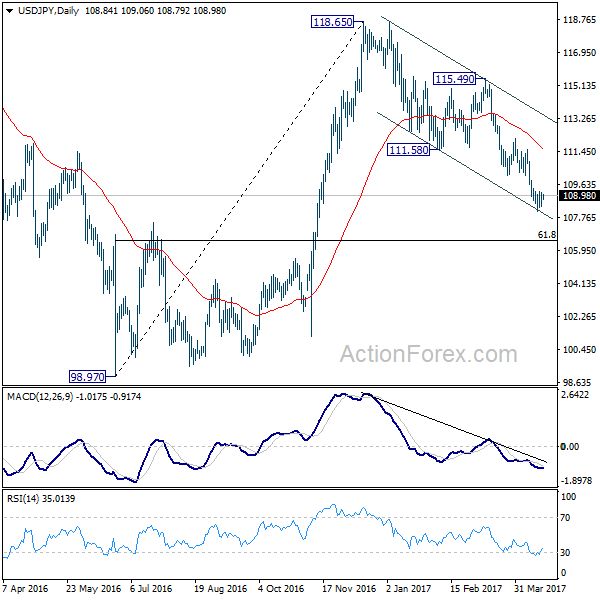
USD/JPY
Beginning with a look at the weekly timeframe this morning, we can see that candle action is hovering between a resistance area at 111.44-110.10 and a support area drawn from 105.19-107.54. Overall, the bears look to have control at the moment, and therefore a test of the said support zone is possible. The story on the daily chart, however, shows price to be trading within the walls of a demand base at 108.55-109.17. Technically speaking though, the bulls look drained here which could eventually spark further selling down to the support area lodged at 107.15-107.90.
Swinging across to the H4 candles, upside remains capped by the 109 handle following Monday's bounce from demand at 107.77-108.21. In view of the current H4 demand being bolstered by the said daily support area, which itself is supported by the aforementioned weekly support area, the 109 handle could be consumed today.
Our suggestions: In the event that a decisive H4 close is seen beyond 1.09 and price retests the boundary as support, we would, assuming that the retest is followed up with a lower-timeframe buy signal (see the top of the report), look to buy, targeting the H4 mid-level resistance at 109.50 and the 110 handle (represents the lower edge of the weekly resistance area mentioned above at 111.44-110.10).
Data points to consider: US Philly Fed manufacturing survey report and US weekly unemployment claims at 1.30pm, US Treasury Sec Steven Mnuchin speaks at 6.15pm GMT+1.
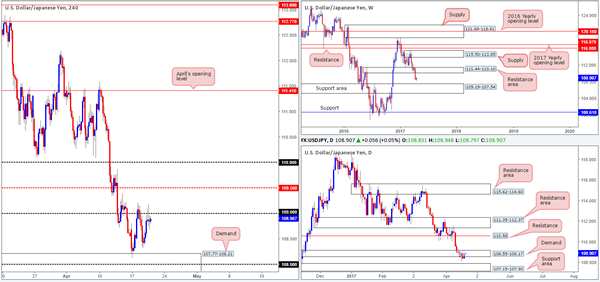
Levels to watch/live orders:
- Buys: Watch for H4 price to engulf 109 and then look to trade any retest seen thereafter ([waiting for additional lower-timeframe confirming price action to form following the retest is advised] stop loss: dependent on where one confirms this number).
- Sells: Flat (stop loss: N/A).
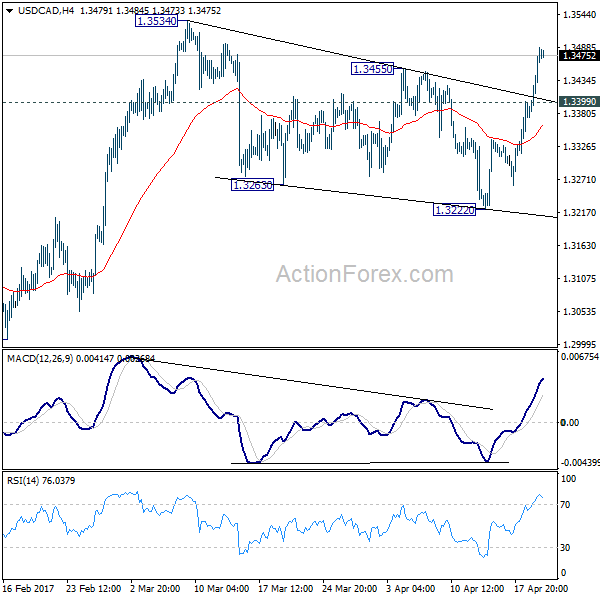
USD/CAD
The USD/CAD surged north for a third consecutive day on Wednesday, as oil prices took a hit to the mid-section. After running through multiple H4 resistances, the pair is now seen testing the underside of a supply zone at 1.3495-1.3485 that is positioned directly below the 1.35 handle.
Over on the daily picture, the buyers and sellers are seen battling for position within supply coming in at 1.3494-1.3439. Weekly price on the other hand, has recently crossed back above the 2017 yearly opening base line at 1.3434. Under normal circumstances, this would be considered a rather important bullish cue. However, since we know that there is a somewhat strong-looking double-top formation located nearby around the 1.3530 neighborhood (see green circle), the bulls could very well struggle here.
Our suggestions: Personally, shorting at the current H4 supply is risky given the round number 1.35 lurking just above. It has ‘fakeout' written all over it! As such, should price happen to print a H4 selling wick that pierces above the current H4 supply and taps 1.35, we would look to short this candle, targeting the support area seen at 1.3450-1.3437.
Data points to consider: US Philly Fed manufacturing survey report and US weekly unemployment claims at 1.30pm, US Treasury Sec Steven Mnuchin speaks at 6.15pm GMT+1.
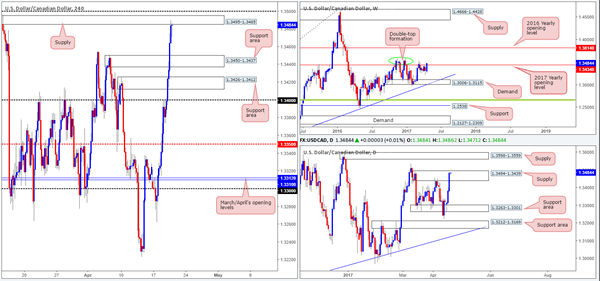
Levels to watch/live orders:
- Buys: Flat (stop loss: N/A).
- Sells: Look for price to print a H4 selling wick that pierces above the current H4 supply and taps 1.35 – this is a cue to sell (stop loss: beyond the selling wick).
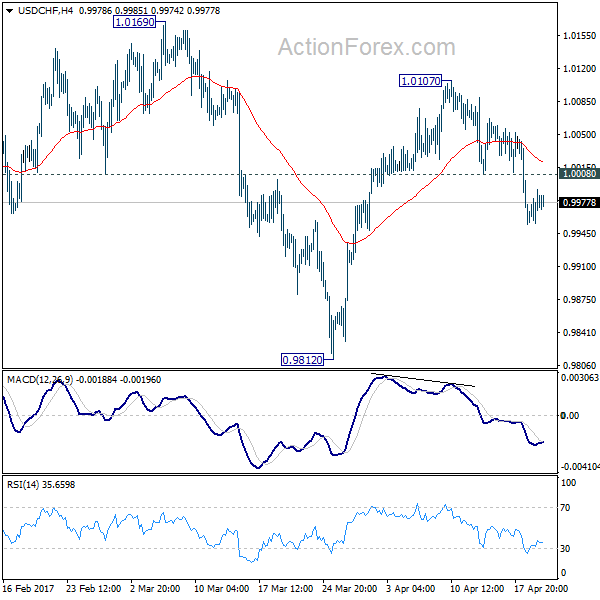
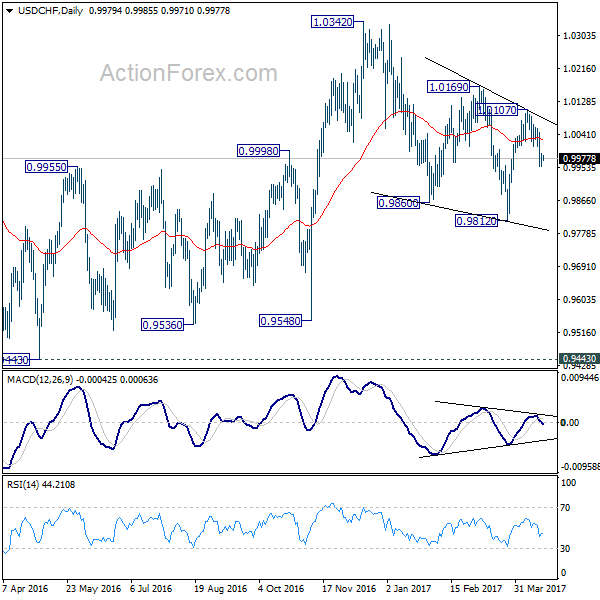
USD/CHF
With weekly price seen trading below the 2016 yearly opening level at 1.0029, the bears could potentially continue pumping the pair down to support penciled in at 0.9861. On the other side of the coin, however, we have fresh bids coming in on the daily chart from within the lower limits of a support zone drawn in at 1.0001-0.9957. Given the difference of opinion being seen on the bigger picture right now, let's see what we can wrinkle out of the H4 chart…
As you can see, the H4 candles are currently loitering between parity (1.0000) and a H4 mid-level support at 0.9950. Notable features on this scale is the nearby April opening level at 1.0016 plotted just above 1.0000, and the H4 demand seen located below 0.9950 at 0.9913-0.9927.
Our suggestions: A retest of 1.0016/1.0000 (green zone) would, if a reasonably sized H4 bearish candle took shape, be a relatively nice place to short from given weekly flow. The reason for requiring a confirming bearish candle prior to entry is simply due to the fact that daily buyers could push this market higher.
Data points to consider: US Philly Fed manufacturing survey report and US weekly unemployment claims at 1.30pm, US Treasury Sec Steven Mnuchin speaks at 6.15pm GMT+1.
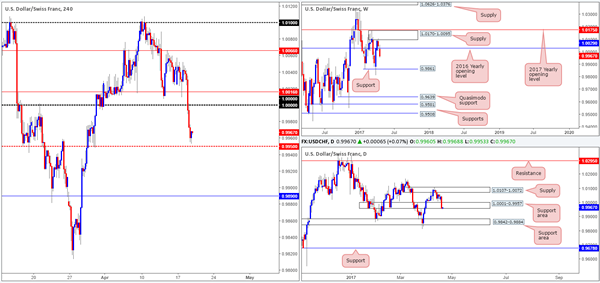
Levels to watch/live orders:
- Buys: Flat (stop loss: N/A).
- Sells: 1.0016/1.0000 ([waiting for a reasonably sized H4 bear candle to form before pulling the trigger is advised] stop loss: ideally beyond the candle's wick).
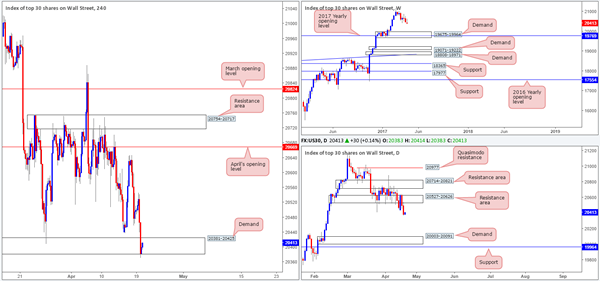
DOW 30
Although the index clocked fresh lows yesterday, the structure of this market remains unchanged. Weekly flow still looks poised to extend the pullback seen from record highs of 21170 down to 19675-19964: a demand area that's bolstered by the 2017 yearly opening level at 19769. Alongside this, daily bears are currently in a strong position right now. Assuming that the sellers remain in the driving seat here, the next downside target can be seen around demand at 20003-20091, which happens to sit directly above the said weekly demand.
As highlighted in Wednesday's report, before one looks to go about shorting this market it might be worth noting that there's a H4 demand area at 20381-20425 to contend with first. Once this area is cleared, the daily demand will likely be brought into the picture. As you can see, the H4 candles are seen testing this H4 demand base as we write. The bulls are showing some interest, but given the higher-timeframe picture it's unlikely going to amount to anything notable.
Our suggestions: Sit on your hands and wait for the H4 demand to be taken out (a H4 close). Once/if this comes to fruition, one can then look at shorting any retest seen to the underside of this zone (a reasonably sized H4 bear candle is required prior to pulling the trigger), targeting the daily demand mentioned above.
Data points to consider: US Philly Fed manufacturing survey report and US weekly unemployment claims at 1.30pm, US Treasury Sec Steven Mnuchin speaks at 6.15pm GMT+1.
Levels to watch/live orders:
- Buys: Flat (stop loss: N/A).
- Sells: Watch for the H4 demand at 20381-20425 to be engulfed and then look to trade any retest seen thereafter ([waiting for a reasonably sized H4 bear candle to form following the retest is advised] stop loss: ideally beyond the candle's wick).
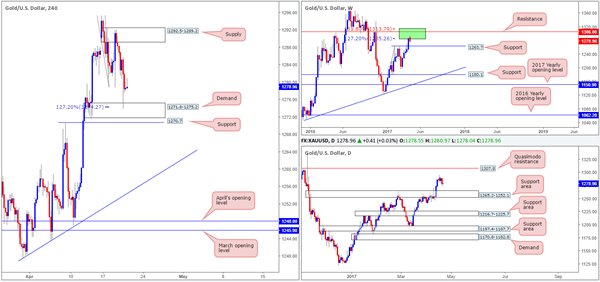
GOLD
In recent sessions, the yellow metal continued to drive lower after touching base with a H4 supply zone seen at 1292.5-1289.2. The move, as you can see, completed at a H4 AB=CD 127.2% ext. at 1274.2, which happens to be housed within a H4 demand area at 1271.8-1275.2. Although this zone has already done a fine job of supporting the bulls, both weekly and daily structure show that the bears could remain in control.
Weekly flow shows price trading nicely from two Fibonacci extensions 161.8/127.2% at 1313.7/1285.2 taken from the low 1188.1 (green zone), while daily action has room to stretch down to a support area marked at 1265.2-1252.1 (a weekly support line at 1263.7 is seen housed within this daily area – the next downside target on this scale).
Our suggestions: We do not see a lot to hang our hat on at the moment. Here's why:
A long would, of course, place one against potential weekly and daily sellers.
A short, although supported by higher-timeframe flow, is risky given the current H4 demand and nearby H4 support at 1270.7. Even with a H4 close seen beyond these two areas, price would then be too close to the top edge of the daily support area to consider a sell!
Maybe we're missing something here, but it seems like we're trapped at both ends!
Levels to watch/live orders:
- Buys: Flat (stop loss: N/A).
- Sells: Flat (stop loss: N/A).
GBP/USD Daily Outlook
Daily Pivots: (S1) 1.2743; (P) 1.2801; (R1) 1.2833; More...
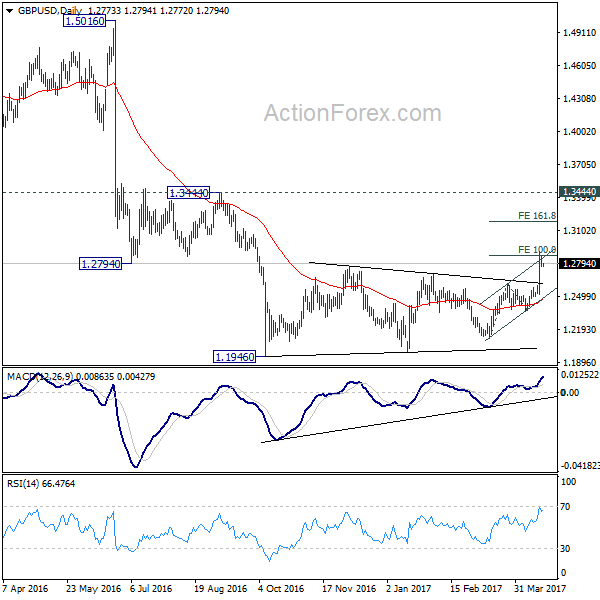
Further rise is expected in GBP/USD as long as 1.2614 resistance turned support holds. Firm break of 100% projection of 1.2108 to 1.2614 from 1.2365 at 1.2871 will target 161.8% retracement at 1.3184. Still, price actions from 1.1946 are seen as a correction. Hence we'd expect strong resistance below 1.3444 to bring larger down trend resumption. On the downside, break of 1.2614 resistance turned support will turn bias back to the downside for 1.2365 support first.
In the bigger picture, fall from 1.7190 is seen as part of the down trend from 2.1161. There is no sign of medium term reversal yet. Sustained trading below 61.8% projection of 2.1161 to 1.3503 from 1.7190 at 1.2457 will target 100% projection at 0.9532. Overall, break of 1.3444 resistance is needed to confirm medium term bottoming. Otherwise, outlook will remain bearish.
USD/CHF Daily Outlook
Daily Pivots: (S1) 0.9961; (P) 0.9976; (R1) 0.9997; More.....
With 1.0008 minor resistance intact, intraday bias in USD/CHF remains on the downside at this point. Rebound from 0.9812 has completed at 1.0107 and correction from 1.0342 is still in progress. Such correction should have started another falling leg. Deeper decline would be seen for 0.9812 support and possibly below. On the upside, above 1.0008 minor resistance will turn bias back to the upside for 1.0107 resistance instead.
In the bigger picture, we're still maintaining that firm break of 1.0342 key resistance is needed to confirm underlying bullish momentum in the cross. However, the corrective nature of the fall from 1.0342 is starting to give the medium term outlook a bullish favor. Hence, in stead of looking for topping signal around 1.0342, we'd now pay closer attention to upside acceleration as USD/CHF approaches this level again.
European Open Briefing: Asian Stock Markets Recovered Slightly After Several Days Of Losses
Global Markets:
- Asian stock markets: Nikkei gained 0.20 %, Hang Seng rose 0.25 %, Shanghai Composite and ASX 200 both up 0.15 %
- Commodities: Gold at $1281 (-0.20 %), Silver at $18.15 (-0.10 %), WTI Oil at $51.20 (+0.60 %), Brent Oil at $53.35 (+0.75 %)
- Rates: US 10-year yield at 2.21, UK 10-year yield at 1.06, German 10-year yield at 0.20
News & Data:
- New Zealand CPI (QoQ) (Q1): 1.00% (est 0.80%, prev 0.40%)
- New Zealand CPI (YoY) (Q1): 2.20% (est 2.00%, prev 1.30%)
- Australia NAB Business Confidence (Q1): 6 (prev 6)
- PBOC fixes yuan at 6.8792, weakens most since March 29
- Asian stocks set for cautious start on weak U.S. cues – RTRS
- Oil prices claw back ground after sharp drop, buoyed by U.S. crude stock dip – RTRS
Markets Update:
Asian stock markets recovered slightly after several days of losses. However, sentiment remains mixed as investors are nervous ahead of the French election over the weekend. Further, geopolitical risks are also weighing on the market.
The US Dollar regained some strength. EUR/USD fell back to 1.0710 in Asia, while GBP/USD declined to 1.2770 after Tuesday's two percent rally. Support is now seen at 1.2750 and again ahead of 1.27. The Pound is likely to remain bid in the near-term.
Meanwhile, USD/JPY briefly broke back above 109, but momentum is still weak. Strong resistance is seen at 109.20/30, followed by 109.80.
The New Zealand Dollar was the strongest currency overnight. New Zealand inflation data beat expectations and NZD/USD rallied from 0.70 to 0.7045. The Australian Dollar managed to benefit a bit from the NZD flows as well, and rose from 0.7490 to 0.7510.
Upcoming Events:
- 13:30 GMT – US Initial Jobless Claims
- 13:30 GMT – US Philadelphia Fed Manufacturing Index
USD/JPY Daily Outlook
Daily Pivots: (S1) 108.42; (P) 108.79; (R1) 109.23; More....
USD/JPY's consolidation from 108.12 temporary low is still in progress and intraday bias remains neutral. Near term outlook remains bearish as rise from 98.97 is finished at 118.65 and fall from there would extend. On the downside, break of 108.12 will target 61.8% retracement of 98.97 to 118.65 at 106.48. Sustained break there will pave the way back to 98.97 low. Nonetheless, break of 110.10 will be the first sign of near term bottoming and turn bias back to the upside for 112.19 resistance instead.
In the bigger picture, price actions from 125.85 high are seen as a corrective pattern. Current development suggests that it's not completed yet and is extending. In case of deeper decline, downside should be contained by 61.8% retracement of 75.56 to 125.85 at 94.77 to bring rebound. Rise from 75.56 is still expected to resume later after the correction from 125.85 completes.
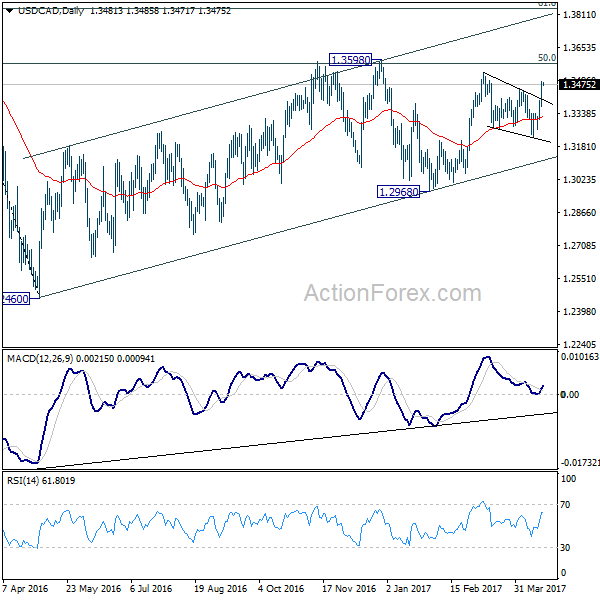
USD/CAD Daily Outlook
Daily Pivots: (S1) 1.3328; (P) 1.3364; (R1) 1.3416; More....
Intraday bias in USD/CAD remains on the upside for the moment. The break of 1.3455 resistance confirmed that consolidation from 1.3534 has completed with three waves down to 1.3222. And the rises from 1.1968, and that from 1.2460 are possibly resuming. Further rally would be seen to retest 1.3598 high first. Decisive break there will pave the way to next medium term fibonacci level at 1.3838. On the downside, below 1.3399 minor support will turn bias neutral and bring consolidation before staging another rally.
In the bigger picture, price actions from 1.4689 medium term top are seen as a correction pattern. The first leg has completed at 1.2460. The second leg from 1.2460 is likely still in progress and could target 61.8% retracement of 1.4689 to 1.2460 at 1.3838. We'd look for reversal signal there to start the third leg. However, break of 1.2968 will argue that the third leg has already started and should at least bring a retest of 1.2460 low. Meanwhile, sustained trading above 1.3838 would pave the way to retest 1.4689 high.
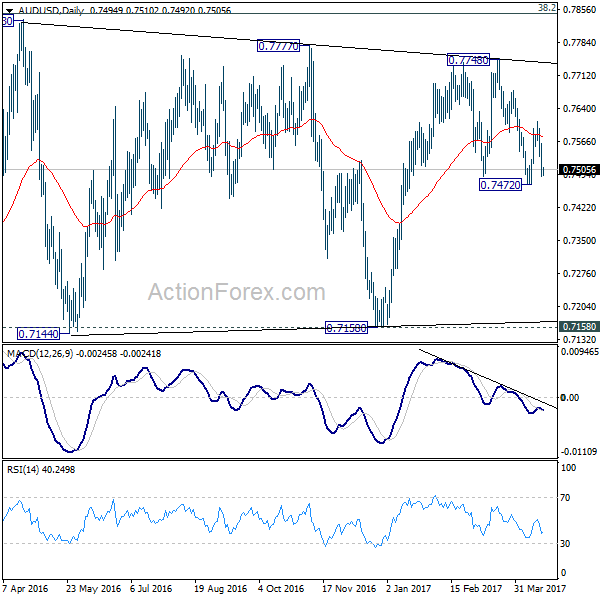
AUD/USD Daily Outlook
Daily Pivots: (S1) 0.7471; (P) 0.7516; (R1) 0.7542; More...
AUD/USD recovers mildly today but intraday bias remains on the downside for 0.7472 support. Firm break there will revive the case that whole rise from 0.7158 is completed at 0.7740. In that case, AUD/USD will target a test on 0.7158 key support level next. On the upside, above 0.7562 minor resistance will turn bias back to the upside for 0.7609 resistance. Break will target a test on 0.7748 high.
In the bigger picture, we're still treating price actions from 0.6826 low as a correction. And, as long as 38.2% retracement of 0.9504 to 0.6826 at 0.7849 holds, long term down trend from 1.1079 is expected to resume sooner or later. Break of 0.6826 low will target 0.6008 key support level. However, firm break of 0.7849 will indicate that rise from 0.6826 is developing into a medium term rebound, rather than a sideway pattern. In such case, stronger rise should be seen to 55 month EMA (now at 0.8144) and above.
Commodity Currencies Recover as Sentiments Stabilized, Dollar Mixed after Beige Book
Markets continue to trade generally calmly for the moment. US equities turned mixed overnight with DJIA losing another -118.79 pts or -0.58% to close at 20404.49. S&P 500 dropped -4.02 pts or -0.17% to close at 2338.17. NASDAQ, however, gained 13.56 pts or 0.23% to close at 5863.03. Asian stocks are steady in tight range as Nikkei and HK HSI recover with slight gain. US treasury yield also stabilized with 10 year yield closing up 0.023 at 2.202. Gold continues to feel heavy ahead of 1300 handle and dips through 1280 handle briefly. The selloff in WTI Crude oil is more apparent as it reaches as low as 50.09, comparing to last week's high at 53.76. In the currency markets, commodity currencies are trading generally higher. New Zealand dollar is given additional boost from inflation data. Japanese Yen, on the other hand, trades broadly lower with Dollar for today.
Boston Fed Rosengren: Balance sheet normalization won't alter rate path
In US, Boston Fed President Eric Rosengren said that the process of the USD 4.5T balance sheet reduction "could begin relatively soon". And, that "should not significantly alter the FOMC's continuing gradual normalization of short-term interest rates." He noted that "by initially retiring only a small percentage of maturing securities, and then very gradually shrinking the volume of the securities being reinvested, the tightening of short-term interest rates should not need to be much different than it would be in the absence of shrinking the balance sheet." Meanwhile, " if done appropriately, the exit from the current large balance sheet can serve as an important 'playbook' for future recovery periods should it prove necessary."
Fed's Beige Book: Modest to moderate expansion in all districts
Fed's Beige Book economic report noted that activity increased across all twelve districts. And, the pace of expansions was "equally split between modest and moderate". Meanwhile, "the pickup was evident to varying degrees across economic sectors." Job markets tightened with "difficulty filling low-skilled positions" found in most districts. There were also increased demand for higher skilled labors. Inflation was modest only on balance.
European Commission: Two agencies will leave London after Brexit
European Commission spokesman Margaritis Schinas said that the European Medicines Agency and the European Banking Authority will leave London after Brexit. The two agencies employ more than 1000 staff in total. Schinas said that "the United Kingdom is leaving the European Union and it will have no say in the location of EU agencies." And relocating as "a matter for the negotiations will be the duty for the United Kingdom to facilitate the transfer of these agencies, helping to ease the practical and financial burden for the experts working there who will have to relocate to another city in the EU." Schinas also said yesterday that "the real political negotiations on article 50 with the United Kingdom will start after the elections foreseen for the 8th of June."
US House of Representatives Speaker Paul Ryan said that the US stood "ready to forge a new trade agreement with Great Britain as soon as possible so that we may further tap into the great potential between our two people." He urged that UK and and EU to "come together and strike a lasting agreement". And, "a strong UK-EU relationship is in all of our best interests".
Macron and Le Pen still leading in French president race
In France, all focuses are on the first round of presidential election on the coming Sunday. A closely watched Cevipof opinion poll published yesterday showed that centrist Emmanuel Macron and far-right Marine Le Pen are still leading the race. But both are losing momentum. On the other hand, conservative Francois Fillon and far-left Jean-Luc Melenchon are gaining momentum and are still in contention. First round support for Macron, Le Pen, Fillon and Melenchon are at 23.0%, 22.5%, 19.5% and 19.0% respectively. Another poll by BVA showed Macron at 24%, Le Pen at 23%, Fillon and Melenchon at 19% both. That will take Macron and Le Pen to the head-to head run-off in May and Macron is widely tipped to win.
On the data front...
New Zealand CPI rose 1.0% qoq in Q1, above expectation of 0.8% qoq. Australia NAB business confidence rose 1 pt to 6 in Q1. Japan trade surplus narrowed to JPY 0.17T in March. German PPI will be featured in European session. US will release jobless claims, Philly Fed survey and leading indicators later in the day.
AUD/USD Daily Outlook
Daily Pivots: (S1) 0.7471; (P) 0.7516; (R1) 0.7542; More...
AUD/USD recovers mildly today but intraday bias remains on the downside for 0.7472 support. Firm break there will revive the case that whole rise from 0.7158 is completed at 0.7740. In that case, AUD/USD will target a test on 0.7158 key support level next. On the upside, above 0.7562 minor resistance will turn bias back to the upside for 0.7609 resistance. Break will target a test on 0.7748 high.
In the bigger picture, we're still treating price actions from 0.6826 low as a correction. And, as long as 38.2% retracement of 0.9504 to 0.6826 at 0.7849 holds, long term down trend from 1.1079 is expected to resume sooner or later. Break of 0.6826 low will target 0.6008 key support level. However, firm break of 0.7849 will indicate that rise from 0.6826 is developing into a medium term rebound, rather than a sideway pattern. In such case, stronger rise should be seen to 55 month EMA (now at 0.8144) and above.
Economic Indicators Update
| GMT | Ccy | Events | Actual | Forecast | Previous | Revised |
|---|---|---|---|---|---|---|
| 22:45 | NZD | CPI Q/Q Q1 | 1.00% | 0.80% | 0.40% | |
| 23:50 | JPY | Trade Balance (JPY) Mar | 0.17T | 0.61T | 0.68T | 0.61T |
| 1:30 | AUD | NAB Business Confidence Q1 | 6 | 5 | ||
| 6:00 | EUR | German PPI M/M Mar | 0.20% | 0.20% | ||
| 6:00 | EUR | German PPI Y/Y Mar | 3.10% | |||
| 12:30 | USD | Initial Jobless Claims (APR 15) | 241K | 234K | ||
| 12:30 | USD | Philly Fed Manufacturing Index Apr | 25.6 | 32.8 | ||
| 14:00 | EUR | Eurozone Consumer Confidence Apr A | -5 | -5 | ||
| 14:00 | USD | Leading Indicators Mar | 0.20% | 0.60% | ||
| 14:30 | USD | Natural Gas Storage | 10B |
Market Morning Briefing: All The Majors Are In A Consolidation Mode
STOCKS
Dow (20404.49, -0.58%) has closed below our expected 20410 levels on the downside. The immediate price momentum indicates further scope of a fall towards 20250-20200 levels in the next 1-2 sessions.
Dax (12016.45, +0.13%) is trading just above immediate support levels of 11960-11930 region and while that holds, a bounce back towards 12200 is possible in the near term.
Shanghai (3167.59, -0.12%) now faces important resistance near 3175/3180 levels and while the price stays below 3175, there is a fair possibility of testing 3100 on the downside.
Nikkei (18489.05, +0.31%) could remain in the 18600-18200 region this week. But the fall may not be over yet. We will have to be ready to look for another downleg below 18200 in the medium term.
Nifty (9103.50, -0.02%) made an intra-day low of 9075 yesterday, trying to attempt below 9100. We may look for a fall towards 9000-8900 in the medium term before a bounce back.
COMMODITIES
Gold (1281) has moved lower in line with our expectation. More correction towards 1260-65 can be expected due to near-term overbought condition. We have been expecting 1260 for gold to hold for some time as buyers are taking every dip as a further opportunity for buying. 1301 could be a level where the price action has to be checked to assess the chances of further bounce to 1328 to 1350 levels.
Silver (18.15) also closed below its support at 18.30. We might see 17.70 within few days of time and we will remain bearish while it is trading below 18.30 levels. We think that the corrective phase could be restricted till 17.70-80 levels due to near term oversold condition
Copper (2.51) has been stuck in the range of 2.50-2.66. A close below 2.50 could open up 2.48 and 2.45 levels respectively. Gradual buying at 2.45 levels can’t be ruled out due to near term oversold condition.
We have clearly mentioned yesterday that “increase in EIA data could keep lid on the bullish momentum and could open up 52.50 levels for Brent and 50 levels for WTI as well”. Yesterday,Crude oil prices fell, hitting their lowest in 11 days as EIA report said shale oil output in May was expected to post the biggest monthly increase in more than two years. The respective daily lows for Brent was 52.59 and WTI was 50.09. We have witnessed similar kind of fall on 9th march,2017, and we had successfully warned our clients about that fall too.
Now,increase in U.S. oil inventories is again raising a concern whether the United States will remain the world's biggest oil importer, which is a price supporting indicator, or if its soaring production and bloated stocks lead to lower imports and trigger shipments to the rest of the world, which would weigh on oil markets.
FOREX
All the majors are in a consolidation mode as the markets wait for the French poll to start on 23rd April though the final voting will be on 7th May.
Dollar Index (99.62) has marked a low at 99.45, just a bit higher than our target/support of 99.20-10 but the target may still be achieved if 100.00 holds as resistance in the near term.
Euro (1.0713) is taking a pause after the sharp rise from 1.06 to 1.0735 in just 2 sessions but the uptrend may resume any day, pushing it higher to 1.0780-1.0830.
Dollar Yen (108.96) continues its horizontal movement in the range of 108.00-109.40 and a major trending move can be expected only on a break from this range. Currently no directional bias but the trend still remains down with major support coming at 107.85.
Pound (1.2783) may spend the next few sessions in the range of 1.2600-1.2900, consolidating the recent gains made in the sharp rise from 1.2364 to 1.2900. While 1.3300 may be seen in the medium term, 1.2900 may hold as resistance in the near term.
Aussie (0.7507) has failed to bounce from the immediate support of 0.7525, weakening the technical structure. Now it may spend the coming sessions in the narrow range of 0.7450-0.7600 before any directional move.
Dollar-Rupee (64.58) is trading at 64.70 in the NDF at the moment. If it manages to sustain above 64.70-80 in the onshore market, then 65.20 may open up as the higher target but a failure near 64.70-80 may keep it in the narrow range of 64.40-70.
INTEREST RATES
The US yields are trading lower on Dollar weakness yesterday. There is immediate support below current levels and we could see a bounce back in the yields next week.
The German short end yields have risen and could move up for another 2-3 sessions before facing rejection from near term resistances. For now, the immediate trend is up.
The German-US 2Yr (-1.98%) and the 10Yr (-2.01%) are testing crucial resistances near current levels. We will have to watch if the resistance manages to produce rejection in the next couple of sessions; else we may expect a further rise in the yield spreads indicting a stronger Dollar against major currencies.
The UK 10Yr (1.05%) and the 20yr (1.59%) have moved up a bit from immediate support levels and could rise some more for a few sessions before resolving on the downside. As mentioned yesterday, long term looks bearish.
The 10 Yr GOI (6.8525%) has enough scope of rising towards 75 in the medium term. But a decent resistance is visible near 6.90% which if holds could delay a rise towards 7%.