Sample Category Title
Article 50 Ready To Be Delivered
News and Events:
Brexit: Article 50 to be triggered today
Nine months after the Brexit vote, Theresa May will finally start the exit process by triggering Article 50 of the Lisbon Treaty. May will speak in front of the House of Commons at noon. A letter will then be delivered by 1.30pm to Donald Tusk. Negotiations should last at least two years but the UK will still benefit many bilateral agreements in the meanwhile.
The pound fell last night from 1.2460 to 1.2380 against the dollar. In our view, we believe that the markets are still overly pessimistic about the UK situation. Recent economic data is improving, but we also believe that the pound should appreciate in the medium-term. It is clear that economists widely missed the target with their doomsday prophecies and ironically, it is this very market pessimism that is supporting the UK economy by increasing the competitiveness of its exports.
Now that Brexit is officially a done deal, the next questions will revolve around the nature and tone of negotiations. 27 counterparts must accept and agree with the UK’s terms with each country holding a veto over these conditions. It is for this reason that it is so difficult for countries to renegotiate treaties in general. For this reason, we find the promise to renegotiate treaties somewhat scammy.
Pressure on oil builds
Despite the negative sentiment around oil, there are increasing indications of risk to the upside. Ian Roper Taylor CEO of Vito, the world’s largest private oil trader, has provided verbal support to OPEC production cuts. As the headlines hit, crude popped to $49, slightly above the short-term sideways channel top. In addition, Libya experienced supply disruption, which pulled approx. 140k bbl/day offline. All this comes on the back of reports that OPEC and non-OPEC nations are looking to extend oil production cuts by six months. December's 1.8m bbl / day cut has failed to meaningfully address the demand /supply equilibria (deal product cut is estimated at 94%) and other nations (notably USA) have seized the opportunity. Crude-front month climbed to $50 bbl but quickly retreated as US shales oil producers came online (forecasts for US crude production expected to reach a decade high). The failure of current product cuts has provided a wake-up call to OPEC. A draft statement indicated that nations are working closer to reach a solution to further lift prices. Markets have been focused on shale's low production cost and new product from Brazil and Canada, yet OPEC remains the dominant force.
The Risk Today:
EUR/USD has failed to hold above former resistance given at 1.0874 (08/12/2017 high). Hourly support is given at 1.0719 (21/03/2017 low). Stronger support can be found at 1.0493 (22/02/2017 low). Expected to show renewed bullish pressures. In the longer term, the death cross late October indicated a further bearish bias. The pair has broken key support given at 1.0458 (16/03/2015 low). Key resistance holds at 1.1714 (24/08/2015 high). Expected to head towards parity.
GBP/USD has exited short-term uptrend channel. We consider that there are still rooms for further strength. Hourly resistance is located at 1.2615 (27/03/2017 high). Hourly support is given at 1.2324 (03/17/2017 low). Expected to show continued strength towards resistance at 1.2771 (05/10/2016 high). The long-term technical pattern is even more negative since the Brexit vote has paved the way for further decline. Long-term support given at 1.0520 (01/03/85) represents a decent target. Long-term resistance is given at 1.5018 (24/06/2015) and would indicate a long-term reversal in the negative trend. Yet, it is very unlikely at the moment.
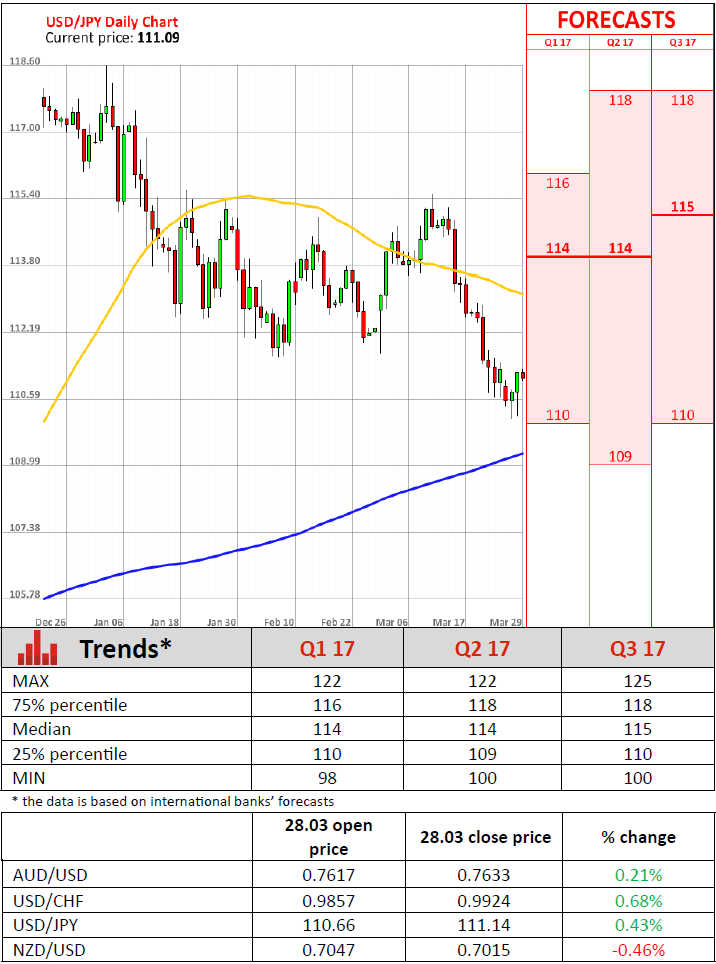
USD/JPY's bearish pressures are fadingHourly resistance can be located at 113.57 (16/03/2017 high) while support is given at 110.11 (27/03/2017 low). We favor a long-term bearish bias. Support is now given at 96.57 (10/08/2013 low). A gradual rise towards the major resistance at 135.15 (01/02/2002 high) seems absolutely unlikely. Expected to decline further support at 93.79 (13/06/2013 low).
USD/CHF is surging. Hourly support is given at 0.9814 (27/03/2017 low). Key resistance can be found at a distance at 1.0344 (15/12/2016 high). Expected to show continued weakness. In the long-term, the pair is still trading in range since 2011 despite some turmoil when the SNB unpegged the CHF. Key support can be found 0.8986 (30/01/2015 low). The technical structure favours nonetheless a long term bullish bias since the unpeg in January 2015.
| EURUSD | GBPUSD | USDCHF | USDJPY |
| 1.1300 | 1.3445 | 1.0652 | 121.69 |
| 1.0954 | 1.3121 | 1.0344 | 118.66 |
| 1.0906 | 1.2771 | 1.0171 | 115.62 |
| 1.0859 | 1.2589 | 0.9857 | 110.67 |
| 1.0494 | 1.1986 | 0.9550 | 106.57 |
| 1.0341 | 1.1841 | 0.9444 | 106.04 |
| 1.0000 | 1.0520 | 0.9259 | 101.20 |
Trade Idea Update: USD/JPY – Hold short entered at 111.20
USD/JPY - 111.05
Original strategy :
Sold at 111.20, Target: 110.20, Stop: 111.35
Position : - Short at 111.20
Target : - 110.20
Stop : - 111.35
New strategy :
Hold short entered at 111.20, Target: 110.20, Stop: 111.35
Position : - Short at 111.20
Target : - 110.20
Stop : - 111.35
Although dollar staged a strong rebound after holding above support at 110.11, as this move is still viewed as retracement of recent decline, reckon upside would be limited to 111.30-35 and bring retreat later, below the Kijun-Sen (now at 110.75) would bring weakness to 110.50 but only break of said support at 110.11 would confirm recent decline has resumed and extend weakness to 109.95-00 but loss of downward momentum should prevent sharp fall below 109.70-75 and reckon 109.50 would hold.
In view of this, we are holding on to our short position entered at 111.20, Only above 111.48-51 (previous resistance and 50% Fibonacci retracement of 112.90-110.11) would abort and signal low is formed, bring a stronger rebound to 111.80-85 first (61.8% Fibonacci retracement).

Gold Small Consolidation, Silver Consolidating Above $18, Crude Oil Renewed Bullish Pressures.
Gold Small consolidation.
Gold is getting stronger. The momentum seems back to bullish despite some consolidation. Strong resistance is located at 1263 (27/02/2017 high). Hourly support can be found at 1224.10 (16/03/2017 low). Expected to show further strengthening.
In the long-term, the technical structure suggests that there is a growing upside momentum. A break of 1392 (17/03/2014) is necessary ton confirm it, A major support can be found at 1045 (05/02/2010 low).
Silver Consolidating above $18.
Silver has increased above 18.00. Resistance given at 17.56 has been broken. Hourly support is given at 16.82 (15/03/2017 low).
In the long-term, the death cross indicates that further downsides are very likely. Resistance is located at 25.11 (28/08/2013 high). Strong support can be found at 11.75 (20/04/2009).
Crude oil Renewed bullish pressures.
Crude oil's bearish pressures seems to fade. The commodity had been located in a bearish trend since the commodity had been unable to mount a serious challenge to resistance at 55.24 (03/01/2017 high). Hourly support is given at 47.09 (016/03/2017 low).
In the long-term, crude oil has recovered after its sharp decline last year. However, we consider that further weakness are very likely. Strong support lies at 24.82 (13/11/2002) while resistance can now be found at 55.24 (03/01/2017 high).
EUR/CHF Temporary Bounce, EUR/JPY Pausing Around 120, EUR/GBP Bullish Breakout.
EUR/CHF Temporary bounce.
EUR/CHF's is moving up and down. The medium-term pattern suggests us to see continued bearish pressures towards key support that can be found at 1.0623 (24/06/2016 low).
In the longer term, the technical structure is mixed. Resistance can be found at 1.1200 (04/02/2015 high). Yet,the ECB's QE programme is likely to cause persistent selling pressures on the euro, which should weigh on EUR/CHF. Supports can be found at 1.0184 (28/01/2015 low) and 1.0082 (27/01/2015 low).
EUR/JPY Pausing around 120.
EUR/JPY rejection at 122.88 has triggered a correction. The pair is also very volatile. Hourly support can be found at 119.33 (23/03/2017 low). Resistance stands at 122.88 (13/03/0217 high). Expected to show continued weakness.
In the longer term, the technical structure validates a medium-term succession of lower highs and lower lows. As a result, the resistance at 149.78 (08/12/2014 high) has likely marked the end of the rise that started in July 2012. Strong support at 94.12 (24/07/2012 low) looks nonetheless far away.
EUR/GBP Bullish breakout.
EUR/GBP's bullish flag turned out to be true. The pair is now heading towards resistance at 0.8787 (13/03/2017 high). Key resistance is given at 0.8854 (15/01/2017 high). Hourly support can be found at 0.8605 (23/03/2017 low. Expected to show continued weakness.
In the long-term, the pair has largely recovered from recent lows in 2015. The technical structure suggests a growing upside momentum. The pair is trading above from its 200 DMA. Strong resistance can be found at 0.9500 psychological level.
USD/CHF Bouncing Back, USD/CAD Short-Term Strengthening, AUD/USD Bouncing.
USD/CHF Bouncing back.
USD/CHF is surging. Hourly support is given at 0.9814 (27/03/2017 low). Key resistance can be found at a distance at 1.0344 (15/12/2016 high). Expected to show continued weakness.
In the long-term, the pair is still trading in range since 2011 despite some turmoil when the SNB unpegged the CHF. Key support can be found 0.8986 (30/01/2015 low). The technical structure favours nonetheless a long term bullish bias since the unpeg in January 2015.
USD/CAD Short-term strengthening.
USD/CAD is pushing higher. A break of resistance area around 1.3400 is needed to invalidate the current short term bearish technical structure. The road seems still wideopen for larger decline. Key support is given at 1.2969 (31/01/2017 low).
In the longer term, there is a golden cross with the 50 dma crossing the 200 dma indicating further upside pressures. Strong resistance is given at 1.4690 (22/01/2016 high). Long-term support can be found at 1.2461 (16/03/2015 low).
AUD/USD Bouncing.
AUD/USD keeps on correcting lower since the pair has failed to test the key resistance at 0.7778 (08/11/2016 high). Expected to see some shortterm weakness towards support area around 0.7500.
In the long-term, we are waiting for further signs that the current downtrend is ending. Key supports stand at 0.6009 (31/10/2008 low) . A break of the key resistance at 0.8295 (15/01/2015 high) is needed to invalidate our long-term bearish view.
EUR/USD Bouncing Lower, GBP/USD Bearish Consolidation, USD/JPY Bearish Pressures Are Fading.
EUR/USD Bouncing lower.
EUR/USD has failed to hold above former resistance given at 1.0874 (08/12/2017 high). Hourly support is given at 1.0719 (21/03/2017 low). Stronger support can be found at 1.0493 (22/02/2017 low). Expected to show renewed bullish pressures.
In the longer term, the death cross late October indicated a further bearish bias. The pair has broken key support given at 1.0458 (16/03/2015 low). Key resistance holds at 1.1714 (24/08/2015 high). Expected to head towards parity.
GBP/USD Bearish consolidation.
GBP/USD has exited short-term uptrend channel. We consider that there are still rooms for further strength. Hourly resistance is located at 1.2615 (27/03/2017 high). Hourly support is given at 1.2324 (03/17/2017 low). Expected to show continued strength towards resistance at 1.2771 (05/10/2016 high).
The long-term technical pattern is even more negative since the Brexit vote has paved the way for further decline. Long-term support given at 1.0520 (01/03/85) represents a decent target. Long-term resistance is given at 1.5018 (24/06/2015) and would indicate a long-term reversal in the negative trend. Yet, it is very unlikely at the moment.
USD/JPY Bearish pressures are fading.
USD/JPY's bearish pressures are fadingHourly resistance can be located at 113.57 (16/03/2017 high) while support is given at 110.11 (27/03/2017 low).
We favor a long-term bearish bias. Support is now given at 96.57 (10/08/2013 low). A gradual rise towards the major resistance at 135.15 (01/02/2002 high) seems absolutely unlikely. Expected to decline further support at 93.79 (13/06/2013 low).
US Consumers Show Strongest Confidence Since 2000 In March
'Consumers' assessment of current business and labor market conditions improved considerably.' - Lynn Franco, The Conference Board
The Conference Board Consumer Confidence Index increased significantly despite experts' pessimistic forecasts. In March, it gained 8% and reached 125.6, which is the highest value since December 2000. Therefore, the number of consumers who evaluated business conditions as 'good' rose from 28.3% to 32.2%. Moreover, the number of consumers who believed that there was 'enough' job offers in the market also climbed from 26.9% to 31.7%. Accordingly, the number people who evaluated business conditions as 'bad' decreased from 13.4% to 12.9%. In addition, the number of people who were experiencing 'difficulties' finding a job slightly diminished from 19.9% to 19.5%. Altogether, this mean that consumers believe that the current economic conditions have improved and that they are ready to increase their spending and investments. This also suggests that people are more optimistic about the near-term economic situation. For instance, the number of consumers who suggested that business conditions would improve even more in the next six months soared from 23.9% to 27.1%. At the same time, the number of consumers who suggested that more jobs would be created in the next six months also nudged from 20.9% to 24.8%.
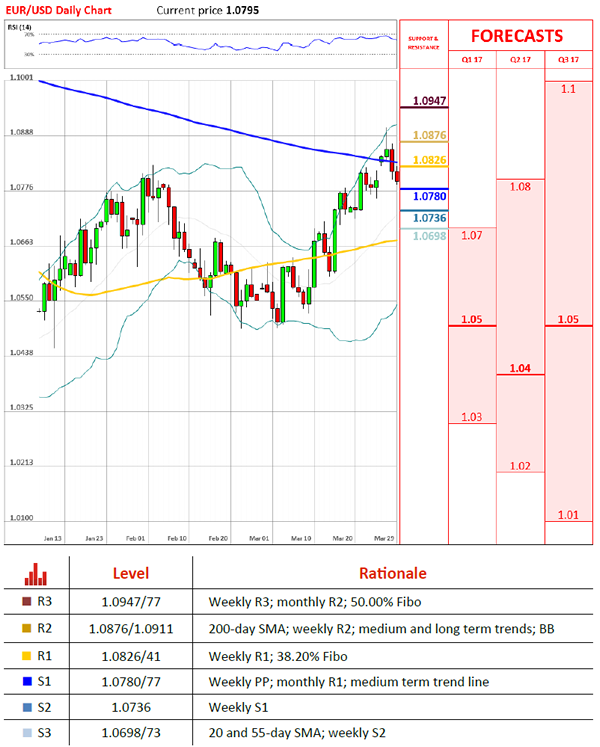
EUR/USD Trades Near 1.08
'It's sensible to wonder whether the dollar's recent slide is a sign that post-election euphoria is fading, but by one measure a decline was overdue before Election Day.' – Nir Kaissar, Bloomberg
Pair's Outlook
On Wednesday morning the common European currency traded flat against the US Dollar near the 1.0810 mark, and it was positioned to decline to the 1.0780 level. At the 1.0780 level was located the closest support to the currency exchange rate, as there the weekly PP was located at. Previously, during Tuesday's session, the pair failed to break the resistance put up by the 200-day SMA near the 1.0875 level. As a result the decline of the pair began, as it passed the weekly R1 and 38.20% Fibo, respectively, at 1.0841 and 1.0826. These levels of significance have begun to provide resistance on Wednesday.
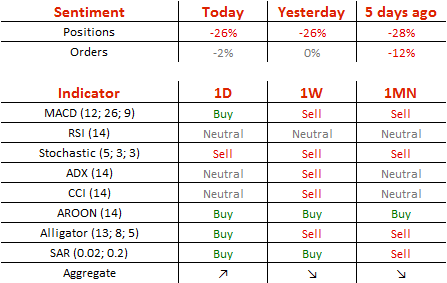
Traders' Sentiment
Traders have not changed their opinion, as 63% of open positions remain short. Meanwhile, 51% of set up orders are to sell the Euro.
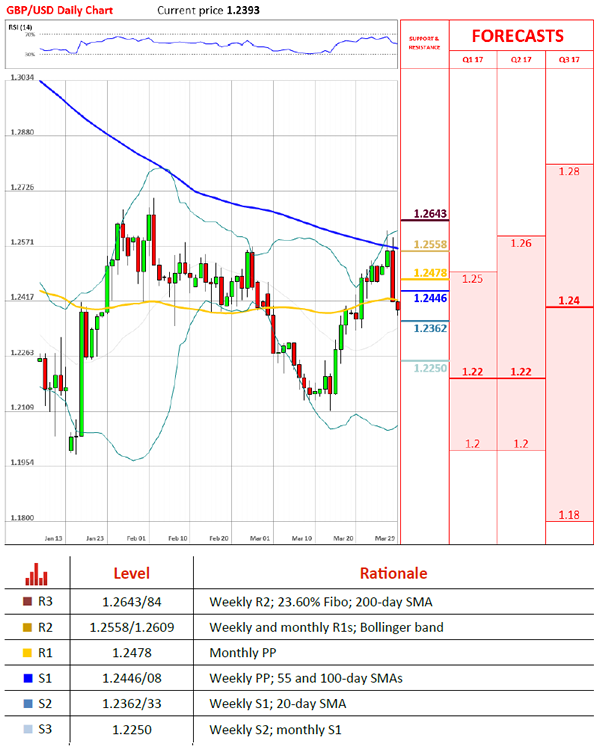
GBP/USD Keeps Approaching 1.23 Handle
'According to our long-term fair value model G10 VALFex, the USD already looks quite overvalued vs SEK, EUR, JPY and GBP and that should limit any future gains.' – Credit Agricole (based on PoundSterlingLive)
Pair's Outlook
In the wake of formal beginning of Brexit the GBP/USD pair began sliding down, this was seen by yesterday's bearish development when the Pound lost more than 100 pips. Despite being supported by the weekly PP, the 55 and the 100-day SMAs, the Cable is likely to edge lower again. The 1.23 major level is expected to be the bottom floor for today's trading, even though technical indicators are giving bullish signals in the daily timeframe. Ultimately, the given pair has been consolidating between 1.1950 and 1.27 since October 2016, and this trading range still remains intact, with the Sterling headed towards the lower half, namely below the 1.23 mark.
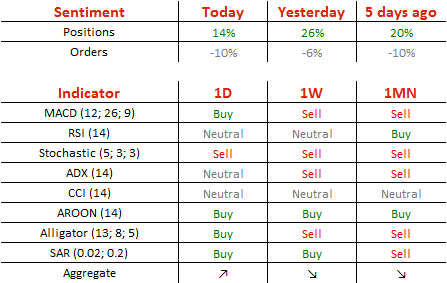
Traders' Sentiment
Although not as strong as yesterday, but market sentiment remains bullish, now at 57%. The share of sell orders increased from 53 to 55%.
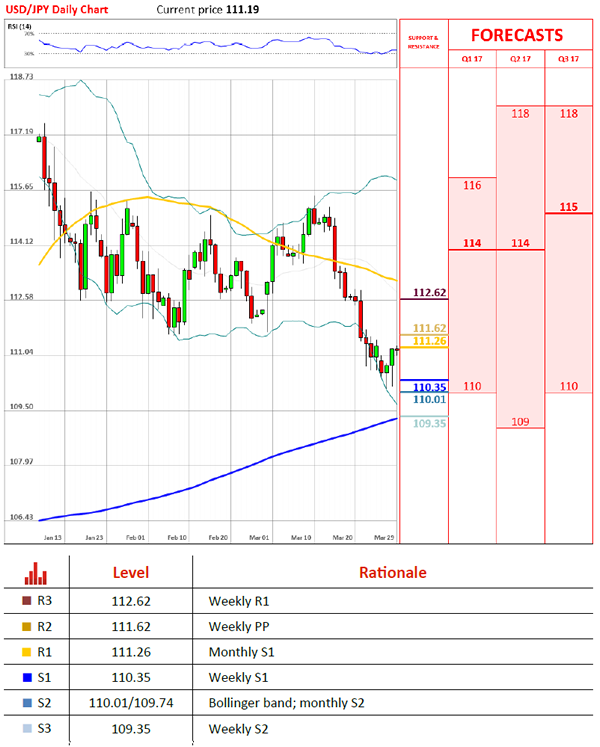
USD/JPY Anchored Around 111.00
'I think the optimism about 'Trumponomics,' against the failure to pass the Obamacare reform bill, is still dominating the dollar/yen market.' – Mizuho Securities (based on Reuters)
Pair's Outlook
After a two-week decline the USD/JPY currency pair managed to breach the descending channel's support line yesterday, also reacquiring the 111.00 mark. Nevertheless, the rally was stopped by the monthly S1, which could still cause bears to push the exchange rate lower today. Moreover, technical indicators remain in favour of the negative outcome and the Bollinger bands suggest a close in the red zone today is likely. The nearest support is the weekly S1 at 110.35, but a drop that low is doubtful, with the 110.60 level seen as the lowest intraday closing point.
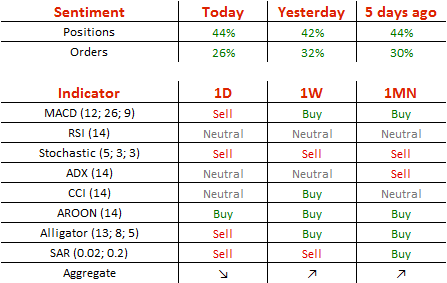
Traders' Sentiment
Bullish traders' sentiment returned to its Monday's level of 72% (previously 71%). At the same time, the number of orders to acquire the Buck edged down from 66 to 63%.