Sample Category Title
AUD/USD Elliott Wave Analysis
AUD/USD – 0.7652
AUD/USD – Wave 5 of C and (B) has possibly ended at 1.1081
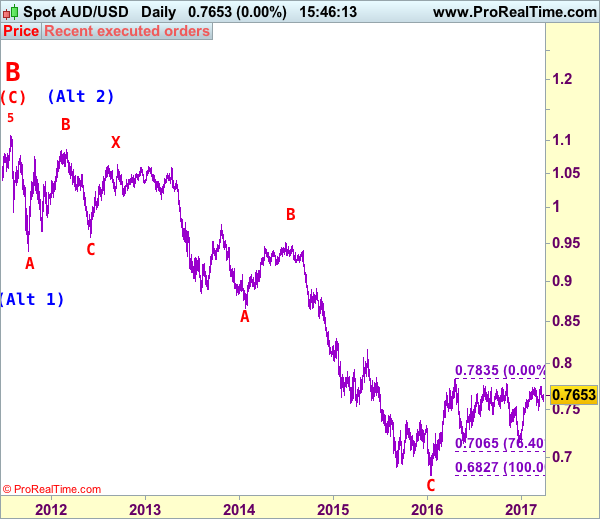
Although aussie retreated after marginal rise to 0.7750 and consolidation below this level would take place with initial downside bias, reckon 0.7580-85 would limit downside and bring rebound later, above said resistance at 0.7750 would extend recent rise from 0.7158 to previous chart resistance at 0.7778 but break there is needed to retain bullishness and signal another leg of major corrective upmove from 0.6827 low is underway for headway to 0.7835 resistance first, then 0.7900, however, psychological resistance at 0.8000 should hold from here.
We are keeping our count that top has been formed at 1.1081 (wave 5 of V) and major correction (A-B-C-X-A-B-C) has commenced, indicated downside targets at 0.7945 (61.8% Fibonacci retracement of entire rise from 0.6007-1.1081) and 0.7750 had been met and downside bias is seen for further weakness to 0.6800, then 0.6700 but reckon 0.6500 would hold from here.
Our preferred count is that the rally from 0.6007 to 0.7270 (7 Jan 2009) is marked as wave A, the retreat to 0.6248 (2 Feb 2009) is wave B and the subsequent upmove is labeled as wave C with wave (iii) and wave (iv) ended at 0.8265 and 0.7700 respectively and wave (v) as well as 3 ended at 0.9407, then wave 4 ended at 0.8066 (instead of 0.8578). The wave 5 has met our indicated projection target of 1.1060 and could ended at 1.1081, this level is now treated as the peak of wave (C) as well as larger degree wave B, hence major fall in wave C has commenced, our initial downside target at psychological support at 0.7000 has just been met and further weakness to 0.6500 would be seen later.
On the downside, expect pullback to be limited to 0.7580-85 and 0.7555 should hold, bring another rise later. A daily close below 0.7555 would defer and risk weakness towards support at 0.7491 but only a drop below latter level would abort and signal the aforesaid rise from 0.7158 has ended, bring further fall to 0.7450, then towards 0.7400.
Recommendation: Hold long entered at 0.7600 for 0.7800 with stop below 0.7550
Our alternate count on the daily chart treated the top formed in 2008 at 0.9851 could be a larger degree wave I and was followed by a deep and sharp correction in wave II to 0.6007 and wave III is unfolding from there.
The long-term uptrend started from 0.4775 (2 Apr 2001) with an impulsive structure. Wave I is labeled as 0.4775 to 0.9851 (15 Jul 2008), wave II has ended at 0.6007 (Oct 2008) and wave III is still in progress which may extend further gain to 1.1265.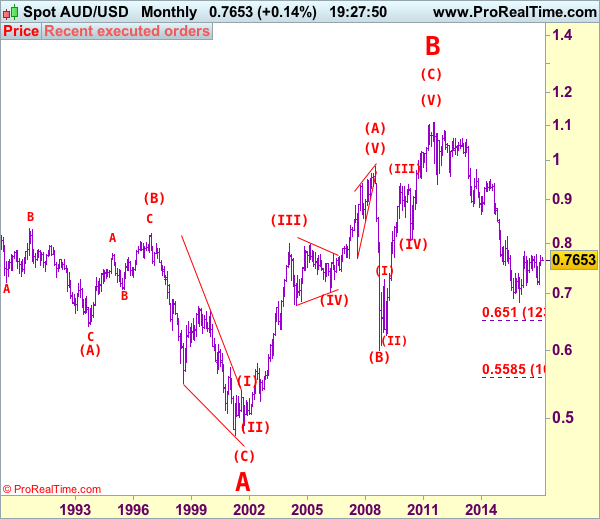
Sterling Gets Battered as PM May Signs Brexit Letter
The British pound took a serious hit yesterday, after a cocktail of economic and political news. The first piece of news came from the BoE. Ian McCafferty, one of the most hawkish members of the MPC, said that the UK economy is not ready for hikes right now. These cautious comments may have come as a surprise to investors, and may have pushed back expectations regarding the timing of a potential BoE tightening.
Then, it was all political news. The Scottish Parliament voted in favor of a second independence referendum. Nonetheless, the UK government quickly announced that it will not allow something like that for a while, at least not until a deal between the UK and the EU is reached.
Later in the day, it was Theresa May's turn. The PM signed the Article 50 letter, starting the official process for leaving the EU. This marks the beginning of two years of negotiations between the two sides. Today, PM May will speak before Parliament, and EU Council President Donald Tusk will hold a press conference in response to May's letter. As such, we expect the pound to remain exposed to comments from these two officials.
GBP/USD tumbled, falling below the inside swing low of 1.2555 (R3) to hit support at the prior resistance line taken from back at the peak of the 2nd of February. We expect investors to await near that area, or at least stay above the support of 1.2340 (S1), until we get any key remarks from May or Tusk.
Looking ahead, we expect sterling's forthcoming direction to be determined to a large extent by headlines around the negotiations, especially on the subject of trade. Signs that the UK is likely to end up with no free trade agreement could lead to further downside in the pound. Nonetheless, given that much of the "hard Brexit" rhetoric may already be priced into the battered pound, we believe that the political risks surrounding GBP are likely asymmetrical. Any positive developments during the negotiation process could generate a bigger upside reaction than the corresponding downside in case of the anticipated "hard Brexit" outcome.
EUR/GBP shot up yesterday, breaking above the upper bound of a falling wedge formation that contained the price action since the 9th of March. This has turned the short-term outlook to the upside and as such we expect the rate to challenge once again the 0.8735 (R1) resistance soon. A break above that line is possible to aim for our next obstacle of 0.8760 (R2), marked by the peak of the 16th of March.
US dollar makes a comeback
The other currency to experience a big movement yesterday was the greenback, which recovered some lost ground. Although there was no clear fundamental catalyst behind the recovery, we see three factors that could be behind the move. Firstly, Fed Vice Chair Fischer confirmed that he expects another two rate hikes this year, which may have eased the concerns of some investors following the not-so-hawkish hints from Chair Yellen after the March FOMC meeting. Secondly, the Conference Board consumer confidence index unexpectedly surged to a level last seen in 2000, and finally, the fact that Q1 is almost over means that there may have been some end-of-quarter USD demand, as investors rebalance their portfolios.
With regards to the greenback, we think that its outlook remains neutral right for now. We will reevaluate our view when we get hints with regards to the timing of the next rate hike, and updates on the timing and size of Trump's tax reforms. We believe that short-term paths in USD pairs will depend primarily on the counterparts. For example, we expect USD to underperform EUR, which is likely to remain supported on speculation that the era of ultra-loose monetary policy in the Eurozone is approaching an end. On the other hand, we expect it to outperform CAD, given a very dovish BoC.
As for today's economic indicators
During the European day, the calendar is relatively light. From Sweden, we get the consumer and manufacturing confidence indices, both for March. Nonetheless, neither of these indicators is usually a major market mover.
From the US, we get pending home sales for February. The forecast is for the figure to have risen, a rebound from the previous month.
As for the speakers, we have four on the schedule: Chicago Fed President Charles Evans, Boston Fed President Eric Rosengren, San Francisco Fed President John Williams and ECB Executive Board member Peter Praet.
GBP/USD
Support: 1.2340 (S1), 1.2300 (S2), 1.2245 (S3)
Resistance: 1.2425 (R1), 1.2470 (R2), 1.2555 (R3)
EUR/GBP
Support: 0.8700 (S1), 0.8675 (S2), 0.8620 (S3)
Resistance: 0.8735 (R1), 0.8760 (R2), 0.8790 (R3)
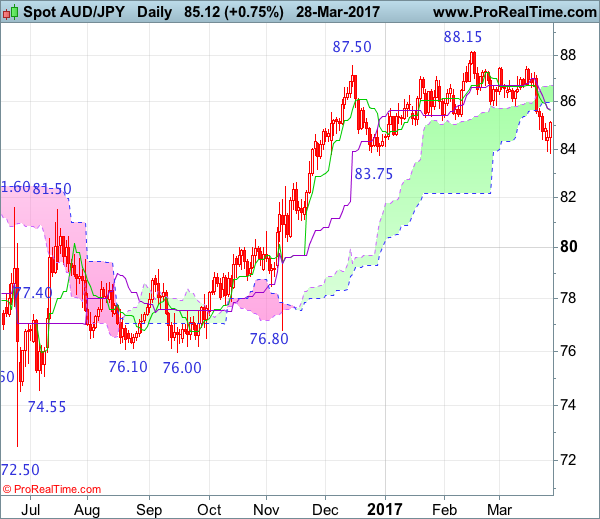
AUD/JPY Candlesticks and Ichimoku Analysis
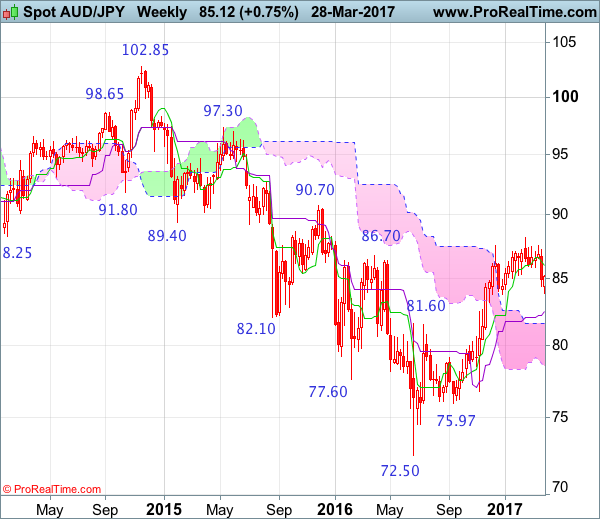
Weekly
• Last Candlesticks pattern: Shooting star
• Time of formation: 12 Dec 2016
• Trend bias: Down
Daily
• Last Candlesticks pattern: Shooting star
• Time of formation: 1 Nov 2016
• Trend bias: Up
As assize’s decline has accelerated after break indicated support at 85.85, suggesting top has been formed at 88.15 earlier and consolidation with downside bias is seen for the erratic decline from there to bring retracement of medium term upmove, hence further fall to 83.75 would be seen, however, a daily close below there is needed to retain bearishness and extend fall from 88.15 to 83.00-10 but near term oversold condition should limit downside to 82.50-60 and 82.00 should remain intact, price should stay well above support at 81.10-15, bring rebound later.
On the upside, whilst initial recovery to 84.90-00 cannot be ruled out, reckon upside would be limited to the Kiun-Sen (now at 85.66) and bring another decline later. Only a daily close above previous support at 85.85 (now resistance) would abort and signal low is formed instead, bring a stronger rebound to 86.20 and possibly towards the upper Kumo (now at 86.68) but upside should be limited to 87.00 and price should falter well below resistance at 87.50, bring another decline later.
Recommendation: Sell at 85.70 for 83.70 with stop above 86.70.
On the weekly chart, last week’s selloff together with the breach of previous support at 85.85 suggest top has been formed at 88.15 earlier and consolidation with downside bias is seen for retracement of recent upmove, hence weakness to 83.75 and possibly 83.00-10 is likely, however, reckon the Kijun-Sen (now at 82.49) would limit downside and the upper Kumo (now at 81.61) should remain intact, bring rebound later due to near term oversold condition.
On the upside, expect recovery to be limited to 85.50-55 and the Tenkan-Sen (now at 86.00) should hold, bring another decline later. A weekly close above 86.00 would risk rebound to 86.50-60 but reckon upside would be limited to 87.00 and resistance at 87.50 should hold, bring another retreat. Only a break above 87.50 would revive bullishness and signal the pullback from 88.15 top has ended, bring retest of 88.15. Looking ahead, a break of 88.15 resistance would confirm the rise from 72.50 low has resumed for retracement of early downtrend to 88.50 and then 89.00-10 but reckon upside would be limited to psychological resistance at 90.00 and previous resistance at 90.70 should remain intact.
Sterling Hit By Brexit Reality
The Brexit jitters were revived on Tuesday evening with Sterling stumbling into steep losses after British Prime Minister Theresa May signed a letter notifying the EU of Britain’s plan to depart from the European Union. With the game changing Brexit letter due to be delivered to Brussels on Wednesday afternoon marking a critical turning point and triggering one of the most intricate set of negotiations Britain and the EU have ever been presented, Sterling could be instore for a rocky rollercoaster ride. There is already an air of unease over potential complications in the negotiations with the EU’s demand for a £50 billion Brexit bill acting as the first test which may create serious headwinds. Sentiment remains firmly bearish towards the Pound moving forward and the potential resurgence of hard Brexit fears could ensure price weakness becomes a recurrent theme. The fact that Sterling found itself on the back foot on Wednesday morning as Article 50 is about to be officially triggered continues to highlight how the Brexit risk has not been fully priced in with further downside shocks expected. While it is certain that today will go down in history as the day the UK decided to start an irreversible Brexit process that will terminate its 44-year-old membership with the EU, the outcome remains an uncertainty that may leave investors on edge.
From a technical standpoint, the GBPUSD has found itself gripped by the Brexit woes with sellers exploiting the anxiety to install repeated rounds of selling. The technical breakdown below 1.2400 could encourage a further decline lower towards the next relevant level at 1.2300.
Currency spotlight – USDJPY
Uncertainty from the Brexit woes coupled with the rising Trump jitters could spark a wave of risk aversion which may ultimately bolster the Japanese Yen in the short to medium term as investors seek safe-haven safety. From a technical standpoint, the USDJPY fulfills the prerequisites of a bearish trend as there have been consistently lower lows and lower highs on the daily timeframe. Previous support around 111.600 could transform into a dynamic resistance that encourages a further decline back towards 110.00 and potentially lower.
GBP/JPY Daily Outlook
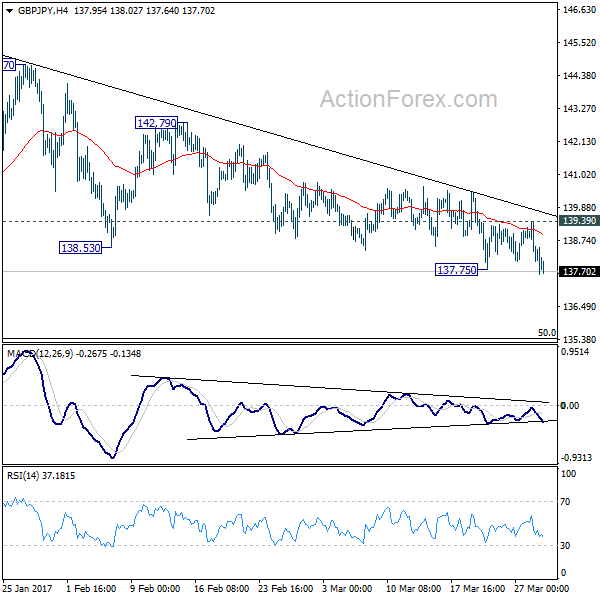
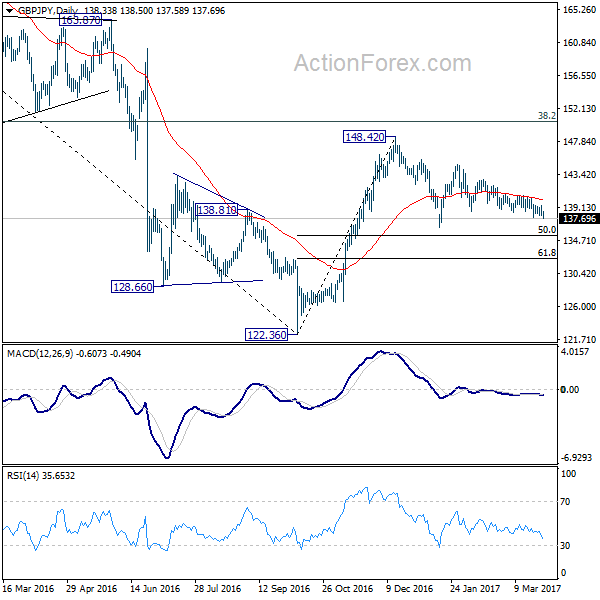
Daily Pivots: (S1) 137.81; (P) 138.60; (R1) 139.17; More...
GBP/JPY dips through 137.75 temporary low and intraday bias is turned back to the downside. Choppy decline from 144.77 would target 136.44 support and below. But we'd expect support from 50% retracement of 122.36 to 148.42 at 135.39 to contain downside and bring rebound. On the upside, break of 139.39 minor resistance will turn bias to the upside and send GBP/JPY through 142.79 resistance. Overall, price actions from 148.42 are forming a consolidation pattern.
In the bigger picture, price actions from 122.36 medium term bottom are still seen as a corrective pattern. Main focus is on 38.2% retracement of 195.86 to 122.36 at 150.42. Rejection from there will turn the cross into medium term sideway pattern. Or, sustained break of 50% retracement of 122.36 to 148.42 at 135.39 will turn outlook bearish for a test on 122.36 low. Though, sustained break of 150.42 will extend the rebound towards 61.8% retracement of 195.86 to 122.36 at 167.78.
AUD/USD Candlesticks and Ichimoku Analysis
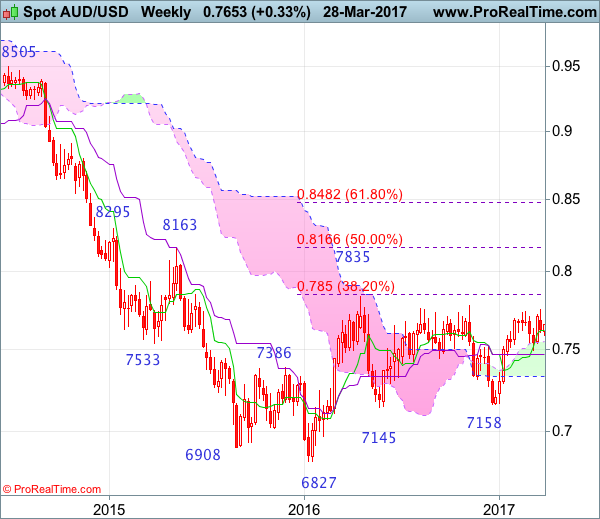
Weekly
• Last Candlesticks pattern: Morning star
• Time of formation: 2 Jan 2017
• Trend bias: Sideways
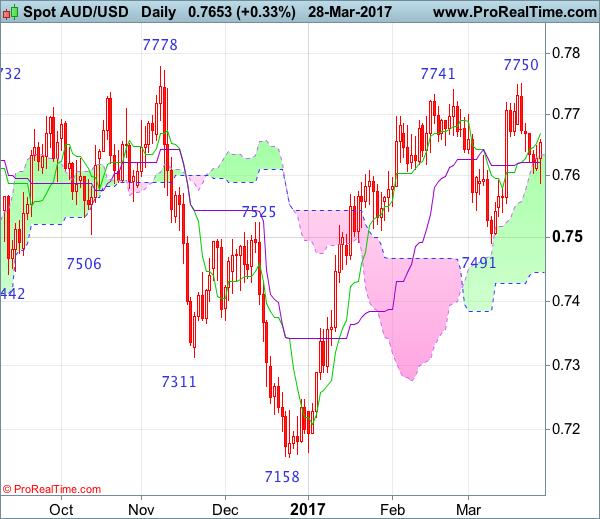
Daily
• Last Candlesticks pattern: Long white candlestick
• Time of formation: 15 Mar 2017
• Trend bias: Up
Although aussie has retreated after rising to 0.7750 last week and consolidation below this level would be seen initially, reckon downside would be limited to 0.7555 and bring another rise later, above said resistance at 0.7750 would bring test of previous chart resistance at 0.7778, however, break there is needed to retain bullishness and confirm early erratic upmove from 0.6827 (2016 low) has resumed for retest of 0.7835 (2016 high) first but near term overbought condition should prevent sharp move beyond 0.7900-10 and price should falter well below psychological resistance at 0.8000.
On the downside, expect pullback to be limited to 0.7585-90 and 0.7555 should hold, bring another rise later to aforesaid upside targets. A daily close below 0.7555 would risk another test of indicated support at 0.7491 but only break there would abort and signal recent rise from 0.7158 has ended, risk weakness to the lower Kumo (now at 0.7445) and then towards 0.7400 which is likely to hold from here, bring another upmove later.
Recommendation: Hold long entered at 0.7600 for 0.7800 with stop below 0.7500.
On the weekly chart, although aussie rose marginally to 0.7750 last week, as price has retreated after faltering below indicated previous resistance at 0.7778, suggesting initial consolidation below this level would be seen and pullback to the upper Kumo (now at 0.7545) cannot be ruled out before prospect of another rise later to 0.7750 and possibly test of 0.7778 resistance but as broad outlook remains consolidative, reckon upside would be limited and price should falter below 2016 high at 0.7835. Looking ahead, only above this level would suggest an upside break of recent established broad range has occurred, bring further subsequent rise to 0.7900 and later towards psychological level at 0.8000.
On the downside, whilst pullback to the upper Kumo (now at 0.7545) cannot be ruled out, price should stay well above support at 0.7491 and bring another rise later. A weekly close below said support at 0.7491 would suggest top is formed, bring test of the Kijun-Sen (now at 0.7468), a sustained breach below this level would signal the rise from 0.7158 has ended instead, risk further fall to 0.7400.
USDJPY Elliott wave View: Ending A Cycle
We are taking the more aggressive view in USDJPY and calling the rally to 115.48 on 3/10 as Intermediate wave (B). Decline from there is unfolding as a 5 waves impulse Elliott wave structure with an extension in wave 3. Down from 115.5, Minor wave 1 ended at 114.46 and Minor wave 2 ended at 115.2. Minor wave 3 is extended and further subdivided into 5 impulse waves where Minute wave ((i)) ended at 112.88, Minute wave ((ii)) ended at 113.56 and Minute wave ((iii)) ended at 110.59, Minute wave ((iv)) ended at 111.34, and Minute wave ((v)) of 3 is proposed complete at 110.077. Minor wave 4 bounce is currently in progress towards 111.27 – 112.02 area, which is 23.6 – 38.2 retracement of Minor wave 3, before further downside is seen to complete Minor wave 5 towards as low as 106.85 – 108.5 area. Bounce is expected to be limited and shallow.
If the current bounce gets too big, then as an alternate, the move lower in USDJPY from 115.5 high is unfolding as a zig zag Elliottwave structure where Minor wave A ended at 110.077 low with subdivision of 5 impulsive waves . In this alternative view, current bounce will then be bigger as it’s a Minor wave B bounce to correct decline from 3/10 high (115.52), but still as far as pivot at 115.2 stays intact, pair should resume lower again in Minor C. This alternate view is the less aggressive view but still calling for more downside in the pair as far as pair stays below 3/10 high. In both views (aggressive and less aggressive), we don’t like buying the pair.
1 Hour USDJPY Elliott Wave Chart
EUR/JPY Daily Outlook
Daily Pivots: (S1) 119.79; (P) 120.08; (R1) 120.48; More...
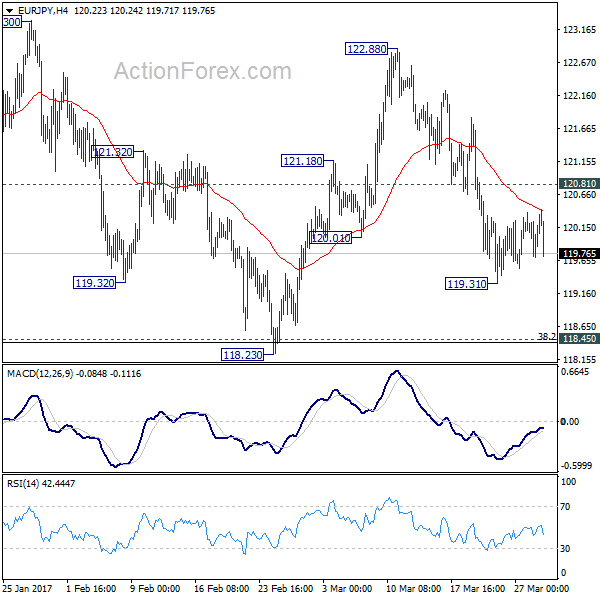
EUR/JPY is staying in range above 119.31 temporary low and intraday bias remains neutral first. Below 119.31 will extend fall from 122.88 to 118.23 low. But we'd expect strong support from 118.45 key cluster support level (38.2% retracement of 109.20 to 124.08 at 118.39) to contain downside and bring rebound. On the upside, above 120.81 minor resistance will turn bias back to the upside for 124.08 high. Overall, price actions from 124.08 are developing into a consolidative pattern and upside breakout is expected later.
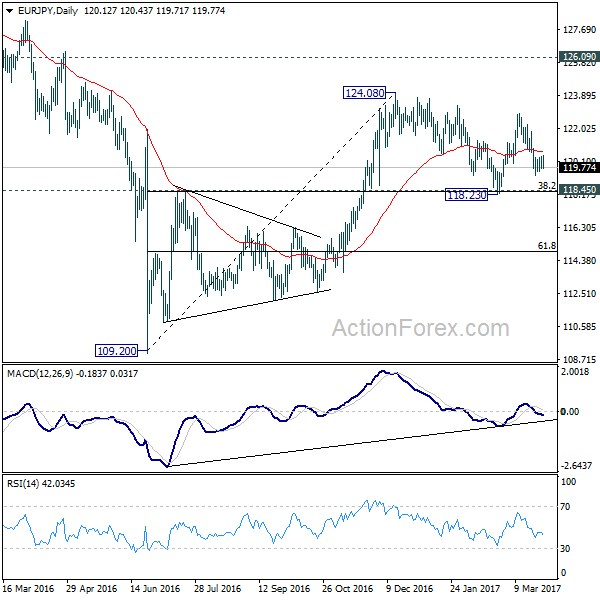
In the bigger picture, we're holding on to the view that medium term rise from 109.20 is still in progress. Focus is on 126.09 key resistance level. Sustained break will confirm completion of the whole decline from 149.76. And rise from 109.20 is of the same degree as the fall from 149.76. In such case, further rally would be seen to 104.04 resistance and possibly above before topping. Meanwhile, rejection from 126.09, or firm break of 118.45 cluster support, will likely extend the fall from 149.76 through 109.20 low.
Trade Idea : USD/CHF – Exit short entered at 0.9910
USD/CHF - 0.9933
Most recent candlesticks pattern : N/A
Trend : Near term down
Tenkan-Sen level : 0.9929
Kijun-Sen level : 0.9888
Ichimoku cloud top : 0.9886
Ichimoku cloud bottom : 0.9951
Original strategy :
Sold at 0.9910, Target: 0.9800, Stop: 0.9945
Position : - Short at 0.9910
Target : - 0.9800
Stop : - 0.9945
New strategy :
Exit short entered at 0.9910,
Position : - Short at 0.9910
Target : -
Stop : -
The greenback rallied after finding renewed buying interest at 0.9831 yesterday, dampening our bearishness and suggesting recent decline has ended at 0.9813, hence upside risk remains for this rise from 0.9813 to bring retracement of recent decline and further gain to resistance at 0.9960 would be seen but break there is needed to provide confirmation and retain bullishness for further rise towards another previous chart resistance at 1.0003 later.
In view of this, would be prudent to exit short entered at 0.9910 and stand aside in the meantime. below the Kijun-Sen (now at 0.9888) would suggest an intra-day top is formed instead, bring weakness to the lower Kumo (now at 0.9851) but break of said support at 0.9831 is needed to revive bearishness for retest of 0.9813 first.

EUR/AUD Daily Outlook
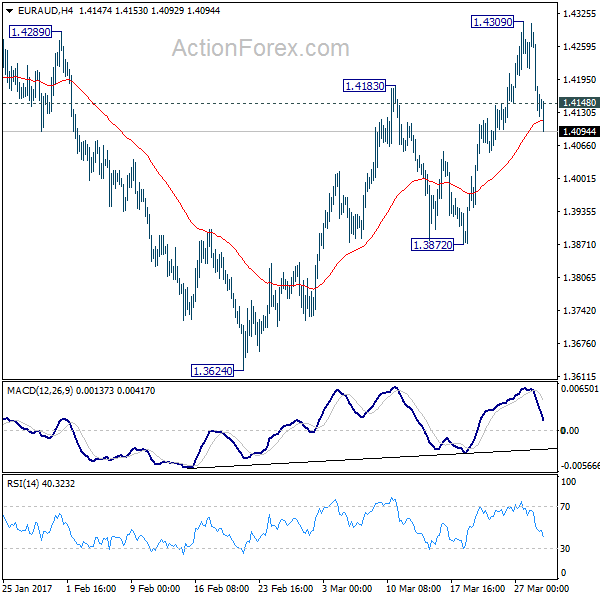
Daily Pivots: (S1) 1.4186; (P) 1.4248; (R1) 1.4323; More...
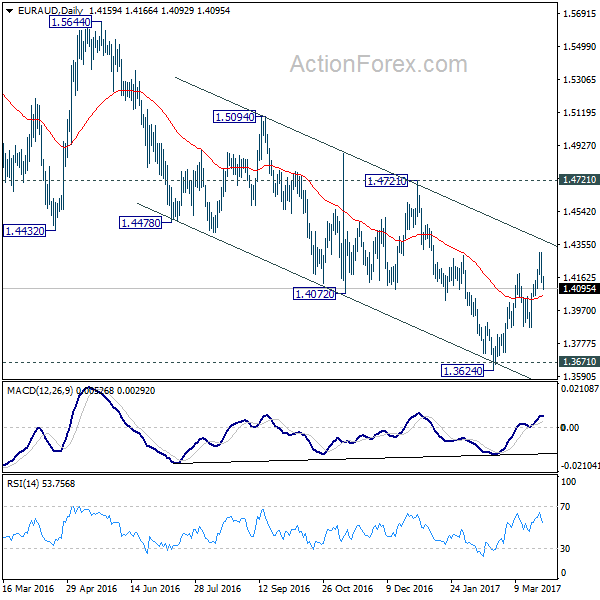
EUR/AUD lost momentum ahead after hitting 1.4309 dropped sharply. Intraday bias is turned neutral first. At this point, we're still mildly favoring the case of trend reversal. And, another rise is expected as long as 1.3872 support holds. Above 1.4309 should send the cross through channel resistance (now at 1.4378) to 1.4721 key resistance. However, break of 1.3872 will dampen our bullish view and bring retest of 1.3642 low instead.
In the bigger picture, price actions from 1.6587 medium term top are viewed as a corrective pattern. Such correction could be completed after testing 1.3671 support. Break of 1.4721 cluster resistance (38.2% retracement of 1.6587 to 1.3624 at 1.4756) should confirm this case and target 61.8% retracement at 1.5455 and above. Overall, we'd expect the up trend from 1.1602 to resume later. However, sustained break of 1.3671 will invalidate our bullish view and would turn focus back to 1.1602 long term bottom.