Sample Category Title
Markets Recover After Dow Suffered Longest Losing Streak Since 2011
Markets are calmer today after a steep selloff on Monday driven by concerns that Friday's decision to cancel voting on Obamacare bill might lead to difficulties to push through other U.S. pro-growth plans. Asian equities are back to green territory, oil prices recovered slightly, fixed income markets are steady, and similarly currency markets are moving in narrow trading ranges.
At this stage, U.S. markets will remain the key driver for global investors. The Dow Jones industrial average dropped for eight consecutive days heading into Monday; the longest losing streak since 2011, but nothing dramatic here given that the total declines are less than 2%. This selloff is obviously not a good sign, but it shows that investors are not yet in a stage of fear, but are somewhat on the defensive side.
Tax reforms, infrastructure spending, and deregulation. this is what's next on Trump's administration agenda. The success of execution on any of these legislations is probably lower now than it was just last week, but investors are still giving President Trump the benefit of the doubt. However, if they see that these plans will face the same destiny as the Health Care Act, markets will soon turn to aggressive selling as the expected companies' earnings growth and pace of economic recovery are not enough to support currently overstretched valuations.
The fixed income markets are not showing signs of enthusiasm either. U.S. Treasury bonds yield curve is flattening again with U.S. 10-year yields down more than 9% from March highs, and 30-year yields fell below 3%. This explains why the dollar lost much of its value, but more importantly, it indicates that fixed income investors do not see real signs of acceleration in inflation and economic growth.
Investors will turn their attention to Europe this week as U.K.'s Prime Minister Theresa May will officially trigger article 50 on Wednesday and start the two-year journey into the unknown. Meanwhile, Scottish Parliament is set to vote today on whether to hold another independence referendum. Interestingly, the pound was the best major performing currency yesterday rising 0.7% against the dollar. While the sterling strength was more of a USD weakness story, I believe any approach towards 1.27 will be a selling opportunity. The BoE seemed somehow hawkish when Kristin Forbes voted to raise rates on March 16, but I don't think this will be enough to overcome the challenges awaiting the U.K. when negotiations kick off with the E.U.
EURUSD May Face Some Limited Upside
On the updated count of EURUSD we see price trading in a possible zig-zag correction of a higher degree, with waves A and B already completed. Current bullish rally is wave C then, that can be in final stages if we consider that there is possible to count five subwaves up from 1.0495 swing low. So from an Elliott Wave perspective market may turn south with three waves minimum back to the area of a former wave four, at 1.0760. A sharp impulsive decline beneath that price would indicate that top is in place, so until that happens we need to keep in mind possible extensions up to 1.1000 area.
EURUSD, 4H
ECB Policymakers Provide More “Hawkish” Hints
The euro strengthened yesterday, following some relatively "hawkish" remarks from ECB Executive Board members Sabine Lautenschlager and Jens Weidman. Lautenschlager indicated that although the current ultra-loose ECB policy is necessary for now, the Bank should be prepared to change its stance as soon as the data are stable and there is a sustainable path towards the ECB's price stability objective. Weidman's comments were along the same lines. He said that he would like to see a less expansionary policy, but there is no sustainable price growth yet to justify something like that. Today, we will get to hear from another ECB Executive Board member, Benoit Coeure, and it will be interesting to see whether his comments echo those of his colleagues. If so, the euro could come under renewed buying interest.
Even though yesterday's comments are far from a clear signal that the ECB may actually change its policy anytime soon, they add to expectations that the era of ultra-loose monetary policy is approaching its final stages. They also place even more emphasis on the bloc's preliminary CPI data for March that come out on Friday, especially on the core rate. According to President Draghi this is the data point the Bank pays the most attention to. The rate is expected to have remained unchanged for the fourth consecutive month, but a potential uptick in coming months could fuel further speculation over a potential reduction in ECB stimulus as early as next year.
EUR/JPY traded higher on the aforementioned remarks, after it hit support once again near the 119.50 (S1) support territory. Nevertheless, the rebound was stopped by the 120.35 (R1) resistance. Even though the common currency outperformed most of its counterparts the last couple of weeks, it still underperformed the much stronger yen. This is evident by the price structure on the 4-hour chart where a near-term downtrend is in place since the 13th of March. Yes, we expect the euro to continue strengthening against other currencies, but we see the likelihood that it remains on the back foot against its Japanese peer, at least in the next few days. The bears may take advantage of the 120.35 (R1) resistance and perhaps pull the trigger for another test near 119.50 (S1).
Today's highlights
During the European day, the economic calendar is relatively light. The only noteworthy indicators we get are Sweden retail sales and PPI, both for February.
In the US, the Conference Board consumer confidence index for March is due out. The forecast is for the figure to have declined, but to still remain at an elevated level. We also get the S&P/Case-Shiller house price index for January, as well as the Richmond Fed manufacturing index for March. However, none of these indicators is usually a major market mover.
Since we get only second-tier indicators today, market participants are likely to lock their gaze on the six speakers we have on the agenda. Besides ECB's Coeure, we have speeches from Fed Chair Janet Yellen, Kansas City Fed President Esther George, Dallas Fed President Robert Kaplan, Bank of Canada Governor Stephen Poloz and Riksbank Governor Stefan Ingves. Although all of these speakers are important, we think that Yellen, Poloz, and Coeure are the three likely to steal the show.
With regards to Yellen, her comments will probably be scrutinized for any hints on when the Fed may raise rates next, and whether the summer FOMC meetings are appropriate candidates for such action. Having said that, we don't expect any major deviation from her comments two weeks ago at the March FOMC meeting, where she maintained a somewhat cautious tone, and did not offer any clear signs regarding the next rate move. If she continues to keep her cards close to her chest, then the reaction in USD may be limited.
As for BoC Governor Poloz, we have to note that in his last few appearances he maintained a more-dovish-than-expected tone, indicating that another rate cut remains on the table should downside risks materialize in the Canadian economy. USD/CAD edged north yesterday after it hit support at 1.3320 (S1) to emerge above the downside resistance line taken from the peak of the 9th of March. In our view, the break shifts the near-term outlook back to the upside and as such, we expect a test near 1.3410 (R1) soon. A break above that zone is possible to pave the way for our next resistance of 1.3440 (R2). The catalyst for further advances in this pair could be another set of dovish remarks by Governor Poloz today.
EUR/JPY
Support: 119.50 (S1), 118.70 (S2), 118.50 (S3)
Resistance: 120.35 (R1), 120.70 (R2), 121.45 (R3)
USD/CAD
Support: 1.3320 (S1), 1.3275 (S2), 1.3210 (S3)
Resistance: 1.3410 (R1), 1.3440 (R2), 1.3500 (R3)
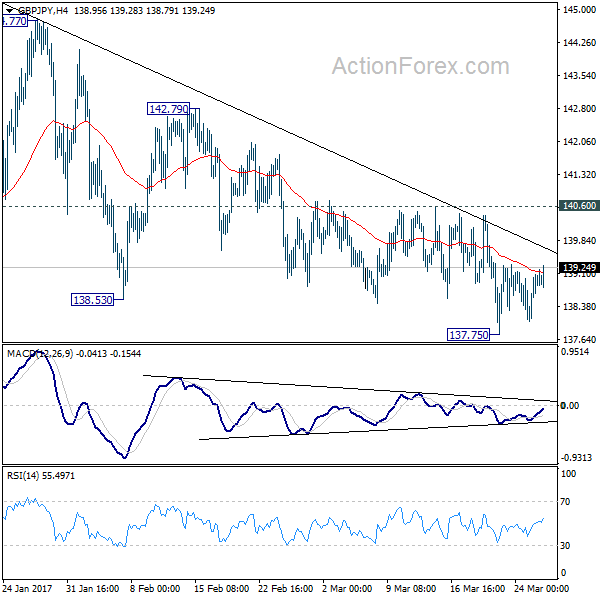
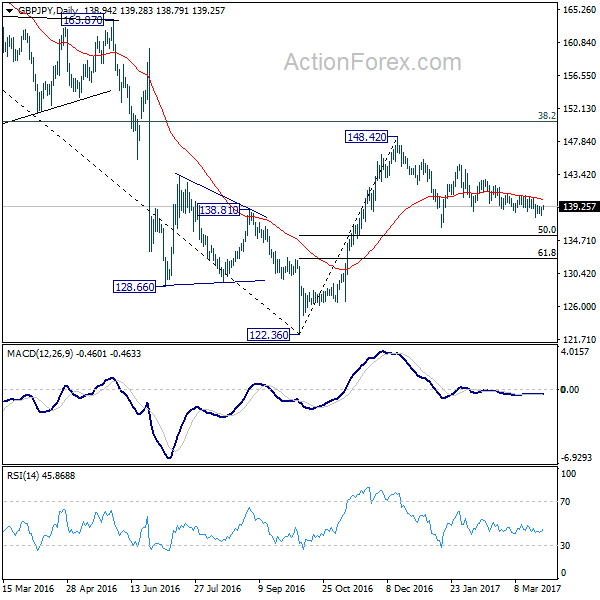
GBP/JPY Daily Outlook
Daily Pivots: (S1) 138.29; (P) 138.70; (R1) 139.36; More...
Intraday bias in GBP/JPY remains neutral at this moment. Deeper decline is mildly in favor as long as 140.60 resistance holds. Below 137.75 will target 136.44 support and below. But we'd expect support from 50% retracement of 122.36 to 148.42 at 135.39 to contain downside and bring rebound. On the upside, break of 140.60 resistance will turn bias to the upside and send GBP/JPY through 144.77 resistance. Overall, price actions from 148.42 are forming a consolidation pattern.
In the bigger picture, price actions from 122.36 medium term bottom are still seen as a corrective pattern. Main focus is on 38.2% retracement of 195.86 to 122.36 at 150.42. Rejection from there will turn the cross into medium term sideway pattern. Or, sustained break of 50% retracement of 122.36 to 148.42 at 135.39 will turn outlook bearish for a test on 122.36 low. Though, sustained break of 150.42 will extend the rebound towards 61.8% retracement of 195.86 to 122.36 at 167.78.
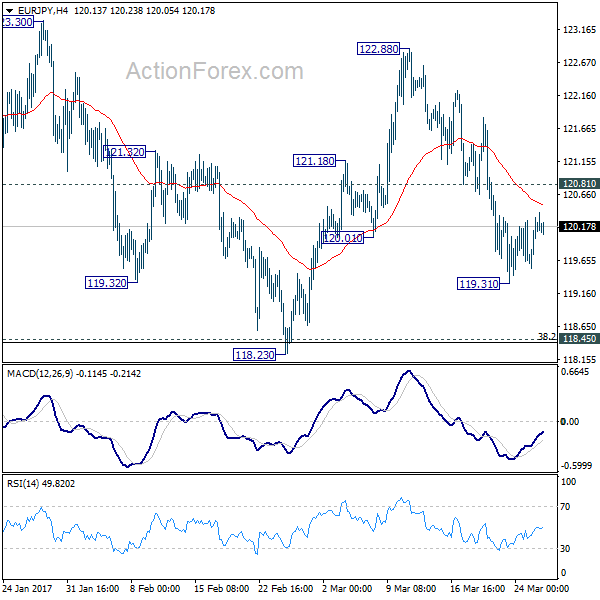
EUR/JPY Daily Outlook
Daily Pivots: (S1) 119.73; (P) 120.02; (R1) 120.51; More...
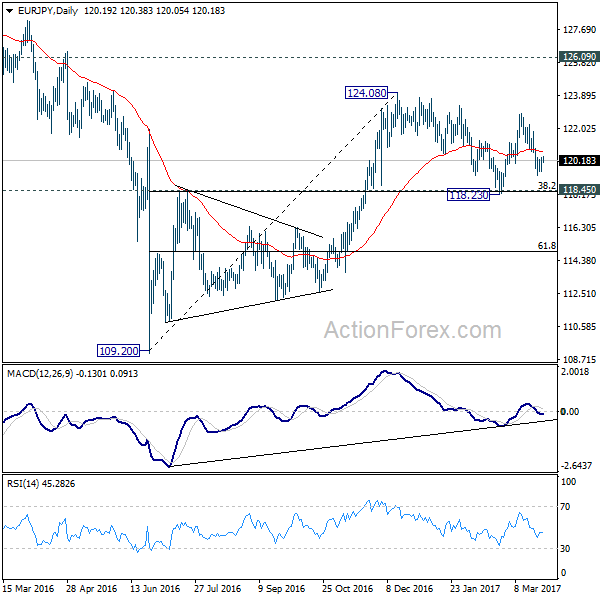
Intraday bias in EUR/JPY remains neutral for the moment. Below 119.31 will extend fall from 122.88 to 118.23 low. But we'd expect strong support from 118.45 key cluster support level (38.2% retracement of 109.20 to 124.08 at 118.39) to contain downside and bring rebound. On the upside, above 120.81 minor resistance will turn bias back to the upside for 124.08 high. Overall, price actions from 124.08 are developing into a consolidative pattern and upside breakout is expected later.
In the bigger picture, we're holding on to the view that medium term rise from 109.20 is still in progress. Focus is on 126.09 key resistance level. Sustained break will confirm completion of the whole decline from 149.76. And rise from 109.20 is of the same degree as the fall from 149.76. In such case, further rally would be seen to 104.04 resistance and possibly above before topping. Meanwhile, rejection from 126.09, or firm break of 118.45 cluster support, will likely extend the fall from 149.76 through 109.20 low.
EUR/AUD Daily Outlook
Daily Pivots: (S1) 1.4186; (P) 1.4248; (R1) 1.4323; More...
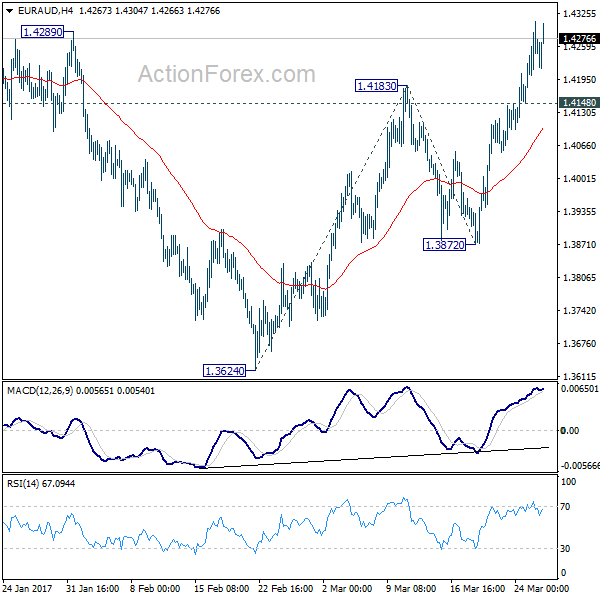
Intraday bias in EUR/AUD remains on the upside for the moment. Current rise from 1.3624 should target 100% projection of 1.3624 to 1.4183 from 1.3872 at 1.4431 next. Decisive break there will indicate upside acceleration and target 1.4721 key resistance. On the downside, below 1.4148 minor support will turn bias neutral and bring consolidations first before staging another rally.
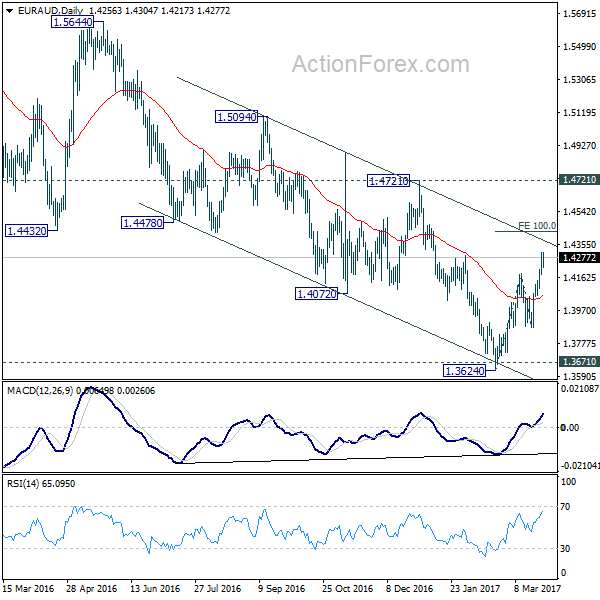
In the bigger picture, price actions from 1.6587 medium term top are viewed as a corrective pattern. Such correction could be completed after testing 1.3671 support. Break of 1.4721 cluster resistance (38.2% retracement of 1.6587 to 1.3624 at 1.4756) should confirm this case and target 61.8% retracement at 1.5455 and above. Overall, we'd expect the up trend from 1.1602 to resume later. However, sustained break of 1.3671 will invalidate our bullish view and would turn focus back to 1.1602 long term bottom.
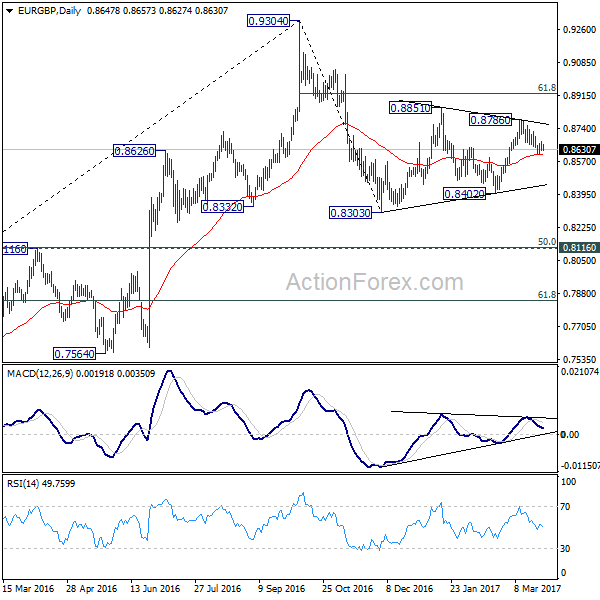
EUR/GBP Daily Outlook
Daily Pivots: (S1) 0.8624; (P) 0.8649; (R1) 0.8674; More...
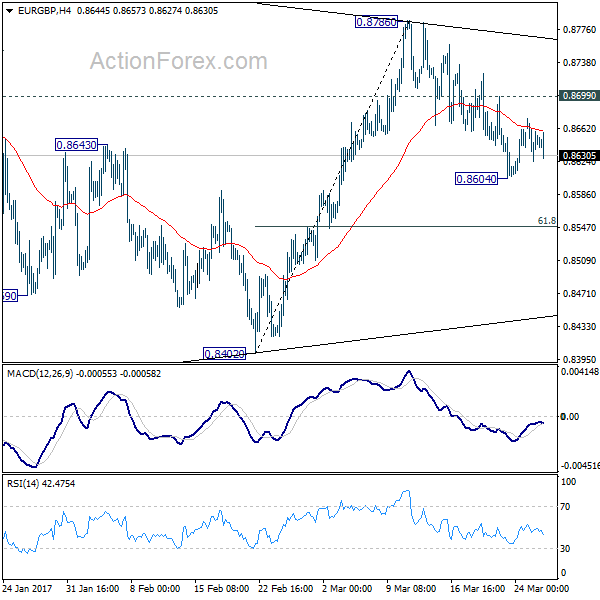
Intraday bias in EUR/GBP remains neutral for the moment. With 0.8699 minor resistance intact, deeper decline is mildly in favor. Below 0.8604 will target 61.8% of 0.8402 to 0.8786 at 0.8549 and possibly below. In that case, we'll look for support above to 0.8402 to bring another rebound before completing that correction from 0.8303. On the upside, above 0.8699 will turn bias back to the upside for 0.8786. Break will target 61.8% retracement of 0.9304 to 0.8303 at 0.8922 to finish the pattern from 0.8303. Overall, price actions from 0.8303 are forming a corrective pattern, as the second leg of the correction from 0.9304.
In the bigger picture, price actions from 0.9304 are viewed as a medium term corrective pattern. Deeper fall cannot be ruled out yet. But we'd expect strong support from 0.8116 cluster support (50% retracement of 0.6935 to 0.9304 at 0.8120) to contain downside. Overall, the corrective pattern would take some time to complete before long term up trend resumes at a later stage. Break of 0.9304 will pave the way to 0.9799 (2008 high).
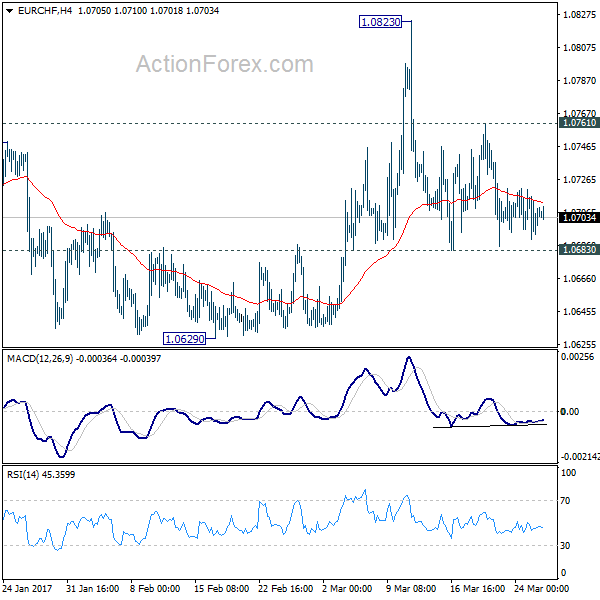
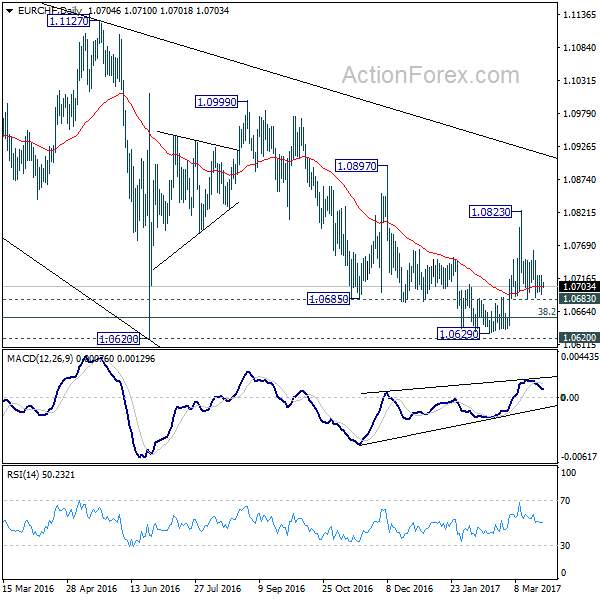
EUR/CHF Daily Outlook
Daily Pivots: (S1) 1.0691; (P) 1.0705; (R1) 1.0720; More...
EUR/CHF is staying in range of 1.0683/0761 and intraday bias remains neutral. We'd slightly favoring the case of trend reversal on bullish convergence condition in daily MACD. And, further rise is mildly in favor as long as 1.0683 minor support holds. Above 1.0761 minor resistance will turn bias to the upside for 1.0823 resistance first. Break will re-affirm the case of trend reversal and target 1.0897 resistance next. However, firm break of 1.0683 minor support will turn bias to the downside for 1.0620 key support level again.
In the bigger picture, the decline from 1.1198 is seen as a corrective move. Decisive break of 1.0897 resistance should confirm that it's completed. And in that case, larger up trend is resuming for another high above 1.1198. Meanwhile, sustained trading below 38.2% retracement of 0.9771 to 1.1198 at 1.0653 will target 50% retracement at 1.0485.
Trade Idea : GBP/USD – Buy at 1.2490
GBP/USD - 1.2573
Most recent candlesticks pattern : N/A
Trend : Near term up
Tenkan-Sen level : 1.2563
Kijun-Sen level : 1.2572
Ichimoku cloud top : 1.2506
Ichimoku cloud bottom : 1.2499
Original strategy :
Buy at 1.2490, Target: 1.2600, Stop: 1.2455
Position : -
Target : -
Stop : -
New strategy :
Buy at 1.2490, Target: 1.2600, Stop: 1.2455
Position : -
Target : -
Stop : -
Cable’s retreat after rising to 1.2616 yesterday suggests consolidation below this level would be seen and below 1.2530 would bring retracement to 1.2490-00, however, price should stay well above support at 1.2469, bring another upomve later, above said resistance at 1.2616 would extend recent rise from 1.2109 to 1.2635-40, however, loss of upward momentum should prevent sharp move beyond 1.2670-80 and price should falter below previous resistance at 1.2706, risk from there is seen for a retreat later.
In view of this, would not chase this rise here and would be prudent to buy cable on subsequent retreat. Only below support at 1.2469 (Friday’s low) would abort and signal top is formed, bring retracement of recent upmove towards previous support at 1.2424 which is likely to hold from here.

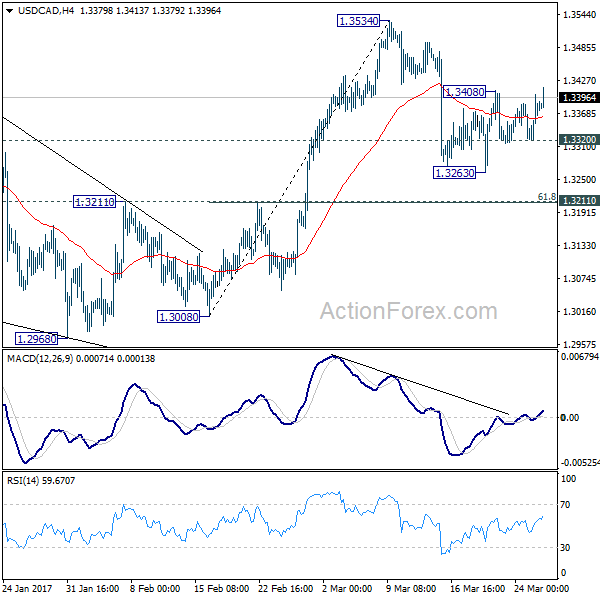
USD/CAD Daily Outlook
Daily Pivots: (S1) 1.3330; (P) 1.3366; (R1) 1.3413; More....
The breach of 1.3408 minor resistance suggests that rebound from 1.3263 is resuming. Intraday bias in USD/CAD is back on the upside for 1.3534 resistance. Break will target 1.3598 key resistance next. On the downside, below 1.3320 minor support will turn bias to the downside to extend the fall from 1.3534. But we'd expect strong support from 1.3211 cluster level (61.8% retracement of 1.3008 to 1.3534 at 1.3209) to contain downside and bring rebound. Overall, rise from 1.2968 is expected to resume later to extend through the whole medium term rise from 1.2460 through 1.3598.
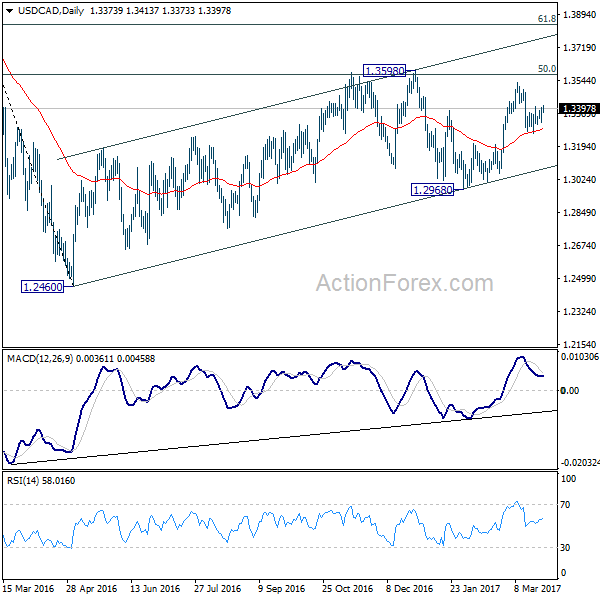
In the bigger picture, price actions from 1.4689 medium term top are seen as a correction pattern. The first leg has completed at 1.2460. The second leg is likely still in progress and could target 61.8% retracement of 1.4689 to 1.2460 at 1.3838. We'd look for reversal signal there to start the third leg. Break of 1.2968 wold at least bring at retest of 1.2460 low. However, sustained trading above 1.3838 would pave the way to retest 1.4689 high.