
Sample Category Title
EUR/USD: German Business Confidence Increased To Its Strongest Level Since 2011 In March
For the 24 hours to 23:00 GMT, the EUR rose 0.23% against the USD and closed at 1.0864, after Germany's Ifo business climate index surprisingly advanced to a nearly seven-year high level of 112.3 in March, underscoring optimism over the health of the nation's business sector, despite rumblings of protectionism across the Euro-zone. Markets expected the index to remain steady at a revised level of 111.1, registered in the prior month.
Additionally, the nation's Ifo business expectations index climbed more-than-expected to a level of 105.7 in March, against market expectations of an advance to a level of 104.3 and after recording a reading of 104.2 in the prior month. Also, the nation's Ifo current assessment index registered an unexpected rise to a level of 119.3 in March, confounding expectations of a drop to a level of 118.3 and compared to a level of 118.4 in the previous month.
In the US, the Chicago Federal Reserve (Fed) President, Charles Evans, stated that three interest rate hikes remain more plausible this year, but two rate hikes are also conceivable, as the outlook remains uncertain, particularly with the latest failure of the healthcare bill. Nevertheless, he also added that the central bank could raise interest rates four times this year if inflation picks up markedly.
Separately, the Dallas Fed President, Robert Kaplan, indicated that he would support further monetary policy tightening if the US economy continues to show progress and nears the central bank's dual mandate of full employment and 2.0% inflation.
In the Asian session, at GMT0300, the pair is trading at 1.0859, with the EUR trading slightly lower against the USD from yesterday's close.
The pair is expected to find support at 1.0830, and a fall through could take it to the next support level of 1.0801. The pair is expected to find its first resistance at 1.0896, and a rise through could take it to the next resistance level of 1.0933.
With no crucial economic releases in the Euro-zone today, investors would direct their attention to a speech by the US Fed Chief, Janet Yellen, scheduled later today. Moreover, the US CB consumer confidence index for March as well as advance goods trade balance and wholesale inventories data, both for February, will garner a significant amount of market attention.
The currency pair is showing convergence with its 20 Hr moving average and trading above its 50 Hr moving average.

GBP/USD: Pound Trading A Tad Higher In The Asian Session
For the 24 hours to 23:00 GMT, the GBP rose 0.4% against the USD and closed at 1.2561.
In the Asian session, at GMT0300, the pair is trading at 1.2563, with the GBP trading slightly higher against the USD from yesterday’s close.
The pair is expected to find support at 1.2510, and a fall through could take it to the next support level of 1.2456. The pair is expected to find its first resistance at 1.2616, and a rise through could take it to the next resistance level of 1.2668.
The currency pair is showing convergence with its 20 Hr moving average and trading above its 50 Hr moving average.

USD/JPY: Japanese Yen Trading Marginally Lower This Morning
For the 24 hours to 23:00 GMT, the USD rose 0.19% against the JPY and closed at 110.6.
In the Asian session, at GMT0300, the pair is trading at 110.64, with the USD trading slightly higher against the JPY from yesterday’s close.
The pair is expected to find support at 110.21, and a fall through could take it to the next support level of 109.79. The pair is expected to find its first resistance at 110.94, and a rise through could take it to the next resistance level of 111.25.
Going ahead, market participants will keep a close watch on Japan’s retail trade and large retailers’ sales data, both for February and the small business confidence index for March, slated to release overnight.
The currency pair is trading above its 20 Hr moving average and showing convergence with its 50 Hr moving average.

USD/CHF: Swiss Franc Trading A Tad Lower, Ahead Of Switzerland’s ZEW Expectations Survey Data
For the 24 hours to 23:00 GMT, the USD declined 0.28% against the CHF and closed at 0.9854.
On the economic front, Switzerland's total sight deposits advanced to a level of CHF560.1 billion in the week ended 24 March, compared to CHF557.2 billion recorded in the previous week.
In the Asian session, at GMT0300, the pair is trading at 0.9856, with the USD trading slightly higher against the CHF from yesterday's close.
The pair is expected to find support at 0.9818, and a fall through could take it to the next support level of 0.9779. The pair is expected to find its first resistance at 0.9889, and a rise through could take it to the next resistance level of 0.9921.
Moving ahead, traders will look forward to Switzerland's ZEW survey of expectations index for March along with the UBS consumption indicator for February and the KOF spring economic forecast report, all scheduled for tomorrow.
The currency pair is showing convergence with its 20 Hr moving average and trading below its 50 Hr moving average.

USD/CAD: Loonie Reverses Its Losses In The Asian Session
For the 24 hours to 23:00 GMT, the USD rose 0.32% against the CAD and closed at 1.3380.
In the Asian session, at GMT0300, the pair is trading at 1.3378, with the USD trading slightly lower against the CAD from yesterday’s close.
The pair is expected to find support at 1.3331, and a fall through could take it to the next support level of 1.3284. The pair is expected to find its first resistance at 1.3413, and a rise through could take it to the next resistance level of 1.3448.
Going forward, market participants would keep a close eye on a speech by the Bank of Canada Governor, Stephen Poloz, scheduled later today.
The currency pair is trading above its 20 Hr and 50 Hr moving averages.

EUR/USD, GBP/USD Build Wave-3 Momentum And Wave-4 Retracement
Currency pair EUR/USD
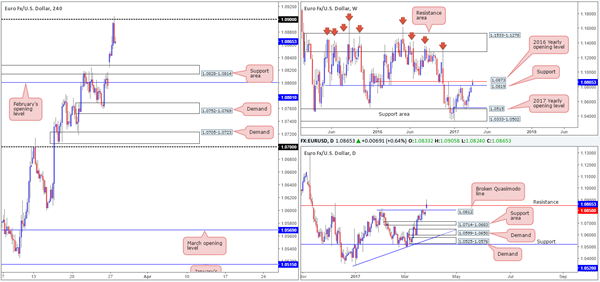
The EUR/USD indeed continued with the uptrend yesterday by breaking slightly above 1.09. Price has bounced at the 61.8% Fibonacci target of wave C (green) could extend towards the 100% Fibonacci target near the psychological round level of 1.10.
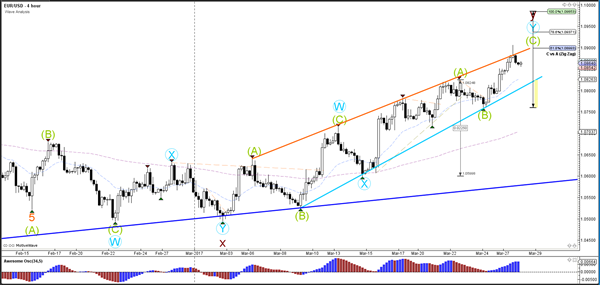
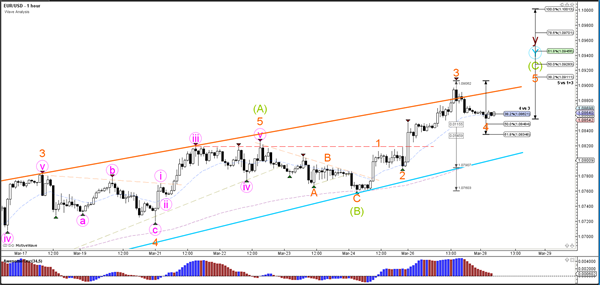
The EUR/USD indeed completed a bullish wave 3 (orange) as indicated yesterday. A bearish retracement for a wave 4 (orange) seems likely at the moment and the Fibonacci levels of wave 4 vs 3 could act as support. A break below the 61.8% Fib makes a wave 4 less likely and a break below the channel invalidates it.
Currency pair GBP/USD
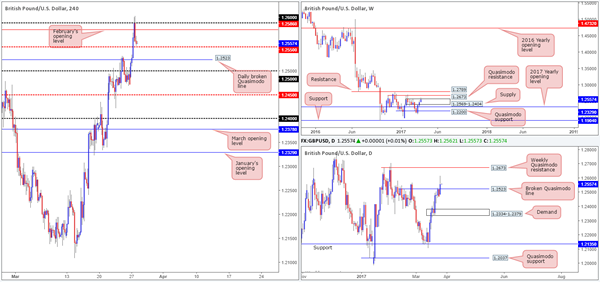
The GBP/USD broke above the resistance trend line (dotted red) and continues its strong bullish march higher within a wave C (orange).
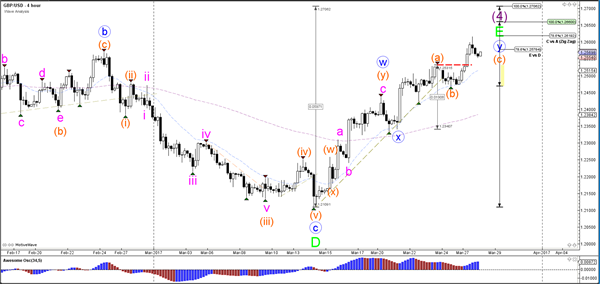
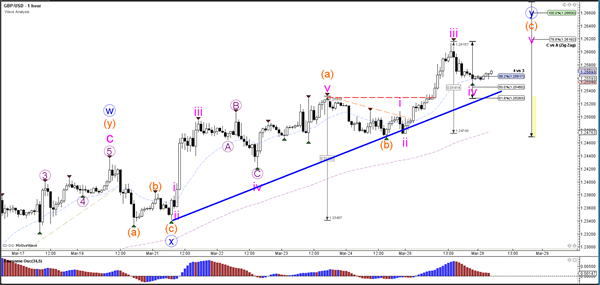
The GBP/USD completed a bullish wave 3 (pink) and seems to be building a bearish retracement for a wave 4 (pink) at the moment. The Fibonacci levels of wave 4 vs 3 could act as support but a break below the 61.8% Fib makes a wave 4 less likely.
Currency pair USD/JPY
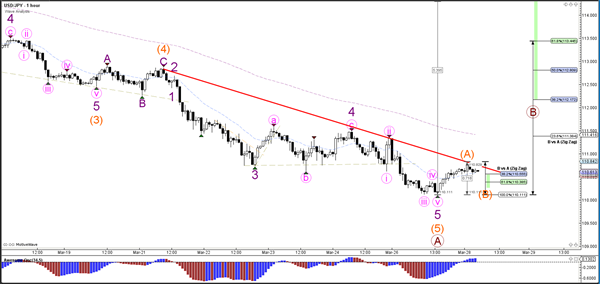
The USD/JPY is probably building a larger bearish ABC zigzag (brown), which could take price down to the 50% Fibonacci retracement support level of wave 4 vs 3 (purple).
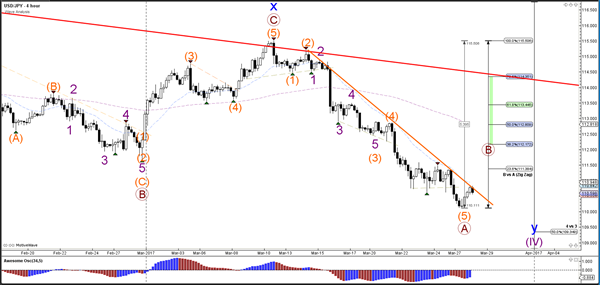
The USD/JPY has divergence between the bottom of wave 3 (purple) and wave 5 (purple) which could trigger a retracement such as an ABC (orange) zigzag. A break below the 100% Fibonacci of wave B vs A invalidates the ABC pattern.
Daily Technical Outlook And Review
A note on lower timeframe confirming price action...
Waiting for lower timeframe confirmation is our main tool to confirm strength within higher timeframe zones, and has really been the key to our trading success. It takes a little time to understand the subtle nuances, however, as each trade is never the same, but once you master the rhythm so to speak, you will be saved from countless unnecessary losing trades. The following is a list of what we look for:
- A break/retest of supply or demand dependent on which way you're trading.
- A trendline break/retest.
- Buying/selling tails ... essentially we look for a cluster of very obvious spikes off of lower timeframe support and resistance levels within the higher timeframe zone.
- Candlestick patterns. We tend to only stick with pin bars and engulfing bars as these have proven to be the most effective.
EUR/USD
The EUR started the week off on a strong footing, gapping around 50 pips north at the open which remains unfilled at this point. Strong buying, as you can see, took place throughout Asia and London. It was only once price crossed swords with the 1.09 handle going into the US session did we see the bears make an appearance, which has so far erased 50% of the day's gains. Alongside the 1.09 handle, the 2016 yearly opening level at 1.0873 and the daily resistance level coming in at 1.0850 have both been brought into play.
Despite the impressive H4 bearish rotation candle printed from 1.09, the bears have little space to stretch their legs at the moment. Collectively, the following zones are likely to become problematic down the road: the H4 support area at 1.0828-1.0814, the weekly support at 1.0819 and the daily broken Quasimodo line at 1.0812.
Our suggestions: Given the above points, neither a long nor short seems attractive at this time. Therefore, we'll remain on the sidelines during today's action.
Data points to consider: US consumer confidence at 3pm along with FOMC member Kaplan speaking at 6pm GMT.
Levels to watch/live orders:
- Buys: Flat (stop loss: N/A).
- Sells: Flat (stop loss: N/A).
GBP/USD
Kicking this morning's report off with a look at the weekly timeframe, we can see that price briefly spiked above supply coming in at 1.2569-1.2404 yesterday. While this move has likely triggered a truckload of buy stops, which the big boys look to be selling into as we write, there is still a chance that the Quasimodo resistance barrier seen overhead at 1.2673 may come into the picture sometime this week.
Over on the daily candles, the pair closed beyond the Quasimodo resistance level at 1.2523 yesterday. Assuming that the bulls defend this line as support, the next upside hurdle to keep an eyeball on here is the aforementioned weekly Quasimodo resistance base.
The 1.09 handle, alongside February's opening line at 1.2586, elbowed its way into the spotlight on Monday, consequently forcing the piece to close just ahead of the H4 mid-way support at 1.2550.
Our suggestions: Through the simple lens of a technical trader, we see the following:
Selling this market is backed by the current weekly supply. However, seeing as how this would entail shorting into the H4 mid-way support and daily broken Quasimodo line, we would prefer not to get involved here.
Although price is currently trading nearby both the H4 mid-way support and daily broken Quasimodo line, buying this unit is also a tad tricky given that price is circulating within weekly supply!
Much like the EUR/USD, this market is quite restricted. As such, remaining on the sidelines for the time being seems the better path to take right now.
Data points to consider: US consumer confidence at 3pm along with FOMC member Kaplan speaking at 6pm GMT.
Levels to watch/live orders:
- Buys: Flat (stop loss: N/A).
- Sells: Flat (stop loss: N/A).
AUD/USD
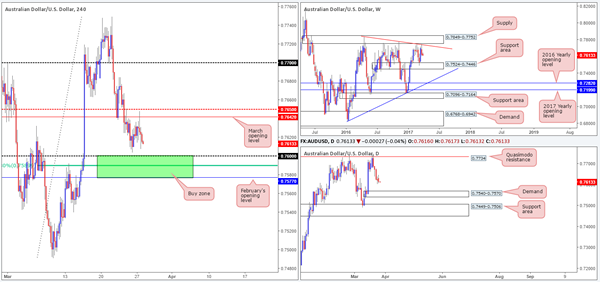
During the course of yesterday's sessions the commodity currency struck March's opening level at 0.7642, following an extension of Friday's bounce from just ahead of the 0.76 handle. The response seen from 0.7642 has so far been solid, and technically speaking, there's very little seen stopping the H4 candles striking the 0.76 boundary today. As mentioned in Monday's report, this psychological level is also positioned nearby February's opening level at 0.7577 and a 61.8% Fib support at 0.7589, forming a rather interesting base of support (painted in green).
What is also notable from this H4 zone is that the daily demand area at 0.7540-0.7570 (positioned just ahead of the weekly support area at 0.7524-0.7446) sits only 7 pips below this area! Therefore, one should prepare for the possibility of a fakeout here!
Our suggestions: While our team is interested in buying from the above noted H4 buy zone, we would still prefer to enter long within the lower limits of its range. That way, we can place stops beyond the daily demand! Should price reach this point and print a reasonably sized H4 bullish rotation candle, then our team would look to buy from here, targeting March's opening level at 0.7642 as an initial take-profit target.
Data points to consider: US consumer confidence at 3pm along with FOMC member Kaplan speaking at 6pm GMT.
Levels to watch/live orders:
- Buys: 0.7577/0.76 ([waiting for a reasonably sized H4 bullish candle to form before pressing the buy button is advised] stop loss: Ideally beyond the trigger candle).
- Sells: Flat (stop loss: N/A).
USD/JPY
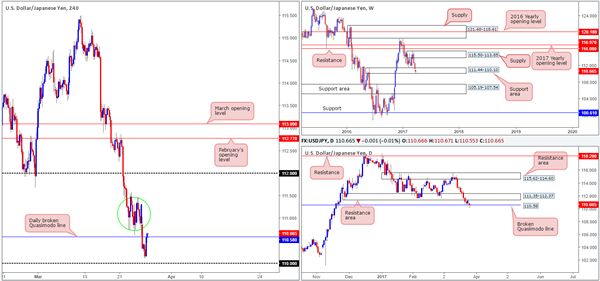
Leaving the psychological handle 110 unchallenged, the pair gravitated north going into the early hours of yesterday's US segment. This, as you can see, eventually forced H4 price back above the daily broken Quasimodo line at 110.58, consequently forming a reasonably nice-looking daily buying tail. The other key thing to note here is that the weekly candles remain trading within the walls of a support area fixed at 111.44-110.10.
While we would agree that the above points suggest further buying could transpire today, the sellers may still have a hand in this fight! Directly above current price on the H4 scale, there's a lot of wood to chop through seen between the 111.50/111 handle (green circle). On top of this, there's also a daily resistance area pegged at 111.35-112.37 to take into consideration.
Our suggestions: Should the current H4 candle print a buying tail off 110.58, we may look to take an aggressive long from here with stops below the candle's tail, targeting the 111 neighborhood. Here we'd look to reduce risk to breakeven and take 70% off the table, leaving the remaining 30% to run.
Data points to consider: US consumer confidence at 3pm along with FOMC member Kaplan speaking at 6pm GMT.
Levels to watch/live orders:
- Buys: Watch for H4 price to form a buying tail off 110.58 and then look to trade the break of the candle's high (stop loss: ideally planted beyond the rejection candle's tail).
- Sells: Flat (stop loss: N/A).
USD/CAD
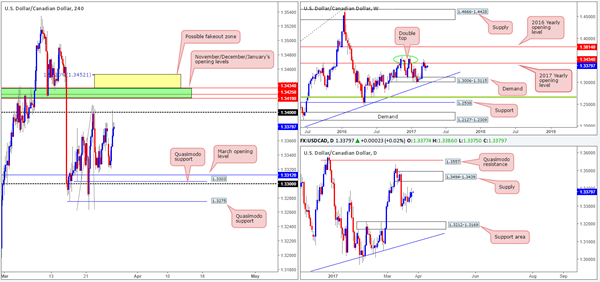
The USD/CAD began the week in a rather negative climate, gapping 22 pips south at the open and collapsing to a session low of 1.3321 going into the London segment. Shortly after, however, the loonie managed to catch a healthy bid just ahead of March's opening level at 1.3312, and aggressively advance up to the 1.34 boundary. Apart from 1.34, the next H4 resistance on tap can be seen at 1.3434/1.3419 (November, December and January's opening levels marked in green). It might also be worth noting that directly above here there is a possible H4 fakeout area painted in yellow at 1.3452/1.3434 (the top edge denotes a 127.2% Fib ext. taken from the low 1.3263), which happens to register nicely with the lower limits of a daily supply at 1.3494-1.3439.
Looking over to the bigger picture, weekly action is seen trading within shouting distance of the 2017 yearly opening base line at 1.3434. Daily flow, nonetheless, still offers very little in terms of direction at the moment. The unit is seen meandering mid-range between the aforementioned supply and a support area at 1.3212-1.3169.
Our suggestions: We still have a keen interest in The H4 1.3434/1.3419 region for shorts. Here's why:
Of note is the 1.34 handle. Psychological levels are prone to fakeouts, and with 1.3434/1.3419 lurking just above 1.34, we feel it'd be a fantastic barrier to help facilitate a fakeout.
When these monthly levels converge, we typically find that they hold firm the majority of the time offering at least a bounce.
In that these monthly levels form a rather small zone, however, and with a somewhat attractive H4 fakeout zone seen above it (attractive due to it being located within daily supply) there is also a chance that price could whipsaw through the monthly levels before turning lower.
To short, we are looking for a H4 bearish selling wick to form that pierces into our pre-determined H4 yellow zone discussed above. With this, a sell from here would be a valid call, in our opinion. From this point, 1.34 could be a potentially troublesome level, so we'd be looking for this base to be consumed, which would in turn be our cue to reduce risk to breakeven.
Data points to consider: US consumer confidence at 3pm along with FOMC member Kaplan speaking at 6pm. BoC Gov. Poloz speaks at 3.10pm GMT.
Levels to watch/live orders:
- Buys: Flat (stop loss: N/A).
- Sells: 1.3452/1.3419 ([watch for a H4 bearish selling wick to form within this range before considering a short] stop loss: ideally beyond the candle's wick).
USD/CHF
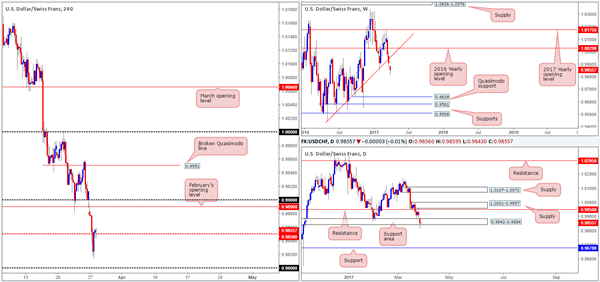
The Swissy, as you can see, opened the week on a bearish note, gapping 30 pips south. Following a retest to the underside of February's opening base line at 0.9890, the pair continued to dive lower until price stabilized a few pips ahead of the 0.98 handle during the early hours of the US segment, ending the day closing back above the H4 mid-way line 0.9850.
With this in mind, how do things stand on the bigger picture? Last week's action saw weekly price conclude trade beyond the trendline support extended from low 0.9443. Providing that the bears continue to hold ground here, then the next support target does not come into view until the 0.9639 mark! Down on the daily chart, nevertheless, price is currently holding firm within a support area pegged at 0.9842-0.9884, despite yesterday's aggressive spike below it. It would take a decisive close beyond this support area to convince us that price could be headed for the support line coming in at 0.9678, which sits only a few pips above the weekly support at 0.9639.
Our suggestions: Given the weekly timeframe, and considering that daily price looks as though it's hanging on by a thread within the current support area, buying from 0.9850 is not something we'd label high probability. A close back below this number on the other hand, followed up with a retest as resistance, would be enough for us to begin considering selling this market, targeting the 0.98 handle as a first port of call.
Data points to consider: US consumer confidence at 3pm along with FOMC member Kaplan speaking at 6pm GMT.
Levels to watch/live orders:
- Buys: Flat (stop loss: N/A).
- Sells: Watch for H4 price to close back below the 0.9850 level and then look to trade any retest seen thereafter (stop loss: ideally planted beyond the rejection candle's wick).
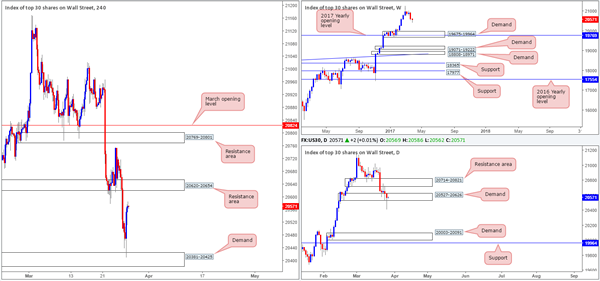
DOW 30
In recent sessions, H4 price shook hands with demand coming in at 20381-20425 and rallied strongly. Despite the market registering a loss yesterday, daily price printed a beautiful-looking buying tail that whipsawed through demand at 20527-20626. Buying at current price, however, would be challenging given the nearby H4 resistance zone drawn in at 20620-20654. And, of course, selling from this H4 zone would place one against potential daily buyers!
Our suggestions: Unfortunately, we see very little structure to hang our hat on this morning. As such, opting to stand on the sidelines here may very well be the better path to take today.
Data points to consider: US consumer confidence at 3pm along with FOMC member Kaplan speaking at 6pm GMT
Levels to watch/live orders:
- Buys: Flat (stop loss: N/A).
- Sells: Flat (stop loss: N/A).
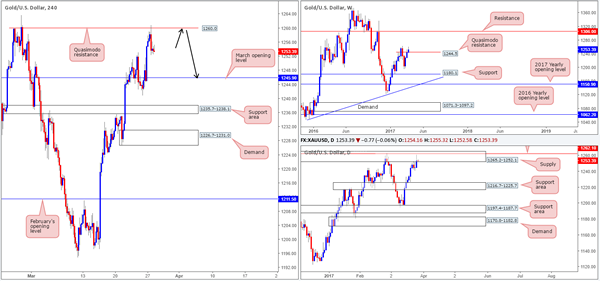
GOLD
Strengthened by dollar weakness, the yellow metal shifted northbound yesterday. It was only once price crossed paths with a H4 Quasimodo resistance barrier at 1260.0 did bullion begin to stabilize and pullback. To our way of seeing things, this H4 level was helped by daily action residing within a supply area seen at 1265.2-1252.1.
Weekly movement on the other hand, shows that price is trading above a weekly Quasimodo resistance line at 1244.5. However, our desk has noted that until the high of this formation is broken (1263.7), the weekly line will remain valid. In other words, all the while the current daily supply area is in play, our team is bearish!
Our suggestions: Should the H4 candles retest the aforementioned H4 Quasimodo resistance today, we would, assuming that a reasonably sized H4 bearish candle is seen, look to short this market, targeting March's opening level at 1245.9.
Levels to watch/live orders:
- Buys: Flat (stop loss: N/A).
- Sells: 1260.0 region ([waiting for a reasonably sized H4 bearish candle to form is advised] stop loss: ideally beyond the trigger candle's wick).
European Open Briefing
Global Markets:
- Asian stock markets: Nikkei up 1.10 %, Shanghai Composite fell 0.20 %, Hang Seng gained 0.70 %, ASX 200 rallied 1.15 %
- Commodities: Gold at $1254 (-0.15 %), Silver at $18.09 (-0.15 %), WTI Oil at $48.00 (+0.50 %), Brent Oil at $51.10 (+0.40 %)
- Rates: US 10-year yield at 2.38, UK 10-year yield at 1.17, German 10-year yield at 0.40
News & Data:
- South Korean GDP (QoQ) Q4 F: 0.50%(est 0.40%; prev 0.40%)
- South Korean GDP (YoY) Q4 F: 2.4% (est 2.3%; prev 2.3%)
- ANZ Roy Morgan Weekly Consumer Confidence Index March 26: 113.8 (prev 112.0)
- PBoC Fixes USDCNY Reference Rate At 6.8782 (prev fix 6.8701 prev close 6.8767)
- Fed’s Kaplan: Inflation Continue to Move Towards 2%
- Kaplan: Fed Would Be Wise to Move Gradually and Patiently
- Stocks, dollar recover as markets try to move past Trump's policy stumble – RTRS
- Weaker dollar lifts oil futures, but soaring U.S. output weighs – RTRS
- Inflation would have to be much stronger for four rate hikes in 2017: Fed's Evans – RTRS
Markets Update:
Sentiment in the stock market improved slightly. US stock indices were able to reverse losses yesterday, and overnight, most of the Asian indices finished the day with a gain. While there still remains uncertainty around US President Trump’s planned tax reform, the market seems to have confidence in it for now.
The Dollar recovered as well. EUR/USD ran into heavy resistance above 1.09 and fell back to 1.0855 overnight. The outlook is positive from a technical perspective, but there is still plenty of resistance on the way to 1.10. Similar price action was seen in GBP/USD, which struggled above 1.26. However, the next notable resistance level there lies at 1.27, near the 200 daily moving average.
The Australian Dollar has been consolidating in a rather tight range in the past three trading days. Should sentiment in the stock market pick up further, the currency could recover though. Support at 0.76 has held convincingly, and a break back above 0.7660 would signal that another test of 0.7750 could follow.
Upcoming Events:
- 15:00 GMT – US CB Consumer Confidence
- 15:00 GMT – US Richmond Manufacturing Index
- 15:10 GMT – Bank of Canada Governor Poloz speaks
Canada’s Economy is Underperforming… and the Emperor’s New Clothes are Magnificent
One of the morals from the classic Hans Christian Andersen story, The Emperor's New Clothes - in which it takes a naively honest child to risk appearing 'extraordinarily simple of character' and point out that the Emperor is in fact wearing nothing at all - is that even generally accepted views should be questioned if contradicted by the facts. In that spirit, we re-examine a commonly held view: that the Canadian economy is significantly underperforming relative to both the U.S. and its longer-run production potential. Taking a step back and looking at recent data in a historical context at the least suggests that this argument is not as one-sided as it may at first seem. This was true even before a run of strong economic data in early 2017 for Canada (with Canadian growth in Q1 2017 tracking, by most estimates, a third consecutive quarterly outperformance relative to the U.S.) as, arguably, underperformance of the Canadian economy in the immediate aftermath of the oil price shock never did fully retrace the outperformance relative to other advanced economies accumulated earlier in the recovery from the 2008/09 recession.
Although there remain legitimate reasons to be concerned about the future of the Canadian economy (the lack of business investment growth, even excluding the energy sector, has created concerns about the pace of future productivity growth, for example), even with the shock to the oil & gas sector over the last two years Canada has retained its position as the G7 GDP growth leader relative to pre-recession levels and recent momentum has improved. There has clearly been an increase in labour market slack in Alberta; however, improvement among most oil importing regions has offset to leave the national unemployment rate (and most other measures of labour market 'slack') at levels that historically have been consistent with the national economy operating at capacity. Wage growth has been disappointing according to some measures but less so in others and it remains the case growth in 'real' worker incomes in Canada have outpaced the U.S., where the economy is more widely accepted to be on a firmer footing, over the full recession/recovery period. Consumer price inflation trends in Canada, while ostensibly not concerning, are also arguably more similar to the U.S. than is commonly acknowledged and there have clearly been more worrying trends emerging in asset (particularly housing) prices in Canada.
Canada continues to lead the G7 countries in GDP growth from pre-2008/09 recession levels...
Canadian GDP growth slowed dramatically after oil prices started to decline sharply towards the end of 2014; however, that underperformance has not been enough to reverse outperformance in the period leading up to the oil price shock, including relative to the U.S. economy. 2015 marked just the second year since the recession that Canadian growth was weaker than in the U.S. (0.9% in Canada versus 2.6% in the U.S.) with the Canadian economy weighed down by the plummet in oil prices. This factor contributed to the Canadian economy underperforming the U.S. in 2016 again, on an average annual basis, but relatively modestly (1.4% versus 1.6%). The year started out slowly, with growth in the second quarter in particular weighed down by the Fort McMurray wildfires, but finished strongly. It remains the case that Canada has not yet relinquished its spot as the G7 growth leader when measured relative to activity just prior to the beginning the 2008/09 recession (Chart 1).
...and recent momentum has improved
Of course if weak momentum over 2015 and early 2016 were to persist, it would just be a matter of time before Canada's longer-run outperformance reverses; however, evidence is mounting that the economy is emerging from its slow patch. As shown in Chart 2, weakness in the Canadian economy over the last two years has been largely concentrated in the oil & gas sector. There was also some earlier slowing in nonenergy commodity sectors but non-commodity sectors (the other ~80% of the economy) have continued to grow, on balance, at a steady pace. We continue to expect the level of investment activity in the oil & gas sector to remain subdued relative to earlier 2014 levels because oil prices remain below where they were. Nonetheless, weakness has clearly eased and some preliminary data (including a tick higher in investment intentions and recent increases in oil & gas drilling activity) suggests that the sector will shift back to a modestly positive contributor to growth in the near-term. Outperformance over the second half of 2016 in Canada left the year-over-year rate of growth in GDP in the fourth quarter already equal to that of the U.S. at 1.9% and early data releases for 2017 have been constructive.
The regional composition has changed but the Canadian unemployment rate is still low...
Labour markets have clearly deteriorated in the oil-producing provinces, particularly in Alberta where the unemployment rate has increased sharply from low levels; however, improvement elsewhere - unemployment rates have declined in almost all of the net oil-importing provinces (Manitoba was the one exception although that province still had the second-lowest unemployment rate in the country in February, behind only B.C.) - suggests that the net impact has been more of a geographic shift in the location of labour market strength/weakness than a net impact on the 'national' labour market. The Canadian unemployment rate was 6.6% in February, slightly below its level at the end of 2014. The same pattern is importantly true using broader measures of labour market slack that account for 'hidden unemployment' in the form of discouraged workers or involuntary part-time employees (Chart 3).
The current national unemployment rate level is also, notably, still well-below its 7% 10-year pre-recession average, a period in which the Bank of Canada's historical estimates of the 'output gap' - which estimates the extent to which the economy is operating below (negative) or above (positive) its longer-run sustainable production capacity - were positive, on average. In other words, current levels of labour market 'slack' nationally are below levels that have historically been considered consistent with 'full-employment' at the national level.
...even when compared to the U.S.
Adjusting Canadian unemployment rate data to U.S. definitions - differences in the way the rates are calculated, in large part related to the definition of who is considered to be "in the labour force," typically add about a percentage point to the 'official' Canadian unemployment rate relative to the U.S. - the Canadian rate was 5.4% (on a seasonally adjusted basis) in February. That is still above the U.S. rate, which has declined to 4.7%, but that is not actually historically unusual. Prior to the 2008/09 recession and recovery period - over which Canada's labour market broadly outperformed the U.S. - the Canadian rate had not been below its U.S. equivalent since 1982 with the average gap over the pre-recession period (~2 percentage points) more than twice the current difference. Even in the boom-times in the energy sector ahead of 2008/09 the Canadian unemployment rate never dipped below the U.S. rate (Chart 4).
What about wage growth?
Tighter labour markets - in other words, rising demand relative to supply of labour, as evidenced by a smaller unemployment rate - should, so the theory goes, push wages higher and, admittedly, some indicators of wage growth have failed to show any significant upward pressure. One closely watched measure, hourly wages of permanent employees derived from Statistics Canada's monthly Labour Force Survey has been running just 1% above year-ago levels in January and February this year, without adjusting for inflation. The wage data, like most other Canadian labour force data, is also extremely volatile, however, and other measures have not been so disappointing. Hourly wage growth in the alternative labour market survey, the Survey of Payrolls, Employment, and Hours, has still been trending at slightly above a 2% rate, despite year-overyear declines in Alberta. Overall per-hour labour compensation costs rose 2.1% year-over-year in Q4/16 according to the quarterly productivity accounts data. Combining the employment and wage data, year-over-year growth in total aggregate real (inflation-adjusted) wage earnings was 2.1% in Q4 2016, slightly below the 2.5% U.S. increase but almost double the 1.2% rate a year earlier. Over the full economic cycle Canadian wage growth continues to run above comparable U.S. measures. Although the gap has been narrowing (in part because of weaker Canadian growth recently but also reflecting U.S. labour markets 'catching up' to those in Canada where the initial recession recovery was faster), total real wages and salaries in Canada are 17.2% above their Q4 2007 level (the last quarter before the U.S. entered recession) compared to 13.7% in the U.S. (Chart 5).
Consumer price growth still modest, but similar to the U.S....
Weak inflation trends are also often pointed to as evidence that the economy continues to operate well-below its potential (a symptom of an economy with insufficient demand, theoretically, should be weak price growth); however, here too the data is perhaps not as clearly one-sided as is often thought. Energy prices continue to be buffeted by oil price volatility and food price growth has been historically weak, reflecting a combination of earlier declines in agricultural commodity prices as well as industry-specific competitiveness factors. Excluding those, often volatile components, Canadian CPI rose 2.0% from a year ago in February. That was down just slightly from an almost 10-year high 2.2% in January. The latest reading was above the1.8% 10-year pre-recession average and was just slightly below the 2.2% February year-over-year gain in the equivalent, and closely-watched, U.S. measure (Chart 6).
....and clearly evidence of upward pressure on asset prices in some regions
Price pressure resulting from a stronger economy also does not necessarily have to manifest exclusively through prices for current consumption as measured by the CPI. Clearly some upward pressure on asset prices has emerged, particularly in some of the hotter residential real-estate markets. The normal counterpoint is that housing market heat has been largely contained to regions in and around Vancouver and Toronto, so housing market 'tightness' is not really a 'national' phenomenon requiring a 'national' policy response. The Canadian Real Estate Association (CREA) nonetheless noted in the release of their February statistics that almost 60% of local markets they track nationally were in 'sellers -market' territory. By our count, that share was about 40% a year ago and just a quarter the year before that. Most of those markets are admittedly still located in Ontario and B.C., but Ontario and B.C. together account for about half the Canadian economy. Over the last three months (ending in February), 75% of markets in Ontario and almost 60% of markets in B.C. saw average house price increases of 10% or more on a year-over-year basis. Those shares are both up from about 25% a year ago and closer to 10% in the same period in 2015. The question is at what point do these 'local' trends impact enough markets that they generate 'national' concerns for policymakers. Clearly, there has already been a significant impact on national-level measures of house prices. Canadian house prices were up 12.3% in 2016 according to CREA's benchmark house price index. In February, year-over-year growth in the measure hit a whopping 16%.
So how much 'slack' is there in the Canadian economy - and what should be done about it?
It is not possible to directly observe economic slack. Rather the extent to which the economy is utilizing its underlying productive resources needs to be inferred based on a mix of economic data, comparisons to historical performance over multiple business cycles, and economic theory. While there has clearly been an industrial and geographical reorientation of economic strength in recent years away from oil-producing regions and there have been disappointments - for example, weakness in business investment even excluding the oil & gas sector - we would argue that the balance of economic data at the least suggests that the argument that the Canadian economy as a whole is significantly underperforming both the United States and its own long-run production potential is not as one-sided as it may at first seem.
To be sure, saying that the economy nationally is, perhaps, closer to its longer-run production potential than is commonly thought does not mean that regional divergence in growth prospects should be ignored. It obviously doesn't make sense, for example, to argue that households in Alberta should be 'okay' with a 9% unemployment rate because the rate is now substantially lower in Ontario and B.C. The appropriate policy response is also, however, different in the case of a 'national' versus a 'regional' economic shock. Monetary policy stimulus (ie. low interest rates) has likely provided some benefit to activity in regions where economic activity is more subdued but the persistence of those rates at historically low levels also runs the risk of contributing to overheating in regions (particularly Ontario and B.C.) where activity has been significantly stronger and where, in some markets, worrying trends in house prices have clearly emerged. The closer the economy nationally is judged to be to its long-run production capacity the less appropriate low interest rates become as a policy response with targeted government fiscal policy measures (for example through re-training programs, investments in new industries/technologies to reduce reliance on the oil & gas sector, etc) better suited to deal with regional divergence in performance.
Flogging a Dead Horse
A modest risk off mindset engulfed investors to start the week, Not too surprisingly investors continued to ponder the US political musings while extrapolating just how negatively impactful the recent development would be from the viewpoint of both US fiscal and tax reform. While the deluge of repetitive headlines centred on finger pointing and speculative fragmentation amongst GOP members to the extent, it did become akin to flogging a dead horse. But mainly the bungled AHCA vote means less money to fund tax reform without ballooning the fiscal deficit.Naturally the market, which always prices in the worse case scenario, spent the past 24 hours bemoaning the Capitol Hills fallout while questioning the US administration's broader economic policy agenda. This mindset had left the risk compound under pressure but let's not forget that with WTI precipitously tumbling to the key $47.00 per barrel level, it too likely had as much influence over investor's psyche but when the key WTI support level held the markets moved into consolidation mode. Commodity markets closed the session mixed, Gold higher but Iron ore down 4 % The Greenback is weaker against most major counterparts but is slightly above its session lows.While US equity markets finished none the worse for wear with the S&P500 closing down just 0.1% as stock traders while undecided about the significance of the failed health care bill, have certainly not hit the panic button. And correctly so in my view, as it's unlikely we've seen the last of the Obamacare repeal as the Trump administration now realises the importance of getting one's ducks in a row.
Australian Dollar
The Australian dollar continues to feel the overhang of risk aversion but is very wobbly after getting sideswiped by another drop in Iron ore prices overnight. While mainland's deleveraging policy triggered the slide; it appears the markets are finally coming to the reality check that when the port stock rises, it foretells a drop in prices. And with the Trump reflation trade on the ropes, those stockpiles are looking even more ominous in traders eyes. In this light, I think it would be safe to say that the Aussie will continue to underperform its' commodity bloc peers and on a break of the .7600 level we should expect AUD is selling to accelerate.
Euro
The Sturdy PMI surveys and the general improving tone in the EU data continue to underpin the Euro. And with the ECB members making overtones regarding shifting policy, we may be in the early stages of a significant reversal in the Euro fortunes as the fundamentals are starting to turn favourably hard.
Japanese Yen
USDJPY had all but lost its lost topside momentum near term, and it would surprise me if the markets did not go all out into sell-on-rallies exemplar. Mounting headwinds from the national Moritomo scandal, Japanese Year end repatriation flow, US political uncertainty and off course a less hawkish Fed All has the market thinking the lower is the path of least resistance. Mind you much this mindset is driven on the back of discombobulation on Capitol Hill so at any sign of GOP unity can shift this risk-averse mindset quickly.