Sample Category Title
Lack of Fundamentals Leave Canadian Dollar Unchanged
USD/CAD is almost unchanged in the Monday session. Currently, the pair is trading at 1.3350. On the release front, it's a quiet start to the week, with no economic indicators in Canada or the US. On Tuesday, the US releases CB Consumer Confidence.
The US dollar enjoyed an impressive run after Donald Trump's election last November. However, the euphoria over President Trump's upset election win is long past. The inquiry into the Trump administration's links with Russia continues to make headlines, and is another cause for concern for nervous investors. Trump has been in office for over two months, but he has yet to provide any details over even an outline of economic policy. Last week, Trump's proposed bill to change Obamacare was not even voted on, as the White House could not garner enough support to pass the bill. This debacle will only increase market uneasiness over Trump, and could send the DAX lower.
The Canadian dollar is sensitive to movement in oil prices, so lower crude prices could weigh on the currency. West Texas crude has dropped 1.0% in March, and dipped to $47.05 last week, its lowest level since the end of November. Crude headed lower after Crude Oil Inventories posted a strong surplus of 5.0 million barrels, crushing the estimate of 1.9 million. The weekly indicator has recorded only two declines in 2017, as US oil drillers continue to enter the market and ratchet up US oil production. This, together with increased US shale production, has more than offset OPEC's production cuts. Last week, OPEC announced it was considering extending the production cut agreement by another 6 months, until the end of 2017, but it's doubtful that such a move will prop up oil prices.
EUR/USD Elliott Wave Analysis
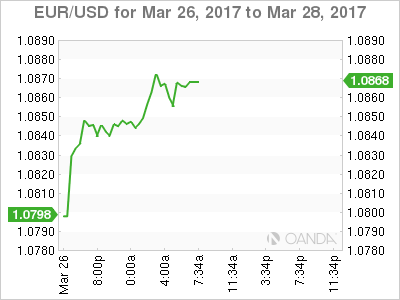
EUR/USD – 1.0877
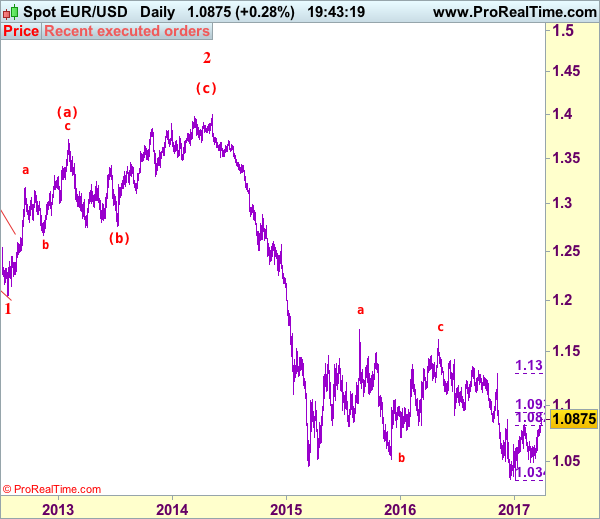
EUR/USD: Wave (c) of 2 ended at 1.3993 and wave 3 of III has commenced for weakness to 1.0411 (1.236 of wave 1), then 1.0000.
The single currency finally broke above previous resistance at 1.0829, adding credence to our bullish view that the erratic rise from 1.0340 low is still in progress and upside bias remains for this move to bring retracement of early downtrend, hence further gain to 1.0930-35 (61.8% Fibonacci retracement of 1.1300-1.0340), then 1.1000 would be seen, however, near term overbought condition should prevent sharp move beyond latter level and reckon 1.1065-70 would limit upside and price should falter below 1.1100, bring retreat later.
Our preferred count on the daily chart remains that a wave (II) from 1.2329 ended at 1.5145 with A-leg ended at 1.4720, followed by wave B at 1.2457, the wave C from there was also a 3 legged move and is labeled as (a): 1.3739, (b): 1.2885, the wave iii of the 5-waver (c) from 1.2885 has ended at 1.4339 and wave iv is a triangle ended at 1.3878 and wave v formed a top at 1.5145. The decline from there is a 5-waver (C) with minor wave (i) of I of (C) ended at 1.4218 with wave (ii) ended at 1.4580, wave (iii) ended at 1.3267 and wave (iv) ended at 1.3692 and wave (v) ended at 1.1876, this is also the low of wave I of (C) and wave II ended at 1.4940, hence wave III is now in progress with a diagonal wave 1 ended at 1.2042, the breach of previous support at 1.1876 (wave I trough) adds credence to our view that the wave 2 has ended at 1.3993, wave 3 has commenced for further weakness to 1.0411, then towards 1.0000.
On the downside, whilst pullback to 1.0820-25 cannot be ruled out, reckon downside would be limited to support at 1.0760 and bring another rise later. A daily close below support at 1.0719 would abort and suggest top is possibly formed, bring further fall to 1.0650-60 and indicated key support at 1.0600 should hold. Only a daily close below this level would confirm top formed and signal the aforesaid rise from 1.0340 has ended, bring further fall to 1.0550, then 1.0525 support but support at 1.0493-96 would hold from here.
Recommendation: Buy at 1.0780 for 1.0980 with stop below 1.0680.
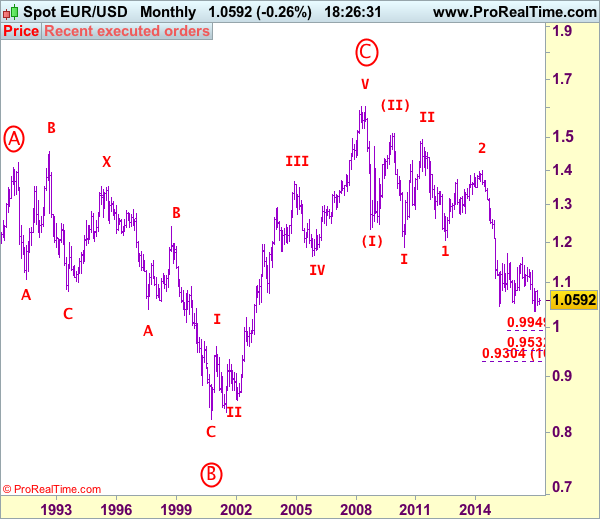
Euro's long-term uptrend started from 0.8228 (26 Oct 2000) with an impulsive structure. The rise from 0.8228 to 0.9593 (5 Jan 2001) is labeled as wave I, the retreat to 0.8352 (6 Jul 2001) is wave II and the rally to 1.3670 (31 Dec 2004) is wave III. Wave IV from there ended at 1.1640 (15 Nov 2005), the subsequent upmove to 1.6040 (July 15, 2008) is treated as wave V, the major selloff from the record high of 1.6040 to 1.2329 (October 27, 2008) signals a reversal has taken place with (I) leg ended at 1.2329 and once (II) ended at 1.5145, wave (III) itself is an extended move with I: 1.1876 and complex wave II ended at 1.4902, wave III has commenced with wave 1 and 2 ended at 1.2042 and 1.3993 respectively, wave 3 of III is now unfolding for weakness towards parity.
USD/JPY Elliott Wave Analysis
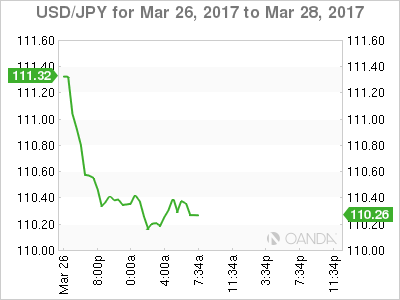
USD/JPY - 110.25
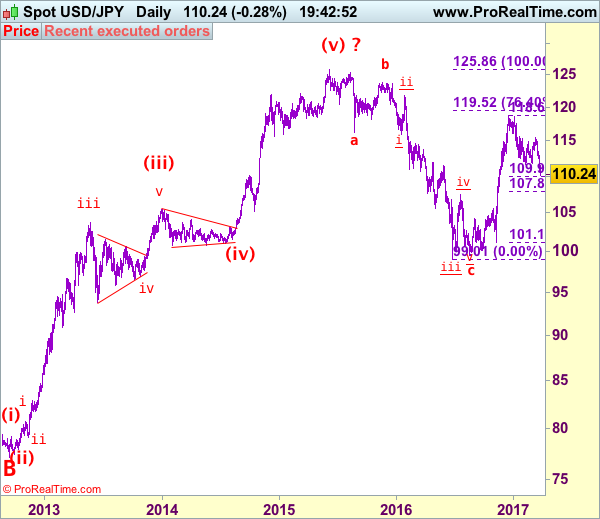
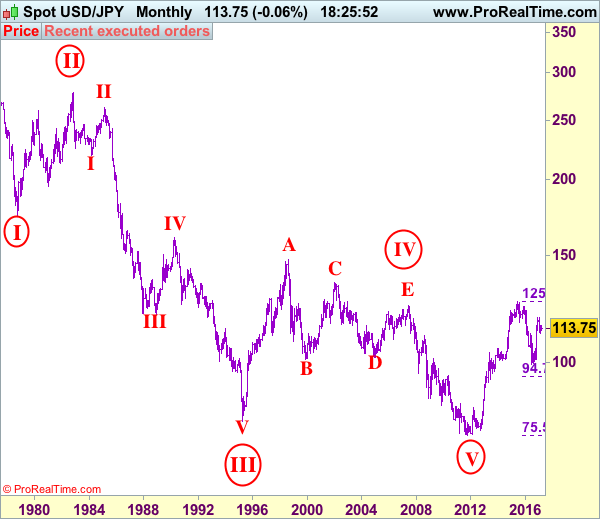
USD/JPY – Wave V of larger degree circle V has possibly ended at 75.31 and major correction has commenced and already met indicated target at 125.00.
As the greenback has dropped again after breaking indicated previous support at 111.36 last week, adding credence to our bearish view that the erratic decline from 118.66 top (2016 high) has resumed and may extend further weakness to 109.90-95 (50% Fibonacci retracement of 101.19-118.66) but downside should be limited to 109.50 and 109.00 should hold on first testing, price should stay well above 107.85-90 (61.8% Fibonacci retracement), bring rebound later.
Our preferred count is that, triangle wave IV (with circle) ended at 101.45 and the circle wave V brought dollar down to the record low of 75.31 in 2011 and the subsequent rebound signal major correction has commenced with A leg ended at 84.19, followed by wave B at 77.14 and impulsive wave C is now unfolding (indicated upside target at 125.00 had been met) for gain towards 127.00 level. In the event dollar drops below support at 99.01, this would confirm medium term decline from 125.86 top (2015 high) has resumed for subsequent weakness to 98.00 and possibly 97.00.
Under this count, this wave C is unfolding as impulsive waves with (1) (2), 1 2 ended at 80.67, 79.07, 82.84 and 81.69 respectively, hence the extended wave 3 has ended at 103.74 and wave 4 correction of recent upmove should bring weakness to 92.57, then towards 90.88 but psychological support at 90.00 should limit downside and bring another rally later in wave 5, indicated target at 125.00 had been met and gain to 127.00 cannot be ruled out but reckon price would falter below 130.00.
On the upside, whilst initial recovery to 111.00-05 cannot be ruled out, reckon upside would be limited to 111.45-50 and bring another decline later. A daily close above 112.40-45 would suggest low is possibly formed, bring a stronger rebound to 112.90 but upside should be limited to 113.54 and bring another decline later.
Recommendation: Sell at 113.50 for 111.50 with stop above 114.50.
On the monthly chart, we have changed our preferred count that an impulsive wave is unfolding with major wave III with circle ended at 79.75, then followed by wave IV with circle and is labeled as a triangle with A: 147.64 (11 August, 1998), B: 101.25, C: 135.20, D: 101.67 and E leg ended at 124.14 to end the wave IV with circle. Hence, wave V with circle commenced from there and hit a record low of 75.31, however, the subsequent strong rebound signals this circle wave V has possibly ended there, hence gain to (indicated upside target at 122.00 and 125.00 had been met), the retreat from 125.86 suggests wave A of major correction has ended there and wave B correction back to 99.00, then 95.00 would be seen, however, reckon downside would be limited to 90.00, bring another rebound in wave C next year.
USD/CAD Forecast Mar. 27-31
The Canadian dollar showed some movement during the week, but ended the week unchanged. USD/CAD closed the week at 1.3347. This week's key event is GDP. Here is an outlook on the major market- movers and an updated technical analysis for USD/CAD.
In the US, Fed Chair Yellen missed the chance to boost the US dollar, as she sent out a dovish message after the rate hike. Unemployment Claims were unexpectedly weak, soaring to 261 thousand. Canada's Core Retail Sales jumped 1.7%, above expectations. However, CPI softened to 0.2%, matching the forecast.
Updates:
- Mar 27, 12:35: Murky markets and further Fed fallout - MM #139: The Ides of March continue echoing and echoing. We discuss further fallouts from the Fed and move to on markets,...
- Mar 27, 11:42: EURUSD, USDCAD and XAUUSD TA - March 27 2017: EURUSD intra-day analysis EURUSD (1.0845): EURUSD gapped higher on the open today above the resistance level of 1.0800. On...
- Mar 27, 0:17: The week ahead: Quarter ends with GDP reads and last-minute adjustments [Video]: The last week of March features the normal end-of-quarter adjustments. Which currencies will come out on top? The time-shift in...
USD/CAD daily graph with support and resistance lines on it.
BoC Governor Stephen Poloz Speech: Tuesday, 14:10. Poloz will deliver remarks at an event in Oshawa. The markets will be looking for clues regarding the central bank's future monetary policy.
RMPI: Thursday, 12:30. This index gauges inflation in the manufacturing sector. In January, the indicator softened to 1.7%, above expectations. In December, the index recorded a sharp gain of 6.5%.
GDP: Friday, 12:30. GDP is released on a monthly basis, In December, the economy expanded 0.3%, matching the forecast. The estimate for the January report remains at 0.3%.
USD/CAD Technical Analysis
USD/CAD opened the week at 1.3334 and dropped to a low of 1.3260, as support held firm at 1.3212. The pair then reversed directions and climbed to a high of 1.3409. USD/CAD closed the week at 1.3347.
Technical lines, from top to bottom
1.3782 has held in resistance since the start of February.
1.3648 was an important support level in February.
1.3551 is the next line of resistance.
1.3457 was a high point in September 2015.
1.3351 was tested in resistance and remains a weak line.
1.3212 is providing support. It was a cap in the second quarter of 2016.
1.3124 is the next support level.
1.3003 is protecting the symbolic 1.30 level.
1.2908 is the final support level for now.
I am bullish on USD/CAD
In the US, the Fed has sent clear signals that it is projecting two more rate hikes this year, disappointing the markets. President Trump failed to pass a key health care bill last week and remains embroiled in scandals, which could lessen risk appetite and hurt the Canadian dollar.
Trumps Road to 100 Days of Inaction Rattles Markets
Monday March 27: Five things the markets are talking about
Investors are questioning Trump's reflation trade now that the U.S healthcare reform bill failed to make it onto the 'floor' Friday.
Heightened political risk has the market worried that the GOP's failure to get Friday's bill across the finish line will inhibit other pro-business reform agenda items from the White House, namely tax reform and fiscal spending measures.
Risk aversion has the dollar printing four-month lows outright, global equities and yields extending Friday's slide and the go-to safe haven asset, gold, rallying more that $17 overnight.
Will this rift between Trump and GOP congressional leadership still widen? There is a very good chance of this happening making Trump a 'lame duck' in his first 100 days in the White house.
Note: Trump has promised to lower individual middle class taxes, while House leaders view tax reform as a catalyst for growth and could prioritize tax cuts for the top +1%.
Elsewhere, it's a heavy week on the data front. Japan releases its key monthly statistics for February including retail sales and household spending, unemployment, consumer prices and industrial production.
France and Germany post consumer-spending data. Both the U.K and U.S report final estimates of Q4 GDP, while U.K's PM Theresa May is expected to formally begin divorce proceedings and trigger Article 50 to begin two-years of negotiations on her country's exit from the E.U.
1. Global stocks stumble on U.S policy woes
Trump's failure on healthcare reform is raising questions about his ability to push through tax cuts and fiscal spending to boost the U.S economy.
In Japan, the Nikkei's share average fell -1.4% overnight, trading atop its six-week low, adding to last week's -1.3% loss, on pressure from a resurgent yen (¥111.19). The broader Topix was down -1.3%.
In Hong-Kong, China developers have dragged down HK shares after fresh property curbs, offsetting data showing strong profit growth for industrial companies early in the year. The Hang Seng index fell -0.7%, while the China Enterprises Index lost -1.1%.
In China, stocks slipped as tightening worries have offset strong industrial profits. The blue-chip CSI300 index fell -0.3%, while the Shanghai Composite Index shed -0.1%.
In Europe, equity indices are trading sharply lower. Banking stocks see red on the Eurostoxx, while commodity and mining stocks trading notably lower on the FTSE 100.
U.S stocks futures are to open deep in the red (-0.9%).
Indices: Stoxx50 -0.5% at 3,426, FTSE -0.8% at 7,280, DAX -0.8% at 11,967, CAC-40 -0.5% at 4,996, IBEX-35 -0.6% at 10,246, FTSE MIB -0.8% at 20,024, SMI -0.6 % at 8,561, S&P 500 Futures -0.9%
2. Liquid gold prices falter, hard gold prices rally
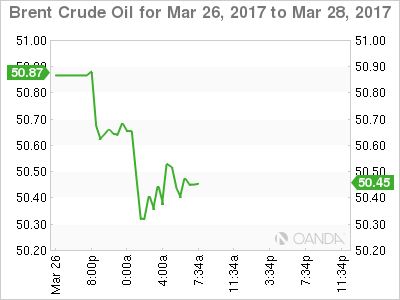
Oil prices start the week on the back foot, pressured by uncertainty over whether an OPEC-led production cut will be extended beyond June in an effort to counter the global glut of crude.
On the weekend, an OPEC and non-OPEC Joint Compliance Committee agreed to review whether oil output cuts should be extended by six-months. They stopped short of an earlier draft statement that said the committee recommended keeping the Nov. measure in place.
Also providing price pressures is the weekly Baker Hughes U.S Rig Count: 809 vs. 789, w/w (+2.5%) – the tenth consecutive weekly rise and the largest weekly increase since Jan.
Brent crude futures are down -19c at +$50.61, while West Texas Intermediate (WTI) is down -31c at +$47.66.
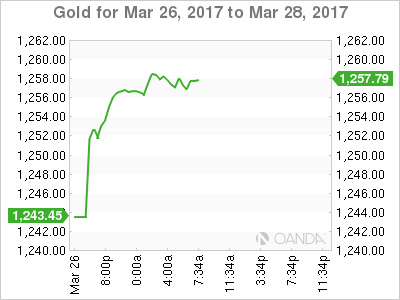
Gold has rallied more than +1% overnight, touching a one-month peak as the dollar plunges and stocks fall as POTUS suffered another setback, raising doubts about his ability to steer his economic agenda.
Spot gold has rallied to +$1,258 per ounce after hitting +$1,259.14, its highest since Feb. 27.
3. Global yields fall on questionable Trump
Borrowing costs across the globe have fallen sharply overnight, as investors question Trump's ability to push through tax cuts and fiscal spending to boost the U.S economy.
Bond yields in Germany (10-year Bunds +0.36%) and France (10-year OATS +0.93%) have fallen to their lowest levels in around three-weeks, while other single currency bloc yields tumbled -6 bps as U.S 10-year Treasury yields hit a one-month low (+2.35%).
Note: Since Nov. U.S election, expectations that a large fiscal stimulus from Trump's administration would help push up economic growth and inflation had boosted risk assets and dented safe-haven bonds in the U.S and Europe.
Elsewhere, Spanish yields fell to a one-month low at +1.64%, while Portugal's fell to more than two-month lows at +3.79%. Down-under, the yield on 10-year Aussie bonds slid -4 bps to +2.71%.
4. Fear of Trumponomics hammers dollar
The "mighty" dollar remains on the back foot against its G10 peers due to rising doubts about Trumponomics.
In overnight trade, the EUR/USD has gained +0.7% to a five-month high €1.0875. Also helping the 'single' unit Euro was Chancellor Merkel's CDU weekend victory in a local election in the German state of Saarland. Also providing support was Germany's IFO survey (see below) for March printing a seven-year high.
Note: The election weakened hopes that the SPD and its new leader Schulz would be aiming for easy victories in the upcoming state elections of North-Rhine Westphalia and Schleswig Holstein ahead of the German General Election in September.
Elsewhere, the pound has jumped +0.8% to its highest print in nearly two- months at £1.2581. USD/JPY has also dropped more than -1% to a four-month low ¥110.14. "
Expect North America to play catch up, especially now that long dollar' trades are currently seen unwinding in both the Asia and the European session.
5. Germany's Mar IFO Business Climate near 7-year highs
Data in Germany this morning indicates that business morale is high, which suggests that company executives in Europe's largest economy are brushing off concerns about the threat of rising protectionism and Germany's own election issues.
Ifo business climate index rose to 112.3 from an upwardly revised reading of 111.1 in Feb. The rise was driven by improved sentiment in manufacturing, construction and retailing, while the business climate in wholesaling deteriorated.
Note: Today's release follows Friday's PMI print that showed Germany's private sector growing at the fastest pace in nearly six-years this month, driven mainly by strong demand for manufactured goods from the U.S, China, U.K, and the Middle East.
Trade Idea Update: USD/CHF – Sell at 0.9910
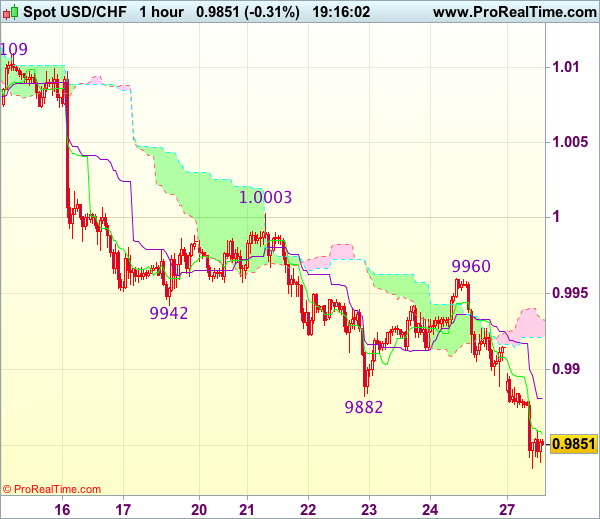
USD/CHF - 0.9850
Original strategy :
Sell at 0.9910, Target: 0.9800, Stop: 0.9945
Position : -
Target : -
Stop : -
New strategy :
Sell at 0.9910, Target: 0.9800, Stop: 0.9945
Position : -
Target : -
Stop : -
The greenback only recovered to 0.9960 on Friday before meeting renewed selling interest and the subsequent selloff below previous support at 0.9861 adds credence to our bearish view that recent decline is still in progress and may extend weakness to 0.9820-25, then 0.9800, however, loss of downward momentum should prevent sharp fall below 0.9770-75 (100% projection of 1.0171-0.9942 measuring from 1.0003), bring rebound later.
In view of this, would not chase this fall here and we are looking to sell dollar on subsequent rebound as 0.9900-10 should limit upside. Only above said resistance at 0.9960 would abort and signal low is formed, bring retracement of recent decline towards indicated previous resistance at 1.0003.
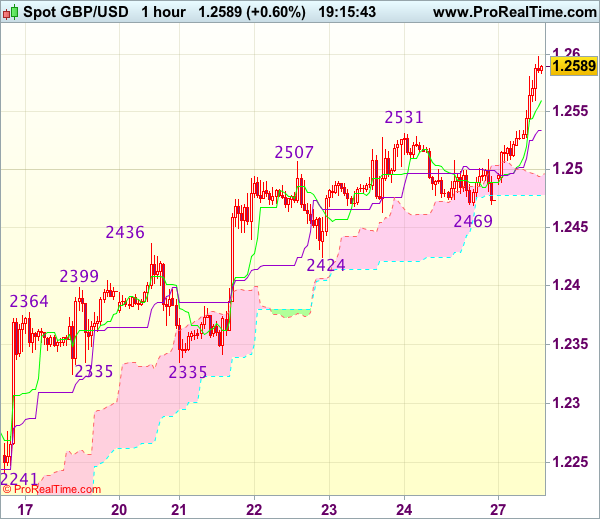
Trade Idea Update: GBP/USD – Buy at 1.2490
GBP/USD - 1.2590
Original strategy :
Buy at 1.2490, Target: 1.2600, Stop: 1.2455
Position : -
Target : -
Stop : -
New strategy :
Buy at 1.2490, Target: 1.2600, Stop: 1.2455
Position : -
Target : -
Stop : -
As cable has surged again today, adding credence to our bullish view that recent upmove from 1.2109 is still in progress and upside bias remains for this move to extend further gain to 1.2600, then towards 1.2635-40, however, loss of upward momentum should prevent sharp move beyond 1.2670-80 and price should falter below previous resistance at 1.2706, risk from there is seen for a retreat later.
In view of this, would not chase this rise here and would be prudent to buy cable on subsequent retreat. Only below support at 1.2469 (Friday’s low) would abort and signal top is formed, bring retracement of recent upmove towards previous support at 1.2424 which is likely to hold from here.
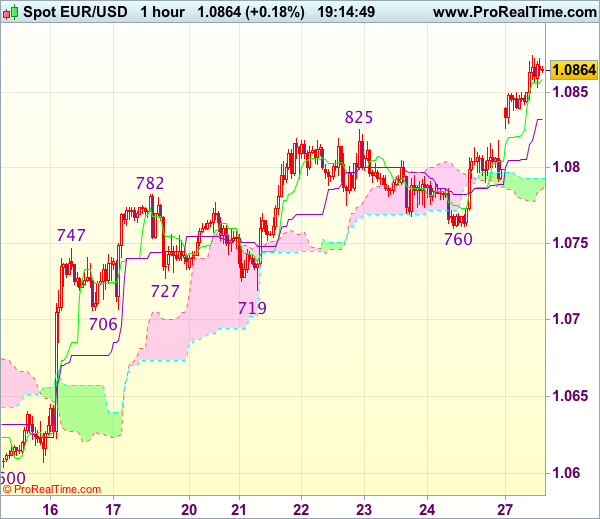
Trade Idea Update: EUR/USD – Buy at 1.0800
EUR/USD - 1.0867
Original strategy :
Buy at 1.0800, Target: 1.0900, Stop: 1.0765
Position : -
Target : -
Stop : -
New strategy :
Buy at 1.0800, Target: 1.0900, Stop: 1.0765
Position : -
Target : -
Stop : -
The single currency also opened higher today on dollar’s broad-based weakness and the the subsequent rally signals recent upmove is still in progress, hence bullishness remains for further gain to 1.0900 and possibly 1.0930-35 (61.8% Fibonacci retracement of 1.1300-1.0340), however, loss of near term upward momentum should prevent sharp move beyond 1.0955-60 and price should falter below 1.0990-00, risk from there has increased for a retreat to take place later.
In view of this, would not chase this rise here and we are looking to buy euro on subsequent pullback as 1.0800-10 should limit downside. Only below support at 1.0760 would abort and signal top is formed, bring retracement of recent upmove to 1.0730 but 1.0719 support should remain intact.
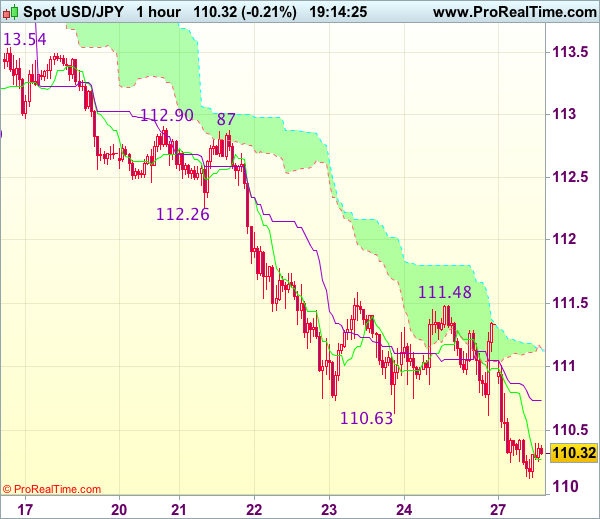
Trade Idea : USD/JPY – Sell at 111.00
USD/JPY - 110.26
Original strategy :
Sell at 111.00, Target: 110.00, Stop: 111.35
Position : -
Target : -
Stop : -
New strategy :
Sell at 111.00, Target: 110.00, Stop: 111.35
Position : -
Target : -
Stop : -
The greenback opened lower earlier today and has dropped again, adding credence to our bearish view that recent selloff is still in progress and may extend weakness to 110.00, however, loss of downward momentum should prevent sharp fall below 109.70-75 and reckon 109.50 would hold from here, risk from there has increased for a rebound to take place later.
In view of this, would not chase this fall here and would be prudent to sell dollar on recovery as 111.00 should limit upside. Above 111.30-35 would risk test of resistance at 111.48 but break there is needed to signal low is formed instead, bring retracement of recent decline to 111.75-80 first.
Trade Idea: EUR/JPY – Stand aside
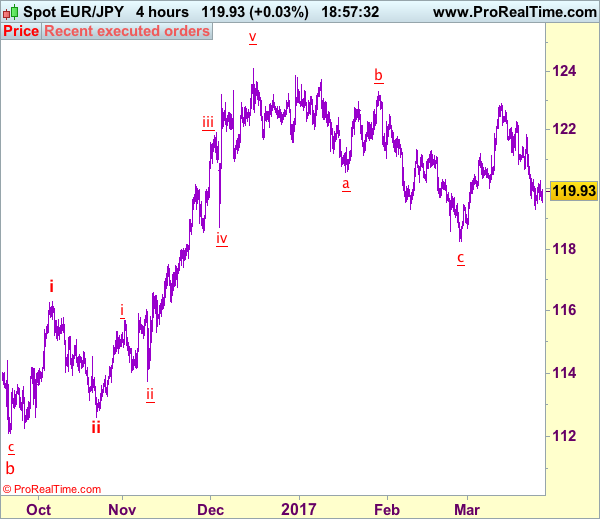
EUR/JPY - 119.91
Recent wave: wave v of (C) ended at 94.12 and major correction in wave A has ended at 149.79
Trend: Near term up
New strategy :
Stand aside
Position: -
Target: -
Stop:-
Although the single currency retreated after meeting resistance at 120.28, break of last week’s low at 119.32 is needed to signal the fall from 122.89 top is still in progress and may extend weakness to 119.00, then 118.67 support but loss of momentum should prevent sharp fall below latter level and price should stay well above previous chart support at 118.25, risk from there is seen for a rebound later.
In view of this, would not chase this fall here and would be prudent to stand aside in the meantime. If said support at 119.32 continues to hold, then further consolidation would take place and another bounce to 120.28 cannot be ruled out, above there would bring retracement of recent decline to 120.60-70, then 121.15-20. Only break of said resistance at 121.84 would revive bullishness and suggest low is formed instead, bring test of indicated resistance at 122.26 first.
Our latest preferred count is that wave (ii) is ABC-X-ABC which ended at 123.33 and wave (iii) is unfolding with wave iii ended at 100.77, followed by wave iv at 111.57 and wave v as well as the wave (iii) has ended at 97.04, followed by wave (iv) at 111.43 and wave (v) has ended at 94.12 which is also the end of the larger degree v, this also implied the major wave (C) has also ended there, hence major correction has commenced from there with (A) leg unfolding in its lower degree wave c which has possibly ended at 145.69. Under this count, A-B-C wave (B) has commenced with A leg ended at 136.23, wave B at 143.79 and wave C has possibly ended at 149.79.
Our larger degree count is that the decline from 139.26 is wave (C) and is sub-divided into a diagonal triangle i-ii-iii-iv-v with wave i - 105.44, wave ii- 123.33, wave iii - 97.03, wave iv - 111.43, followed by the final wave v as well as the end of wave (C) at 94.12, this also mark the bottom of larger degree wave B. Under this count, major rise in wave C has commenced as an impulsive wave with minor wave III ended at 145.69, wave V is still in progress for further gain to 150.00. Having said that, this so-called wave V could well be the first leg of larger degree 5-waver wave C and this wave C should bring at least a retest of wave A top at 169.97 (July 2008).