Sample Category Title
Trump Slump Triggers Monday Blues
A tidal wave of risk aversion has flooded the financial markets on Monday with global stocks under intense selling pressure after Donald Trump's failure on healthcare reforms sparked concerns about his ability to move ahead with tax cuts and fiscal spending. Asian shares were mostly in the red amid the rising Trump jitters with European equities descending deeper into the abyss as participants scattered away from riskier assets to safe-haven investments. With the reflation trade receiving a heavy blow and uncertainty mounting over Donald Trump's economic policies, Wall Street could be left vulnerable to further losses. The growing threat of Donald Trump's market shaking promises on tax cuts and fiscal spending falling short of market expectations has left investors on edge with risk-off becoming a major theme.
Dollar pressuredas Trump trade fade
The Dollar has found itself under renewed selling pressure on Monday as concerns mount over Donald Trump's ability to push through tax cuts and fiscal spending to elevate the US economy. Last week's defeat to the healthcare bill has raised questions over the longevity of the Trump trade with sellers exploiting the renewed uncertainty to attack the Greenback further. Although the Dollar may remain supported in the longer term amid the improving confidence towards the US economy, the growing uncertainty over Donald Trump's economic policy has left bears in firm control in the short term. Further Dollar weakness may be expected with the lingering effect of the Fed's cautious attitude potentially capping upside gains. From a technical standpoint, the Dollar Index remains under pressure on the daily charts with the breakdown below 99.50 opening a path lower towards 99.00.
Sterling elevated by Dollar weakness
Sterling was uplifted higher during Monday's trading session and this had nothing to do with a change of sentiment towards the vulnerable Pound but Dollar weakness. Despite the gains the Sterling has displayed this quarter, the uncertainty of Brexit may ensure weakness remains a recurrent market theme in the longer term with bears on standby to exploit the technical bounce to attack prices lower. While the recent CPI and retail sales report have somewhat boosted sentiment towards Sterling, investors should be under no illusion that the bearish bias has changed. With further weakness expected as the Brexit negations get under way this week, the current technical bounce on the GBPUSD could come to an abrupt end.
Commodity spotlight – Gold
The renewed concerns over protectionism, Brexit unknowns and Trump jitters have boosted Gold's allure with the metal on route to concluding the quarter as a winner. Uncertainty is rapidly rising over Trump's economic policies and this has caused investors to depart from riskier assets to safe-haven investments such as the Yen and Gold. With the live threat of Trump's highly anticipated pro-growth policies falling below market expectations, risk-off may become the name of the game consequently uplifting Gold further. From a technical standpoint, Gold is turning increasingly bullish on the daily charts with a breakout above $1260 potentially opening a path higher towards $1260.
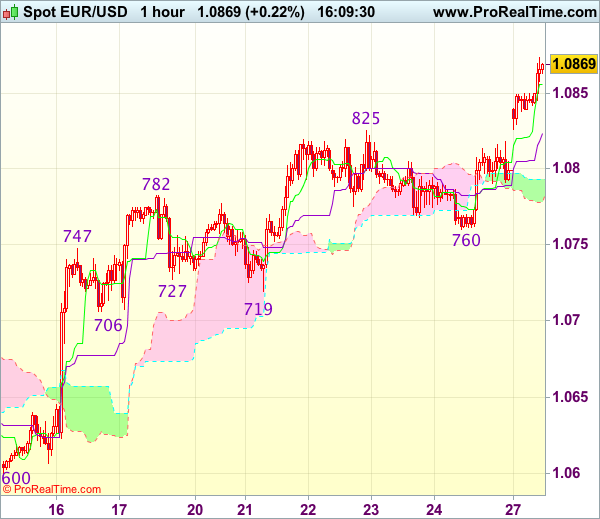
EUR/USD – Strong German Business Climate Sends Euro To 14-Week High
EUR/USD has edged higher on Monday, as the pair trades at 1.0860. On the release front, German Ifo Business Climate climbed to 112.3, above the forecast of 111.2 points. In the US, there are no economic indicators, but we’ll hear from two FOMC members – Charles Evans and Robert Kaplan. On Tuesday, the US releases CB Consumer Confidence.
The week has started on a bright note in Europe. German Ifo Business Climate rose to 112. 3 points, its highest level since July 2011. The release underscores high optimism in the business sector, despite rumblings of protectionism from the US and the uncertainty over Brexit. Germany, the largest economy in Europe, continues to post strong numbers, which has been good news for the eurozone economy. Last week’s PMIs pointed to expansion in the manufacturing and service sectors. German and eurozone Manufacturing PMIs both beat their estimates and hit their highest levels since 2011. The markets are keeping a close eye on Germany, which later this week releases CPI, retail sales and unemployment claims. One soft spot in the economy, however, is consumer confidence. GfK German Consumer Climate lost ground for a second straight month, as the indicator dropped to 9.8 in March, its lowest level since November 2016. Eurozone Consumer Confidence remains weak, as the indicator posted a decline of -5 in March, almost unchanged from a month earlier. These soft numbers are largely a result of higher inflation, as consumers are concerned about their reduced purchasing power.
The market euphoria over President Trump’s upset election win is long past. The inquiry into the Trump administration’s links with Russia continues to make headlines, and is another cause for concern for nervous investors. Trump has been in office for over two months, but he has yet to provide any details over even an outline of economic policy. Last week, Trump’s proposed bill to change Obamacare was not even voted on, as the White House could not garner enough support to pass the bill. This debacle will only increase market uneasiness over Trump, and could send the dollar downwards even further.
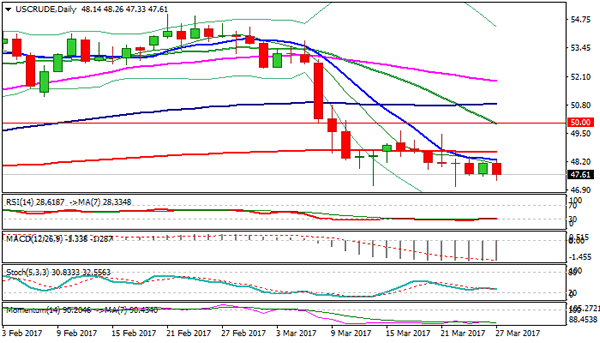
WTI Oil Is Under Renewed Pressure On OPEC/Negative Technicals
Oil price is under pressure on Monday, as renewed weakness erased all gains made on Friday. Overall sentiment remains negative, as OPEC and non-OPEC oil producers on meeting during the weekend failed to give clearer information whether agreed production cut will extend in next six months.
Oil price dipped to session low at 47.33 on Monday, putting recent spike lows at $47.08/06 under increased pressure.
Oil is holding in consolidation phase since mid-March, with upside attempts being rejected under psychological $50.00 barrier and subsequent weakness turned focus lower, signaling that negative sentiment persists.
Final close below $47.17 (Fibo 61.8% of $42.19/$55.22 rally) is needed to generate fresh signal of bearish continuation that also requires firm break below $47.08/06 base, to open way towards $46.23 (top of thick weekly Ichimoku cloud).
Broken daily Tenkan-sen that capped recent congestion offers solid resistance at $48.34 and together with broken 200SMA ($48.66) is expected to limit upside attempts.
Res: 47.74, 48.34, 48.66, 49.46
Sup: 47.33, 47.17, 47.08, 46.23
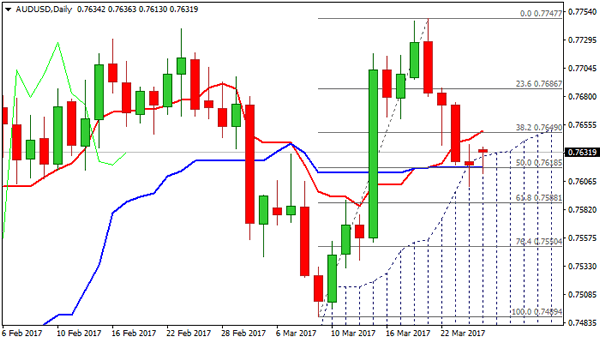
AUDUSD – Rising Daily Cloud Holds Pullback For Now
Pullback from 0.7747 peak is holding above rising daily cloud for now, as Friday's probe below cloud top was short-lived and closed at cloud top. Also, trading on Friday ended in tight Doji, signaling that bears off 0.7747 peak may be running out of steam.
The price action today is mainly holding above thickening daily cloud (cloud top lies at 0.7628 today) and repeated close above it would generate initial bullish signal.
Reversal scenario requires sustained break above daily Tenkan-sen line (currently at 0.7650 and near Fibo 38.2% of 0.7747/0.7602 pullback) to ease persisting bearish pressure and generate stronger bullish signal.
Conversely, close below daily cloud would risk fresh extension towards 0.7588 (Fibo 61.8% of 0.7489/0.7747 rally) and expose 200SMA (0.7543).
Res: 0.7641, 0.7650, 0.7692, 0.7717
Sup: 0.7628, 0.7602, 0.7588, 0.7543
USD/JPY Candlesticks and Ichimoku Analysis
Weekly
• Last Candlesticks pattern: Hanging man
• Time of formation: 22 May 2016
• Trend bias: Down
Daily
• Last Candlesticks pattern: Shooting star
• Time of formation: 15 Feb 2017
• Trend bias: Down
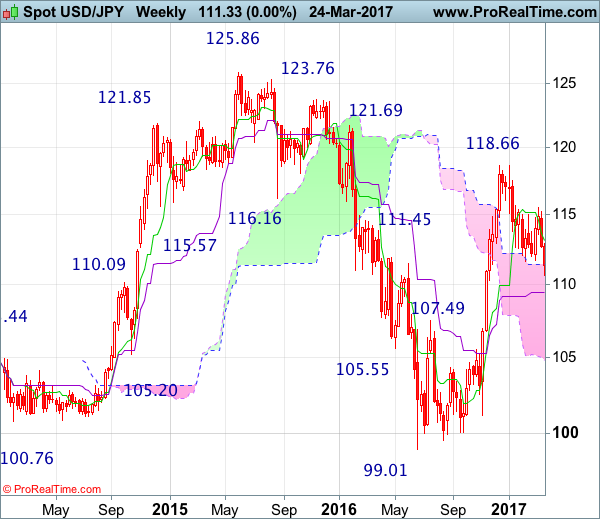
USD/JPY – 110.35
The greenback continued heading south after last week’s initial brief recovery to 112.90, adding credence to our bearish view that the erratic decline from 118.66 top is still in progress and may extend weakness to 109.90-95 (50% Fibonacci retracement of 101.19-118.66), then 109.50, however, reckon downside would be limited to 109.00 and previous support at 108.55 should hold from here, price should stay well above dynamic support at 107.85-90 (61.8% Fibonacci retracement of 101.19-118.66) and bring rebound later.
On the upside, whilst recovery to 110.90-00 cannot be ruled out, reckon resistance at 111.48 (Friday’s high) would limit upside and bring another decline later. Above 111.90-00 would defer but only break of resistance at 112.26 (previous support) would abort and suggest low is possibly formed, risk a stronger rebound to indicated resistance at 112.90 but a daily close above there is needed to add credence to this view, then subsequent rise to 113.54 resistance would follow.
Recommendation : Sell at 111.50 for 109.50 with stop above 112.50.
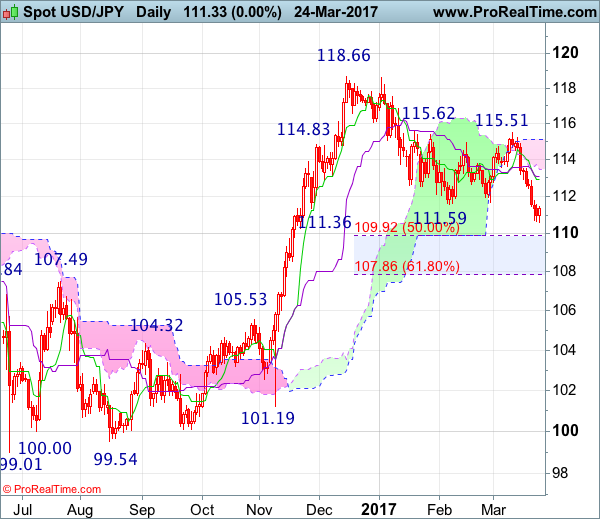
On the weekly chart, the greenback opened lower this week after last week’s selloff below previous support at 111.59, adding credence to our view that top has been formed at 118.66 earlier and the decline from there is still in progress for retracement of recent upmove to 109.90-95 (current level of the Kijun-Sen and 50% Fibonacci retracement of 101.19-118.66), then 109.00 but reckon support at 108.55 would limit downside and price should stay above 107.85-90 (61.8% Fibonacci retracement), risk from there is seen for a rebound later.
On the upside, although initial recovery to 110.90-00 is likely reckon resistance at 111.48 (Friday’s high) would attract renewed selling interest and bring another decline later. Above previous support at 112.26 (now resistance) would defer and suggest a temporary low is formed, bring test of the Tenkan-Sen (now at 112.82), a weekly close above there would add credence to this view, then further gain to 113.54 resistance would follow.
Trump’s Failure To Repeal Obamacare Sends USD Lower
News and Events:
Is it time to run?
Over the last few weeks, Donald Trump was much quieter - especially compared to what we were used to - as its administration was gearing up for one of its key battle: repealing Obamacare. Well, it already had a bad start last week as the vote was delayed from Thursday to Friday as the Republican Party was facing division within its own rank. Investors were already suspicious as we were heading into the weekend: equities were trading sideways, the dollar and US treasury yields were going nowhere. This is now a fact, Trump has failed its very first test and forced investors to consider whether this is just a temporary setback or the start of a routine.
Looking at the equity markets this morning, investors have started to unwind Trump reflation trade on growing doubt about the government’s ability to deliver what has been promised. The Nikkei was off 1.44% and the Hang Seng slid 0.68%. US futures also dipped in negative territory with contracts on the S&P falling 0.85%. In Europe, the Euro Stoxx 600 fell 0.80% as the German DAX tumbled 0.82%.
In the coming weeks, the US political uncertainty will remain the primary driver and will weigh on the dollar and equities as investors lower their expectation for policy action. The failure to pass the healthcare reform has diminished Trump’s flexibility to pass other reform as it will be more difficult to reach a balanced budget, especially when all the other proposed reforms are project to increase expenditure.
French Elections: Uncertainties endure
It goes without saying that the French elections could have monumental repercussions for Europe, with a victory for Marine Le Pen paving the way for a Frexit Referendum. Over the weekend, the National Front President visited Vladimir Putin with many politicians, such as Jean-Luc Mélenchon strongly condemning the move. Rumours are now circulating that Russian banks are helping Le Pen to finance her campaign, a claim she vehemently rejects. Yet, in terms of international sanctions, the National Front leader continues to fight Russia’s corner.
Yes, a Le Pen election does bear all the potential of being the proverbial nail in the coffin for the single currency. However, if Brexit has taught us anything it’s that we cannot say for sure that a French exit from the EU would be a nightmare. There is a cost to exiting the union, but there is also a cost to remain.
However, for now, euro valuation and financial markets are pricing in a victory for Emmanuel Macron against Le Pen. We think it’s still too early to call a two-horse race, especially as François Fillon’s candidacy is far from over.
Article 50 this week
The wait might finally be over, with politics taking center stage in Europe. On Thursday, 29th March, Prime Minister May is likely to trigger Article 50. Once the Brexit clause is enacted, there is no way back - the UK and EU will have to begin what is likely to become a two-year (possible longer) dragged out negotiation. The immediate question is “how will the GBP react”? Outside of a natural GBP risk aversion pullback, we suspect that the GBP will continue to rally against the USD and EUR. The massive GBP devaluation on the Brexit vote and shortest G10 position in IMM data will protect the sterling from a deeper correction, while the resilient economic data and surprisingly hawkish MPC minutes will have markets increasingly pricing in a BoE rate hike. The unexpectedly hawkish tone will provide a solid backstop for selling and initiate a rebound in GBP. GBPUSD bullish recovery of 1.2110 support should continue targeting 200d MA at 1.2755.
Today's Key Issues (time in GMT):
- mars.24 Domestic Sight Deposits CHF, last 470.9b CHF / 08:00
- Mar IFO Business Climate, exp 111,1, last 111, rev 111,1 EUR / 08:00
- Mar IFO Expectations, exp 104,3, last 104, rev 104,2 EUR / 08:00
- Mar IFO Current Assessment, exp 118,3, last 118,4 EUR / 08:00
- ECB’s Single Supervisory Mechanism Holds Annual Conference EUR / 08:30
- Mar FGV Consumer Confidence, last 81,8 BRL / 11:00
- Central Bank Weekly Economists Survey (Table) BRL / 11:25
- Mar Real Sector Confidence SA, exp 104, last 106,5 TRY / 11:30
- Mar Real Sector Confidence NSA, exp 103, last 105,3 TRY / 11:30
- Mar Capacity Utilization, exp 75,30%, last 75,40% TRY / 11:30
- ECB's Peter Praet Speaks in Madrid EUR / 12:00
- mars.24 Bloomberg Nanos Confidence, last 59,2 CAD / 14:00
- Mar Dallas Fed Manf. Activity, exp 22, last 24,5 USD / 14:30
- Chicago Fed's Evans, ECB's Praet Speak in Madrid EUR / 16:45
- Fed's Evans Speaks on Economy and Policy in Madrid USD / 17:15
- ECB's Praet takes part in panel discussion in Madrid EUR / 17:15
- mars.26 Trade Balance Weekly, last $1437m BRL / 18:00
- Feb Tax Collections, exp 93000m, last 137392m BRL / 22:00
The Risk Today:
EUR/USD keeps on pushing higher towards key resistance given at a distance 1.0874 (08/12/2017 high). Strong support can be found at 1.0493 (22/02/2017 low). Expected to show continued increase. In the longer term, the death cross late October indicated a further bearish bias. The pair has broken key support given at 1.0458 (16/03/2015 low). Key resistance holds at 1.1714 (24/08/2015 high). Expected to head towards parity.
GBP/USD now lies in a short-term uptrend channel. There are rooms for further strength. Hourly resistance is located at 1.2570 (24/02/2017 high). Hourly support is given at 1.2324 (03/17/2017 low). Expected to show continued strength. The long-term technical pattern is even more negative since the Brexit vote has paved the way for further decline. Long-term support given at 1.0520 (01/03/85) represents a decent target. Long-term resistance is given at 1.5018 (24/06/2015) and would indicate a long-term reversal in the negative trend. Yet, it is very unlikely at the moment.
USD/JPY continues its declined since the pair has failed to break key resistance given at 115.62 (19/01/2016 high). The pair is heading lower. Hourly resistance can be located at 113.57 (16/03/2017 high). We favor a long-term bearish bias. Support is now given at 96.57 (10/08/2013 low). A gradual rise towards the major resistance at 135.15 (01/02/2002 high) seems absolutely unlikely. Expected to decline further support at 93.79 (13/06/2013 low).
USD/CHF is declining. Hourly support is given at 0.9862 (31/01/2017 low). Key resistance can be found at a distance at 1.0344 (15/12/2016 high). Expected to show continued weakness. In the long-term, the pair is still trading in range since 2011 despite some turmoil when the SNB unpegged the CHF. Key support can be found 0.8986 (30/01/2015 low). The technical structure favours nonetheless a long term bullish bias since the unpeg in January 2015.
| EURUSD | GBPUSD | USDCHF | USDJPY |
| 1.1300 | 1.3445 | 1.0652 | 121.69 |
| 1.0954 | 1.3121 | 1.0344 | 118.66 |
| 1.0874 | 1.2771 | 1.0171 | 115.62 |
| 1.0857 | 1.2566 | 0.9857 | 110.32 |
| 1.0454 | 1.1986 | 0.9550 | 106.57 |
| 1.0341 | 1.1841 | 0.9444 | 106.04 |
| 1.0000 | 1.0520 | 0.9259 | 101.20 |
Investors Trade Short As Article 50 Looms
Short options against the Pound hit record levels following confirmation from Downing Street that Article 50 would be triggered March 29. Global award-winning forex broker, FXTM, has observed wide-spread negativity towards Sterling from its traders, with 95% of its clients trading short on the GBPUSD ahead of the historic event.
'The buying sentiment towards the British Sterling has been mostly negative since the outcome of the EU referendum, but the moves in the Pound over the past week have been unpredictable,' explains Jameel Ahmad, Vice-President of Corporate Development and Market Research at FXTM. 'While the main catalyst behind the rebounding Pound over the past week was attributed to Dollar weakness, most market participants still hold negative views on the GBP/USD and have been exploiting sell-on rally opportunities on the pair around the 1.25 region for some time.'
Opinions on the resilience of the Sterling are mixed, some analysts are justifying the recent highs as another corrective bounce, while others are charting the start of a sustained recovery. 'I personally still hold negative views on the British Pound. I will not be buying into the theory that this could be the start of a prolonged recovery until the GBPUSD manages to conclude trading on a weekly or monthly basis back above 1.32. This figure represents the historic low that was reached on the night of the EU referendum and will be used by traders as a psychological pivot to escape the overall bearish bias that has limited the GBPUSD to relief rallies since the second half of 2016.'Says Ahmad.
The current market confusionover the future direction of the Pound has been compounded by the lack of precedent and general uncertainty over Brexit itself. The UK is the first full member stateto leave the trading Bloc, and the provisions it will secure for key areas including trade, agriculture, and tourism remain largely unknown. The threat of a possible second Scottish Referendumfurther down the road, alongside any sudden turns towards a hard-Brexit, are likely to negatively influence the buying sentiment towards the Sterling.
Pending elections in France and Germany, and the wave of right-wing sentiment and Eurosceptism sweeping the continent, will also continue to influence the performance of the Sterling. Many analysts will be waiting until early May to release long-term predictions, which are likely to be decidedly more upbeat should the Nationalist Party triumph. Marine Le Pen will be forging a precedent for a future Frexit, which could increase the chances of a smoother deal for Theresa May as Le Pen pushes her own referendum agenda.
Given the current uncertainty, the Pound is unlikely to scale pre-July levels anytime soon. Brexit developments and the accompanying uncertainty will limit any serious upside, and the slightest sign of complications in negotiations will likely expose the currency to downside shocks. With the potential for future political uncertainty in Scotland, and Theresa May still needing to hold complex negotiations with her EU counterparts, it may continue to fall prey to the bears.
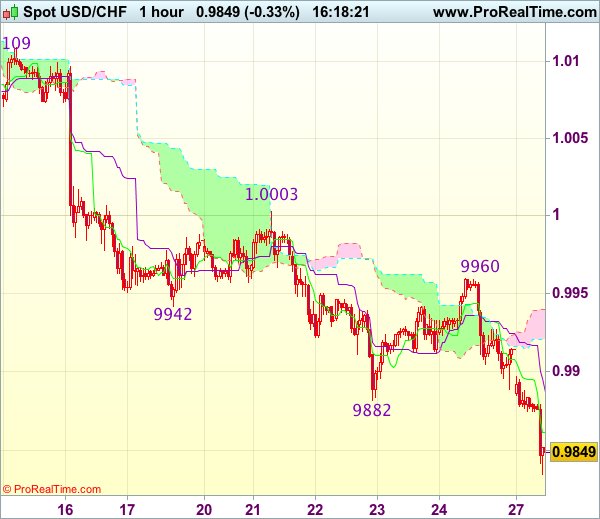
Trade Idea : USD/CHF – Sell at 0.9910
USD/CHF - 0.9858
Most recent candlesticks pattern : N/A
Trend : Near term down
Tenkan-Sen level : 0.9860
Kijun-Sen level : 0.9881
Ichimoku cloud top : 0.9936
Ichimoku cloud bottom : 0.9921
Original strategy :
Sell at 1.0000, Target: 0.9900, Stop: 1.0035
Position : -
Target : -
Stop : -
New strategy :
Sell at 0.9910, Target: 0.9800, Stop: 0.9945
Position : -
Target : -
Stop : -
The greenback only recovered to 0.9960 on Friday before meeting renewed selling interest and the subsequent selloff below previous support at 0.9861 adds credence to our bearish view that recent decline is still in progress and may extend weakness to 0.9820-25, then 0.9800, however, loss of downward momentum should prevent sharp fall below 0.9770-75 (100% projection of 1.0171-0.9942 measuring from 1.0003), bring rebound later.
In view of this, would not chase this fall here and we are looking to sell dollar on subsequent rebound as 0.9900-10 should limit upside. Only above said resistance at 0.9960 would abort and signal low is formed, bring retracement of recent decline towards indicated previous resistance at 1.0003.
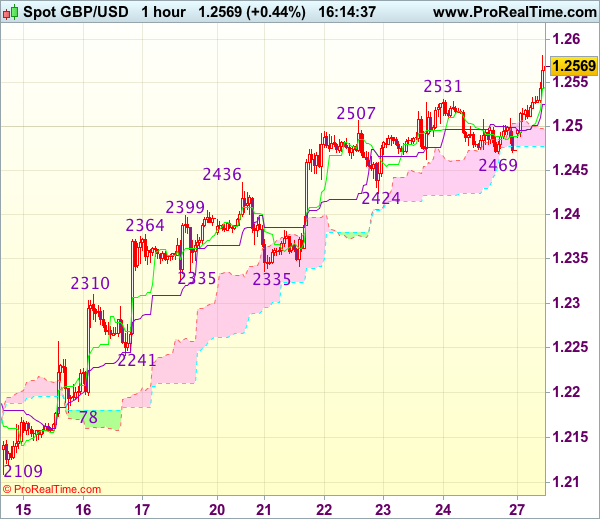
Trade Idea : GBP/USD – Buy at 1.2490
GBP/USD - 1.2568
Most recent candlesticks pattern : N/A
Trend : Near term up
Tenkan-Sen level : 1.2545
Kijun-Sen level : 1.2525
Ichimoku cloud top : 1.2497
Ichimoku cloud bottom : 1.2478
New strategy :
Buy at 1.2490, Target: 1.2600, Stop: 1.2455
Position : -
Target : -
Stop : -
As cable has surged again today, adding credence to our bullish view that recent upmove from 1.2109 is still in progress and upside bias remains for this move to extend further gain to 1.2600, then towards 1.2635-40, however, loss of upward momentum should prevent sharp move beyond 1.2670-80 and price should falter below previous resistance at 1.2706, risk from there is seen for a retreat later.
In view of this, would not chase this rise here and would be prudent to buy cable on subsequent retreat. Only below support at 1.2469 (Friday’s low) would abort and signal top is formed, bring retracement of recent upmove towards previous support at 1.2424 which is likely to hold from here.
Trade Idea : EUR/USD – Buy at 1.0800
EUR/USD - 1.0866
Most recent candlesticks pattern : N/A
Trend : Near term up
Tenkan-Sen level : 1.0856
Kijun-Sen level : 1.0823
Ichimoku cloud top : 1.0793
Ichimoku cloud bottom : 1.0778
Original strategy :
Buy at 1.0720, Target: 1.0820, Stop: 1.0685
Position : -
Target : -
Stop : -
New strategy :
Buy at 1.0800, Target: 1.0900, Stop: 1.0765
Position : -
Target : -
Stop : -
The single currency also opened higher today on dollar’s broad-based weakness and the the subsequent rally signals recent upmove is still in progress, hence bullishness remains for further gain to 1.0900 and possibly 1.0930-35 (61.8% Fibonacci retracement of 1.1300-1.0340), however, loss of near term upward momentum should prevent sharp move beyond 1.0955-60 and price should falter below 1.0990-00, risk from there has increased for a retreat to take place later.
In view of this, would not chase this rise here and we are looking to buy euro on subsequent pullback as 1.0800-10 should limit downside. Only below support at 1.0760 would abort and signal top is formed, bring retracement of recent upmove to 1.0730 but 1.0719 support should remain intact.