Sample Category Title
Gold Jumps On Monday
'Looks like some people are not happy with Trump's failure over his promises and we see that currently there is a very bearish mood about the U.S. dollar.' – Jiang Shu, Shandong Gold Group (based on Reuters)
Pair's Outlook
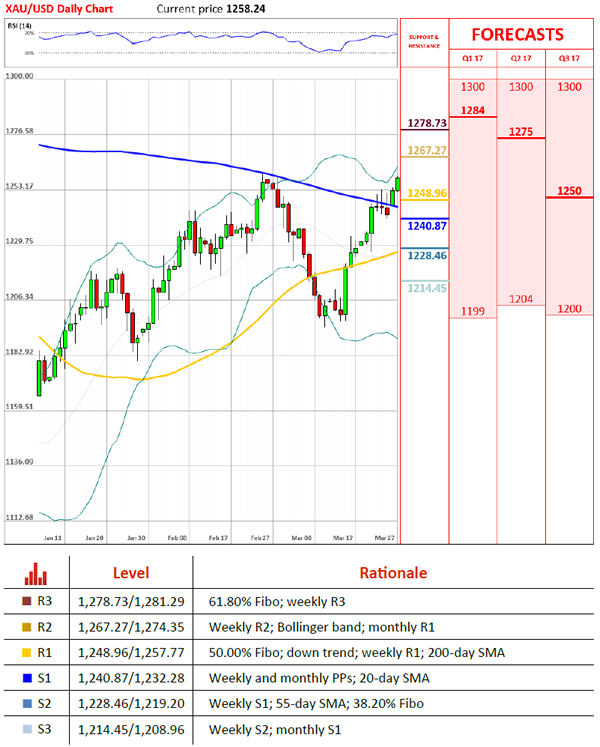
Not only has the yellow metal begun Monday's trading session more than 400 base points higher than the previous closing price, but also it has managed to surge additional 1250 points during the early hours of the trading session. Moreover, recently the bullion began to pass the resistance put up by the 200-day SMA, which was located at the 1,257.98 level. If that level is passed, the commodity price is most likely going to continue the surge up to the weekly R2, which is located at the 1,267.28 level.
Traders' Sentiment
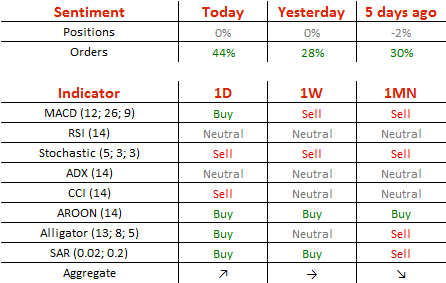
SWFX trader open positions remain neutral, regarding the bullion. However, 72% of trader set up orders are to buy the yellow metal.
Forex Technical Analysis
EUR/USD
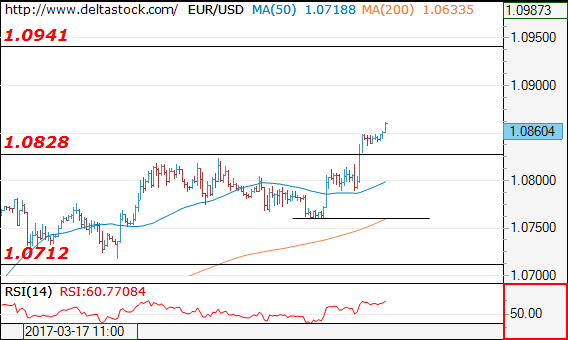
Current level - 10860
My outlook remains bullish, for a rise towards 1.0940 area. Initial intraday support lies at 1.0828 and crucial on the downside is 1.0760 low.
| Resistance | Support | ||
| intraday | intraweek | intraday | intraweek |
| 1.0870 | 1.0940 | 1.0828 | 1.0712 |
| 1.0940 | 1.1010 | 1.0760 | 1.0600 |
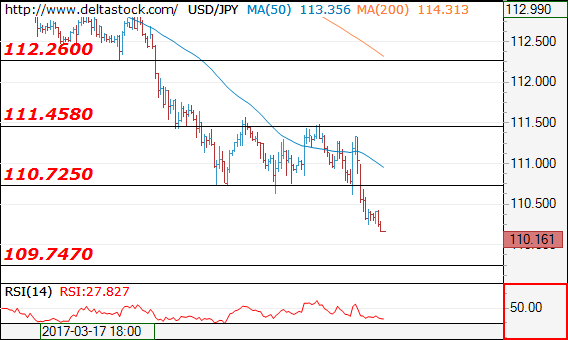
USD/JPY
Current level - 110.16
110.75 and crucial on the upside is 111.45 area.
| Resistance | Support | ||
| intraday | intraweek | intraday | intraweek |
| 110.75 | 113.50 | 109.75 | 109.75 |
| 111.45 | 115.65 | 108.50 | 107.80 |
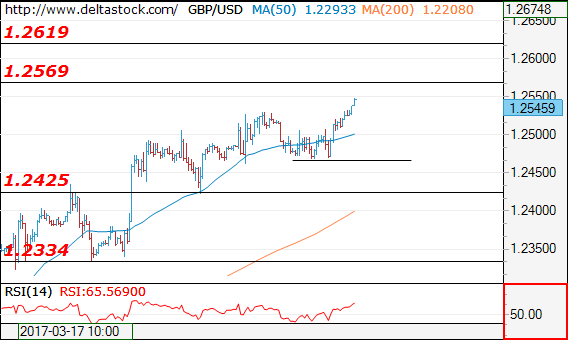
GBP/USD
Current level - 1.2545
The uptrend here is intact, heading towards 1.2570, en route to 1.2620 resistance zone. Crucial on the downside is 1.2470 low.
| Resistance | Support | ||
| intraday | intraweek | intraday | intraweek |
| 1.2570 | 1.2570 | 1.2470 | 1.2107 |
| 1.2620 | 1.2705 | 1.2335 | 1.1984 |
EURUSD – 200SMA Barrier Pressured On Strong Bullish Acceleration
The Euro is in strong bullish acceleration on Monday as the dollar was hit by increased political risk concerns after Trump's efforts to reform healthcare failed and focus turned towards economic plans for tax cuts and spending.
The pair opened with gap-higher on Monday and subsequent rally is pressuring targets at 1.0872 / 79 (08 Dec spike high / 200SMA).
Strong bullish momentum is likely to drive the price higher, as the pair closed for the fourth straight week in strong bullish mode, amid dollar-negative sentiments and growing hopes that far-right anti-EU candidate will be defeated in French presidential elections.
Price action may show hesitation at 200SMA barrier, as near-term studies are strongly overbought, however, dip-buying strategy remains favored.
Session low at 1.0821, reinforced by broken weekly Kijun-sen, is required to contain dips to keep today's gap intact.
Sustained break above 200SMA would unlock psychological 1.1000 barrier and 1.1067 (weekly cloud base) in extension.
Conversely, loss of 1.0820/00 zone would risk deeper pullback and expose next pivots at 1.0759 (Friday's low) and 1.0736 (daily Tenkan-sen).
Res: 1.0879, 1.0931, 1.0950, 1.1000
Sup: 1.0837, 1.0821, 1.0800, 1.0759
Asia Stock’s Looking Shaken But Not Stirred
Asia stock indices are looking a little shaky today as the fallout from Friday's healthcare debacle in the U.S. reverberates across the region.
In all honesty, it could have been worse after President Trump threw in the towel on health care reform and decided to move on. Perhaps the legacy of the nature of Mr.Trump's win last year is coming back to haunt him. Having upstaged the establishment choices and crashed the party, he did not ever have the chance to build a meaningful power base of alliances across the Houses of Congress, despite both of them also swinging to Republican majorities.
That said he might have played a sublime blinder against the aforementioned parts of his very fractured party. By effectively sending them all to the naughty corners for not being able to share the toys, and moving on to tax reform instead of health, he is effectively putting the onus on the Senate and House of Representatives to get their act together. In pushing forward to the next items on his agenda, he is effectively saying it all won't fail because of me and nor will I be blamed. Perversely, therefore, he may actually find Congress much more cooperative going forward.
This realisation may be why the fallout has not continued with as much impetus in Asia today as it did Friday. Stocks are lower following on, and bond yields have dropped. The U.S. Dollar gapped lower on the open this morning and has stayed heavy against the G.10's and regionals, but has yet to make another serious leg lower in the short term. Asia stocks have been negative but not much so. Nevertheless, most indices are trading towards the lower end of their recent ranges, and further losses could not be ruled out.
ASX
Last week's 7% drop in iron ore plus an impending interruption by a super cyclone added to the bearish tone following on from the U.S. on Friday.The ASX has closed mid-range in Sydney but with a definite heavy tone are recovering some initial losses.
A well-defined top in the 5820 area has been tested a number of times. Most likely we will need to see new highs in the United States and a recovery in resource prices to give it new legs above for now.
Support is at 5665, a triple bottom on the daily chart, with the 100-day moving average behind this at 5620.
Japan 225
Life is looking a bit worse for the Nikkei from a technical perspective. Anchored near its daily lows, it is in danger of having a daily close below its 100-day moving average (dma) at 18980. This would be a bearish signal and could preface a test of supports at 18800 and 18662. A close below there could signal a move to 18218.
Up above initial resistance is at Thursday's high and the 55-dma at 19257. A break here could mean a move back towards the 19720 area. This is now a massive topping formation and will be a formidable level to break.
The Nikkei's fate probably relies on the USD/JPY finding some friends and arresting its sell-off. A stronger Yen weighs heavily on Japan's very export driven corporate sector.
Hong Kong
Closing towards the lower end of an admittedly very tight recent range near 24320.
Resistance is at 24470 and then the recent high at 24686.
Support is at the 24225 area with a daily close below opening up a technical move to the ascending support line at 23850.
China A50
The China A50 composite index looks solidly rangebound. Today's better than expected Chinese Industrial Profits number gave mainland traders something to cheer above and offset the disapointments of Friday in the U.S.
The China A50 has resistance at the 10508 area where it has failed three times recently. A close above opens 10648 and then 10697, the December high.
Key support sits at the 100-dma at 10251 which is also a series of daily lows. Below here the next support level is 10178.
Summary
The USD aside, the fallout in Asia of Friday's legislative failure has been modest although some indices are nibbling at their supports. The news may not have been as bad as first thought at a closer look, with President Trump having cleverly put the onus on the Republican Congress to get it's act together and support his legislative programme going forward. Further correction of a strong USD and eye-watering equity valuations cannot be ruled out, but in the bigger picture, President Trump may have lost a battle but could be on track to win the war.
Dollar Correction Continues After Failed Trumpcare Vote
Sunrise Market Commentary
- Rates: How strong is market's faith in reflation trade?
Asian risk sentiment deteriorated after the initial tepid reaction to the Republican health care downfall. This failure could signal problems ahead for Trump's economic agenda and might falter markets' faith in the reflation trade. That could underpin US Treasuries. In yield terms, the US 10-yr yield could be up for a test of 2.3% support this week. - Currencies: Dollar correction continues after failed Trumpcare vote
The dollar is fighting an uphill battle in Asia this morning after Friday's failure of the Republicans to repeal Obamacare in a House vote. USD/JPY dropped below support. EUR/USD is challenging the important 1.0829/74 resistance. The day-to-day momentum is clearly dollar negative. However, we expect any further gains of EUR/USD to be modest and gradual
The Sunrise Headlines
- US stock markets closed mixed and didn't suffer a late setback as the vote on a new Republican health care bill was pulled just before the close. Overnight, Asian stock markets lose up to 0.5% as risk aversion takes the upper hand.
- House Republicans stumbled in their first major attempt to reshape the US government under President Trump, as their long-promised health-care bill failed despite days of personal lobbying by the president and Speaker Paul Ryan.
- With the corpse of Republican's failed efforts to pass healthcare legislation still warm, President Trump says he is already preparing to move on to the next item on his policy to-do list: tax reform.
- German Chancellor Merkel's CDU scored a clear victory in the small state of Saarland, dashing hopes among her contenders that the election would signal a change of political sentiment ahead of a national vote in September.
- China will substantially cut the number of sectors closed to foreign investment, PBOC governor Zhou Xiochuan said. He added though that as his country opens wider, "we want China to get fair treatment overseas".
- A joint committee of ministers from OPEC and non-OPEC oil producers has agreed to review whether a global pact to limit supplies should be extended by six months. Brent crude hovers just above the psychological $50/barrel mark.
- Today's eco calendar is thin with German Ifo business sentiment and EMU M3 money supply data. ECB Praet and Fed Evans are scheduled to speak. The US Treasury starts its refinancing operation with a $26B 2-yr Note auction
Currencies: Dollar Correction Continues After Failed Trumpcare Vote
USD selling persists after failed Trumpcare vote
On Friday, trading in major USD cross rates remained in wait-and-see modus, ahead of the vote on the US healthcare bill. EUR/USD gained slightly ground on strong EMU PMI's. The House not voting on the bill to replace Obamacare initially had only a modest impact. Markets apparently concluded/hoped that tax reform would become a priority for the Trump administration. EUR/USD finished the session at 1.0798 (from 1.0783). USD/JPY even closed the session off the intraday lows at 111.34 (from110.94).
Overnight, Asian markets don't share the relative resilience of the US markets late on Friday evening. US Treasury yields and the dollar are declining. Regional equities ex Japan trade with modest losses. The weaker dollar is a mixed factor for regional equities. USD/JPY is taking the lead in the USD decline. The pair trades currently in the 110.30 area. So, the 111.60/39 range bottom is really broken. The loss of the dollar against the euro is more moderate. The pair trades in the 1.0845 area.
Today, the market calendar is light, but German IFO business sentiment is worth mentioning. The market expects a stabilization of the headline composite index at 111.1. Following Friday's stronger than expected PMI, we put the risks on the upside of consensus. If correct, it would bring the index to the tops registered in 2007 and 2010. We will also scrutinize quotes from ECB's Peter Praet, whether he will push back on rising market expectations that the stronger eco data might accelerate the exit policy.
In a day-to-day perspective, a good Ifo confidence might a be slightly euro supportive (as was the case for the PMI's on Friday). However, the focus will be on the political impact of the failure to replace Obamacare. The dollar will probably stay under pressure in early Europe as investors adapt positions further after the failed Trumpcare vote. US equity futures also show substantial losses, indicating a further correction on the reflation trade. Will this correction accelerate in the US? The daily momentum on US equities and on the dollar is clearly negative, but maybe the correction shouldn't go that far. US bond yields are nearing important support levels that probably won't give away that easily. At the same time, the Trump administration might step up its efforts to cling a victory on other key policy topics like taxes. So, the USD momentum is negative and we don't row against the tide at this stage. However, we don't expect an aggressive USD sell-off.
From a technical point of view, the picture of USD/JPY is worrisome as it clearly dropped below the 111.60/36 support. Next support is coming in at 108.84 (50% retracement of the MT up-move). EUR/USD jumped above the 1.0829 level (2017 top) with the next key reference coming in at 1.0874. A break beyond this level would deteriorate the MT picture for the dollar. Chances on a break of this level are growing. However, we don't expect a real protracted rally of the euro and the dollar already at this stage. The absolute interest rate differential between the US and Germany/European makes EUR/USD long costly. At the same time, we also don't see the euro as the perfect safe haven yet.
EUR/USD: topside test of 1.0829/74 resistance after failed 'Trumpcare' vote
EUR/GBP
Sterling rebound to slow?
On Friday, dovish comments from BoE's Vlieghe caused some profit taking on the recent sterling rally. Admittedly most of the correction occurred in (thin) Asian trading. Cable settled in a tight range close to, mostly slightly below the 1.25 barrier. The rebound of EUR/GBP continued during the morning session due to broader euro gains after the strong EMU PMI's. EUR/GBP returned to mid-0.86 area and closed the session at 0.8657 (from 0.8612).
Overnight, EUR/GBP opened stronger in Europe, as a cautious risk sentiment and a broader bid for EUR/USD supported the pair. However, for now there are no follow-through gains. There are no important eco data in the UK today. So, sterling will probably be driven by global factors (risk-off). Markets will also look forward to the next steps in the Brexit-procedure. Two weeks ago, sterling found a better bid after the early March decline. Some time ago, EUR/GBP cleared 0.8592 resistance, improving the MT technical picture. However, a (substantially) higher than expected UK inflation probably put a decent floor for sterling short-term. We changed our short-term bias on EUR/GBP from positive to neutral. Some further consolidation in the 0.85/0.88 area might be on the cards. Longer term, Brexitcomplications remain a potential negative for sterling, but this issue isn't in the spotlights right now. We are not convinced that the BoE will raise rates anytime soon, even not after this months' higher inflation data
EUR/GBP: sterling rebound to show tentative signs of slowing?
AUDUSD Undergoing A Bearish Reversal
Aussie is currently making a sharp decline from around the 0.7749 level, where a possible top for wave C) of E may have been found. This sharp decline is a confirmation that the previous five wave rise within wave C) is completed and that a minimum three wave reversal may now be in the cards. At the moment we see price sharply declining into wave 3, that may extend its weakness towards the 0.7539 region.
AUDUSD, 4H
Reflation Trade Took Its First Hit, Is Trumps’ Honeymoon Over?
U.S. equities suffered their worst weekly performance since the U.S. election back in November. The S&P 500 declined 1.44% while the Dow Jones industrial average lost 318 points and the heavy tech Nasdaq index fell 1.22%.
The fall in equities was largely attributed to failure of Trump's first test when his own party leaders pulled legislation to replace Obamacare. The lesson learned last week is that a Congress controlled by the Republicans doesn't necessarily mean the President will be able to pass laws or his negotiation may work in business deals. Unfortunately for him, it seems politics is going to be a different type of game that requires a different form of art.
Although investors didn't like the news, markets quickly managed to recover most of their losses on Friday after Trump signaled they would move on to the next phase of cutting taxes - the key contributor to the market's rally.
I believe that few knew replacing the health care would be this complicated, and it's becoming more apparent that tax reforms and fiscal stimulus won't be any easier especially that many Republicans don't support massive deficits. Given that investors have been pricing in the expected changes in fiscal policies for almost five months, I find it somehow difficult to keep buying into this market based only on promises.
Investors might begin reassessing their positions and for those who were completely ignoring market valuations it's time to reconsider looking at some important metrics. Most valuation metrics are indicating overstretched prices, whether it is P/E, Price/Book, Free cash flow yield, cyclically adjusted P/E, and the list goes on. However, in a momentum trade, driven by very optimistic expectations very few care about current valuations. But if you believe that Trump's honeymoon is over and last week's experience is just a guide on what to expect next, I believe markets will sell off sharply, probably up to 10% correction.
The VIX index sent its first warning signal on Friday, jumping above 14 for the first time in 2017. Meanwhile, the fall in U.S. Treasury yields are also indicating that many investors wanted to be in a safe place. I'll be mostly worried on the financial sector, which is likely to take the biggest hit in case of a market correction. So be prepared for a bumpy road ahead, and make sure you fasten your seatbelts.
Asian Market Update: Gold Rises As investors Question Reflation Trump Trade After Healthcare Reform Bill Failed
Gold rises as investors question reflation Trump trade after healthcare reform bill failed
Asia Mid-Session Market Update: Stocks and Dollar fall, Gold rises as investors question reflation Trump trade after healthcare reform bill failed
Friday US markets on close: Dow -0.3%, S&P500 -0.1%, Nasdaq +0.2%
Best Sector in S&P500: Utilities
Worst Sector in S&P500: Materials
Biggest gainers: FTR +7.7%; MU +7.4%; CNC +5.2%
Biggest losers: MLM -2.9%; FLR -2.5%; NUE -2.5%
At the close: VIX 12.9 (-0.2pts); Treasuries: 2-yr 1.24% (-4bps), 10-yr 2.40% (-2bps), 30-yr 3.00% (-3bps)
Politics
(US) On Saturday, President Trump tweeted to "Watch @JudgeJeanine on @FoxNews tonight", whose opening segment called for House Speaker Ryan to step down because of failed healthcare bill vote
(US) Rep Ted Poe (R-TX) resigns from House Freedom Caucus because of its opposition to healthcare legislation - CNN
(HK) Hong Kong electoral committee picked pro-China candidate Carrie Lam over John Tsang to be the next leader - financial press
(DE) Chancellor Merkel's CDU party was victorious in Saarland state regional election with 41% of the vote vs 29.5% for SPD; Far-right AfD party received 6% - press
Weekend US/EU Corporate Headlines
MGI: Enters into confidentiality agreement with Euronet Worldwide to further consider Euronet's unsolicited proposal
Key economic data:
(CN) CHINA JAN-FEB INDUSTRIAL PROFITS Y/Y: 31.5% V 2.3% PRIOR
(JP) JAPAN FEB PPI SERVICES Y/Y: 0.8% V 0.5%E (2-year high)
Asia Session Notable Observations, Speakers and Press
Risk-off sentiment is heating up as S&P500 emini futures fell nearly 20 handles, USD/JPY came in by over 100 pips, and Gold rallied over $15 from Friday close. Political risk is the primary culprit as investors worry that GOP failure to get the healthcare bill across the finish line will dampen other pro-business reform agenda items for the Trump White House, namely tax reform and fiscal spending measures. Pundits suggest that the rift between POTUS and GOP congressional leadership may still widen, considering that Trump promised to lower individual middle class taxes and has remained ambivalent on border adjustment tax, while House Speaker Ryan and Ways and Means chair Brady view tax reform as a catalyst for growth and could prioritize tax cuts for the top 1% as well as considering border adjustment as essential.
Nikkei225 is the worst peforming index, dragged down by stronger JPY weighing on exports. Dollar decline against EUR is also noteworthy, with single currency hitting a 3-month high, helped by constructive result for the European Union in German regional elections. Chancellor Merkel's CDU party took 41% of the vote in Saarland, up from 35% in 2012 elections and above 29.5% for SPD and 6% for euro-skeptic AfD.
BOJ Summary of Opinion from the most recent meeting underscored entrenched policy stance for the central bank. Despite progress on growth and inflation, BOJ said there is still a long way to go to achieve the price stability target of 2%. Separately, PM Abe also remarked that it was too early to consider monetary stimulus exit strategy.
In notable economic data, China Jan-Feb industrial profits rose a healthy 31.% v just 2.3% in Dec. Stats Bureau said the growth in profits was mostly due to faster growth in prices of coal, steel, and crude oil, though the overall trend is still one of recovery in the industry. Among top corporates, China's property developer Vanke posted strong profit and sales growth, but also noted some housing price cooling due to govt curbs.
China
(CN) China State Information Center research fellow Fan Jianping: Chinese govt must target badly run financial institutions, or will only make things go from bad to worse
(CN) PBoC Gov Zhou: monetary policy may have reached an end to the quantitative easing path - Boao Forum panel discussion
(CN) China may start carbon trading in July - Chinese press
(CN) China approved 10 IPOs on Friday worth CNY6.1B - Chinese press
Japan
(JP) Japan PM Abe: Too early to consider monetary stimulus exit strategy
Australia
(AU) According to Australia Bureau of Stats, underemployment in 15-24 year old range is at 31.5%, highest in 40 years - Australian press
(NZ) New Zealand PM English: Signed agreement on the Belt and Road Initiative with China; FTA to start in April
Korea
(KR) Bank of Korea (BOK) Q4 regional survey shows South Korean manufacturers are expected to spend more on capital investment this year than they did last year, although those expenditures will be conservative and mostly geared towards maintaining facilities than expansion
Asian Equity Indices/Futures (00:00ET)
Nikkei -1.3%, Hang Seng -0.3%, Shanghai Composite +0.1%, ASX200 -0.2%, Kospi -0.5%
Equity Futures: S&P500 -0.7%; Nasdaq -0.7%, Dax -0.5%, FTSE100 -0.6%
FX ranges/Commodities/Fixed Income (00:00ET)
EUR 1.0825-1.0850 (3-month high); JPY 110.25 (4-month low) -111.05; AUD 0.7615-0.7635; NZD 0.7025-0.7050; GBP 1.2490-1.2530
Apr Gold +0.6% at 1,256/oz; May Crude Oil -0.3% at $47.85/brl; May Copper -1.6% at $2.60/lb
OPEC and non-OPEC producers agree to review whether oil output cuts should be extended by 6 months - press
SPDR Gold Trust ETF daily holdings fall 1.8 tonnes to 832.6 tonnes
(CN) PBoC skips open market operations for 2nd straight session; Bank liquidity is high
(CN) PBOC SETS YUAN MID POINT AT 6.8701 V 6.8845 PRIOR; strongest Yuan setting since Feb 24th
(AU) Ausatralia MoF sells A$500M in 3.0% 2047 bonds; bid-to-cover 2.65x
(KR) South Korea sells KRW0.84T v KRW0.84T offered in 20-yr govt bonds; avg yield 2.3% v 2.215% prior
Asia equities / Notables / movers
Australia
FXJ.AU Fairfax Media +2.5%; TPG Capital could make a bid for Fairfax Media's Domain business as early as this week - AFR
SGP.AU Stockland Corp +1.9; Affirms FY17 FFO +6-7% y/y
BHP.au -2.8%, RIO.au -2.0%, FMG.AU -2.6%; Iron ore falls over 4%
Japan
6502.JP Toshiba -3.5%; Largest creditors are torn over its future strategy as pressure builds for a swift Chapter 11 bankruptcy protection filing by Westinghouse - FT
9602.JP Toho Gas -1.1%; May report FY net profit ¥50B, +23% y/y (prior guidance ¥47B) - Nikkei
1801.JP Taisei +1.0%; Expected to report FY16/17 net profit of ¥100B, +30% y/y and above ¥76B prior forecast; May boost dividend or share buyback program - Nikkei
Hong Kong
1638.HK Kaisa Group Holdings; +62.8%; Resumes trading; Reports FY16 net loss CNY1.29B v profit CNY2.17B y/y; Rev CNY19.6B v CNY19.5B y/y
0842.HK Leoch International Technology +7.0%; Reports FY16 Net CNY232M v CNY106M y/y; Rev CNY6.26B v CNY4.33B y/y
0551.HK Yue Yuen Industrial +5.6%; Reports FY16 Net $534.6M v $390.2M y/y, Rev $8.48B v $8.43B y/y
1114.HK Brilliance China Automotive Holding +4.9%; Reports FY16 Net CNY3.39B v CNY3.28B y/y, Rev CNY5.13B v CNY4.86B y/y
3866.HK Bank of Qingdao Co Ltd +2.5%; Reports FY16 Net CNY2.09B v CNY1.81B y/y; Rev CNY6.0B v CNY5.0B y/y
2202.HK China Vanke -3.3%; Reports FY16 Net CNY21.0B v CNY18.1B y/y, Rev CNY228.9B v CNY184.3B y/y
1072.HK Dongfang Electric Corp -2.4%; Reports FY16 net loss CNY1.8B v profit CNY439M y/y; Rev CNY33.3B v CNY36.0B y/y
0816.HK Huadian Fuxin Energy Corp -4.8%; Reports FY16 Net CNY2.0B v CNY1.9B y/y, Rev CNY15.9B v CNY15.4B y/y
819.HK Tianneng Power International Limited -9.0%; Reports FY16 Net CNY905.5M v CNY627.8M y/y; Rev CNY21.5B v CNY17.8B y/y
951.HK Chaowei Power Holdings Limited -9.1%; Reports FY16 Net CNY619M v CNY488M y/y; Rev CNY21.5B v CNY18.9B y/y
3900.HK Greentown China Holdings -9.9%; Reports FY16 Net CNY1.92B v CNY0.81B y/y; Rev CNY28.9B v CNY26.0B y/y
Weekly Technical Outlook And Review
A note on lower timeframe confirming price action...
Waiting for lower timeframe confirmation is our main tool to confirm strength within higher timeframe zones, and has really been the key to our trading success. It takes a little time to understand the subtle nuances, however, as each trade is never the same, but once you master the rhythm so to speak, you will be saved from countless unnecessary losing trades. The following is a list of what we look for:
- A break/retest of supply or demand dependent on which way you're trading.
- A trendline break/retest.
- Buying/selling tails ... essentially we look for a cluster of very obvious spikes off of lower timeframe support and resistance levels within the higher timeframe zone.
- Candlestick patterns. We tend to only stick with pin bars and engulfing bars as these have proven to be the most effective.
EUR/USD
Weekly gain/loss: + 58 pips
Weekly closing price: 1.0796
Trade update: Trade taken from 1.0783 was taken out at breakeven. See Friday's report for details.
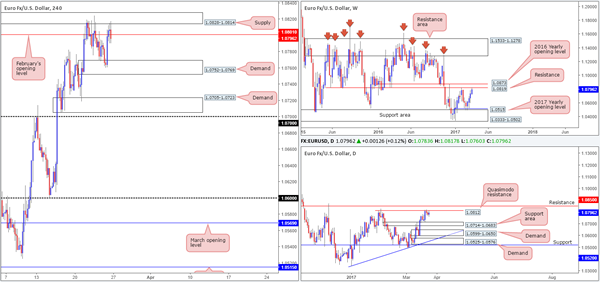
Weekly bulls printed a fourth consecutive bullish candle last week, consequently forcing the pair to shake hands with resistance coming in at 1.0819. The minor end-of-week correction seen from here suggests that the bears may attempt to bring price back down to the 2017 yearly opening level at 1.0515/support area at 1.0333-1.0502 in the coming weeks.
In conjunction with the weekly timeframe, daily price has been seen teasing the underside of a Quasimodo resistance level at 1.0812 (planted seven pips below the above noted weekly resistance line) since Tuesday. Also noteworthy here is that Thursday/Friday's candles printed a bullish engulfing pattern. However, this may not amount to much buying given the structure seen overhead! With that in mind, the next downside target in view can be seen around the support area formed at 1.0714-1.0683.
Bolstered by a string of upbeat Eurozone PMI figures on Friday, the H4 chart shows demand at 1.0752-1.0769 managed to elbow its way into the spotlight. The rally from here saw price retest the supply at 1.0828-1.0814, and end the day chalking in a reasonably sized bearish rotation candle that closed beyond February's opening base line at 1.0801.
Our suggestions: With both the weekly and daily charts displaying resistance, along with the recent H4 candle close mentioned above, we feel the sellers may make an appearance today and likely bring price down to at least the aforementioned H4 demand. The only drawback here, of course, is the distance seen between the monthly level and the H4 demand (30 pips). Therefore, in order to keep risk/reward in one's favor, we'd advise drilling down into the lower timeframes and trying to pin down a sell setup (see the top of this report for ideas on high-probability sell signals).
Data points to consider: German IFO business climate survey at 8am. FOMC member Evans speaks at 5.15pm, as well as FOMC member Kaplan taking the stage at 10.30pm GMT.
Levels to watch/live orders:
- Buys: Flat (stop loss: N/A).
- Sells: 1.0801 region ([waiting for a lower-timeframe signal to form is advised before pulling the trigger] stop loss: dependent on where one confirms this area).
GBP/USD:
Weekly gain/loss: + 82 pips
Weekly closing price: 1.2472
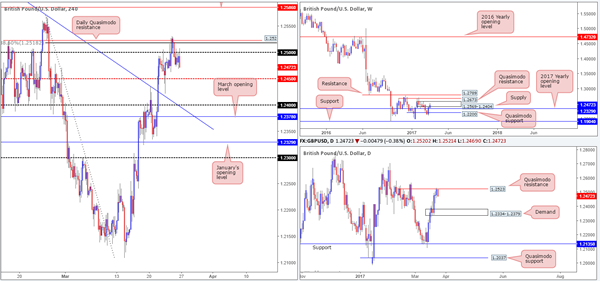
Despite weekly price boasting its second consecutive weekly gain last week, the pair is now seen trading within the walls of a supply zone visible at 1.2569-1.2404. Another key thing to note here is the closing candle's end-of-week correction! In the event that the bears pull the unit lower this week, price will likely find a pocket of bids sitting nearby the 2017 yearly opening level at 1.2329.
Seen within the current weekly supply zone is a daily Quasimodo resistance level drawn from 1.2523, which managed to hold price lower on Friday. The full-bodied bearish candle seen from here may be enough to entice sellers into the market to bring the unit down to demand at 1.2334-1.2379 (located a few pips above the aforementioned 2017 yearly opening level).
As can be seen from the H4 chart, the daily Quasimodo resistance line is also reinforced with an 88.6% retracement seen at 1.2518. For those who read Friday's report you may recall that our team recommended waiting for a H4 close to form beyond the 1.25 handle before considering shorts. This took place going into the early hours of Friday's segment, with 1.25 holding beautifully as resistance throughout the day. In fact, the week ended printing a nice-looking full-bodied bearish candle from this number!
Our suggestions: Depending how the market opens today, we would consider jumping in short. In light of the higher-timeframe resistance in play right now, the nearby H4 mid-way support at 1.2450 will likely be taken out and price could connect with 1.24, which happens to be our first take-profit target.
Data points to consider: FOMC member Evans speaks at 5.15pm, as well as FOMC member Kaplan taking the stage at 10.30pm GMT.
Levels to watch/live orders:
- Buys: Flat (stop loss: N/A).
- Sells: Potential shorts at the open (stop loss: 1.2510).
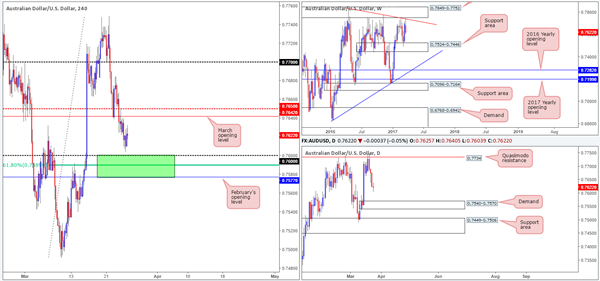
AUD/USD
Weekly gain/loss: – 80 pips
Weekly closing price: 0.7622
After crossing paths with the underside of a weekly trendline resistance taken from the high 0.7835, the bears pushed the commodity-linked currency lower last week. On the condition that this pair remains in the red, the next port of call can be seen at 0.7524-0.7446: a weekly support zone.
Climbing down to the daily chart, we can see that the buyers and sellers ended the week forming an indecision candle. Be that as it may, there's still room seen for further downside this week until we connect with the demand base coming in at 0.7540-0.7570 (positioned just ahead of the aforementioned weekly support area).
Looking across to the H4 candles, a rather interesting area (painted in green) of support has recently caught our eye. It comprises of February's opening level at 0.7577, a 61.8% Fib support at 0.7589 and the 0.76 handle. What is also notable from here is that the aforementioned daily demand sits only 7 pips below this zone! Therefore, one should prepare for the possibility of a fakeout here!
Our suggestions: While our team is interested in buying from the above noted H4 buy zone, we would prefer to enter long within the lower limits of its range. That way, we can place stops beyond the daily demand! Should price reach this point and print a reasonably sized H4 bullish rotation candle, then our team would, if we're not in on any other trades at the time, look to buy from here, targeting March's opening level at 0.7642 as an initial take-profit target.
Data points to consider: RBA Assistant Gov. Debelle speaks today at 10pm. FOMC member Evans speaks at 5.15pm, as well as FOMC member Kaplan taking the stage at 10.30pm GMT.
Levels to watch/live orders:
- Buys: 0.7577/0.76 ([waiting for a reasonably sized H4 bullish candle to form before pressing the buy button is advised] stop loss: Ideally beyond the trigger candle).
- Sells: Flat (stop loss: N/A).
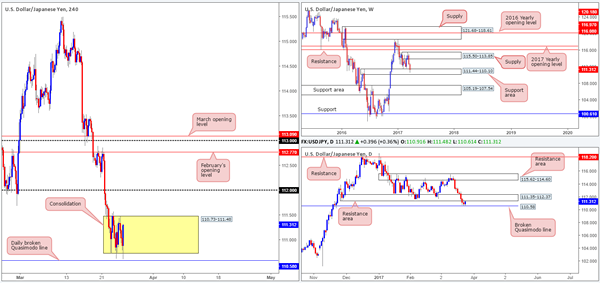
USD/JPY:
Weekly gain/loss: – 138 pips
Weekly closing price: 111.31
The USD/JPY sustained further losses last week, resulting in weekly action testing the support area fixed at 111.44-110.10. Providing that this barrier holds firm, the next zone of interest seen overhead falls in around the supply area drawn from 115.50-113.85.
Since Wednesday's close, the daily candles have been sandwiched between a broken Quasimodo line at 110.58 and a resistance area marked at 111.35-112.37. Before our desk can become buyers (medium term) from the current weekly support area, this daily resistance area will need to be taken out.
A brief look at recent dealings on the H4 chart shows that price has recently entered into a phase of consolidation between 110.73/111.48 (yellow area). Directly beneath this zone sits the daily broken Quasimodo line at 110.58, whereas above the base, we have the 112 handle in view.
Our suggestions: Based on the above points, we would not really feel comfortable attempting to trade the current H4 range. We would, however, be interested in buying should a H4 close form above this consolidation, along with a retest to the top edge as support, targeting 112 as an initial take-profit target. Whilst this setup has the backing of the weekly support area, let's also remember that by entering long here you are still effectively buying into a daily resistance area! Therefore, we would advise being extra aggressive managing the trade here.
Data points to consider: FOMC member Evans speaks at 5.15pm, as well as FOMC member Kaplan taking the stage at 10.30pm GMT.
Levels to watch/live orders:
- Buys: Watch for H4 price to engulf the 111.48 level and then look to trade any retest seen thereafter (stop loss: ideally planted beyond the rejection candle's tail).
- Sells: Flat (stop loss: N/A).
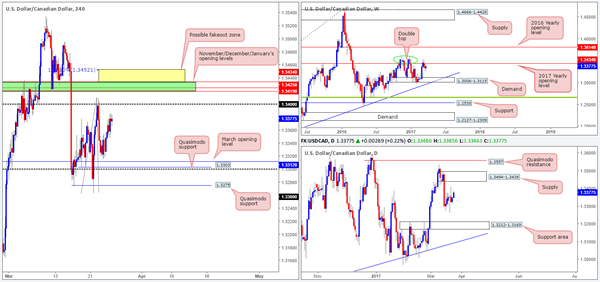
USD/CAD
Weekly gain/loss: + 35 pips
Weekly closing price: 1.3377
Following the selloff seen from the 2017 yearly opening level at 1.3434 two weeks back, weekly price responded with a round of buying from a low of 1.3263 last week. Technically speaking, this could encourage further buying this week back up to the yearly level. Daily flow on the other hand, offers very little in terms of direction at the moment. The unit is seen meandering mid-range between a supply coming in at 1.3494-1.3439 and a support area at 1.3212-1.3169.
Looking at Friday's action on the H4 chart reveals that although the pair posted a gain, there was little change seen to structure. The next resistance target on tap can be seen at the 1.34 handle, followed closely by 1.3434/1.3419 (November, December and January's opening levels marked in green). It might also be worth noting that above here there is a possible fakeout area painted in yellow at 1.3452/1.3434 (the top edge denotes a 127.2% Fib ext. taken from the low 1.3263), which happens to register nicely with the lower limits of the aforementioned daily supply.
Our suggestions: We still have a keen interest in The H4 1.3434/1.3419 region for shorts. Here's why:
Of note is the 1.34 handle. Psychological levels are prone to fakeouts, and with 1.3434/1.3419 lurking just above 1.34, we feel it'd be a fantastic barrier to help facilitate a fakeout.
When these monthly levels converge, we typically find that they hold firm the majority of the time offering at least a bounce.
In that these monthly levels form a rather small zone, however, and with a somewhat attractive H4 fakeout zone seen above it (attractive due to it being located within daily supply) there is also a chance that price could whipsaw through the monthly levels before turning lower.
To short, we are looking for a H4 bearish selling wick to form that pierces into our pre-determined H4 yellow zone discussed above. With this, shorts would be a valid call from this region, in our opinion. From this point, 1.34 could be a potentially troublesome level, so we'd be looking for this base to be consumed, which would in turn be our cue to reduce risk to breakeven.
Data points to consider: FOMC member Evans speaks at 5.15pm, as well as FOMC member Kaplan taking the stage at 10.30pm GMT.
Levels to watch/live orders:
- Buys: Flat (stop loss: N/A).
- Sells: 1.3452/1.3419 ([watch for a H4 bearish selling wick to form within this range before considering a short] stop loss: ideally beyond the candle's wick).
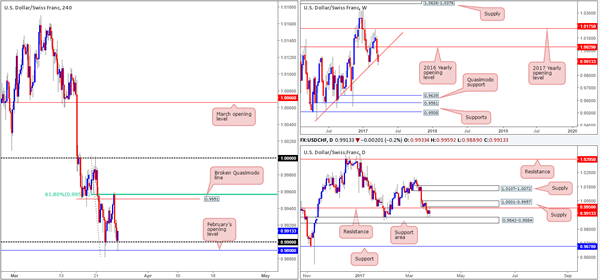
USD/CHF
Weekly gain/loss: – 66 pips
Weekly closing price: 0.9913
The steep descent seen over the past couple of weeks, shaped by two near-full-bodied weekly bearish candles, concluded trade last week closing below a weekly trendline support extended from low 0.9443. Providing that the bears continue to hold ground here, then the next support target does not come into view until the 0.9639 mark!
Down on the daily chart, nevertheless, price is seen capped between a supply zone at 1.0001-0.9957/resistance at 0.9950 and a support area pegged at 0.9842-0.9884. It would take a decisive close beyond this support area to convince us that price could be headed for the support line coming in at 0.9678, which sits only a few pips above the weekly support at 0.9639.
For those who read Friday's report you may remember that we were interested in shorts from the H4 broken Quasimodo line at 0.9951, due to it converging with both a daily resistance pegged at 0.9950 and a H4 61.8% Fib resistance at 0.9956. As you can see, price responded beautifully to this zone and aggressively sold off. Well done to any of our readers who managed to pin down a trade here!
Our suggestions: Although the H4 candles caught a bid from February's opening level at 0.9890 late Friday, our team is reluctant to buy from here given the recent weekly close. A H4 close beyond this monthly level, nevertheless, would be very interesting! To the left of H4 price, we do not see any active H4 demand until the 0.98 handle. Therefore, a H4 close below 0.9890, followed up with a sound retest as resistance would, in our opinion, be a high probability sell. Granted, by shorting here, you'd effectively be going up against daily buyers, but, as already mentioned, with little H4 demand being seen coupled with last week's close, we feel this is worth the risk.
Data points to consider: FOMC member Evans speaks at 5.15pm, as well as FOMC member Kaplan taking the stage at 10.30pm GMT.
Levels to watch/live orders:
- Buys: Flat (stop loss: N/A).
- Sells: Watch for H4 price to engulf the 0.9890 level and then look to trade any retest seen thereafter (stop loss: ideally planted beyond the rejection candle's wick).
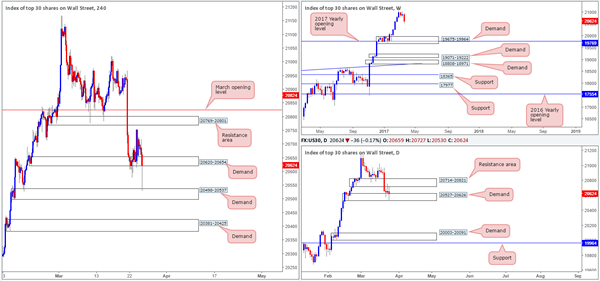
DOW 30:
Weekly gain/loss: – 288 points
Weekly closing price: 20624
Following a two-week consolidation around record highs, US stocks tumbled 300 points lower last week. Right now, there is very little weekly structure seen until the index crosses swords with demand at 19675-19964, which happens to intersect with the 2017 yearly opening level at 19769.
Despite weekly price suggesting further selling could be on the cards, the daily chart seems to be throwing up a red flag. Since Wednesday, the DOW has been consolidating between demand at 20527-20626 and a resistance area at 20714-20821. In addition to this, Friday's movement chalked in an indecision candle with a slight edge seen going to the bears. A violation of this demand would likely open up the path south down to demand pegged at 20003-20091 (located just above the aforementioned weekly demand and daily support at 19964).
Jumping across to the H4 candles, we can see that the demand area at 20620-20654 remains intact, despite Friday's vicious whipsaw through this zone down to a H4 demand at 20498-20537 (positioned around the underside of the daily support area). With stops likely weakened beyond 20620-20654, further downside is a real possibility today.
Our suggestions: However, we would not feel comfortable shorting this market until a H4 close is seen beyond the 20498-20537 zone. A close below here would not only likely clear bids out from the daily support area and further confirm strength on the weekly timeframe, but it would also open us some space down to the H4 demand base drawn in at 20381-20425.
Data points to consider: FOMC member Evans speaks at 5.15pm, as well as FOMC member Kaplan taking the stage at 10.30pm GMT.
Levels to watch/live orders:
- Buys: Flat (stop loss: N/A).
- Sells: Not considering sells until the H4 demand at 20498-20537 is consumed.
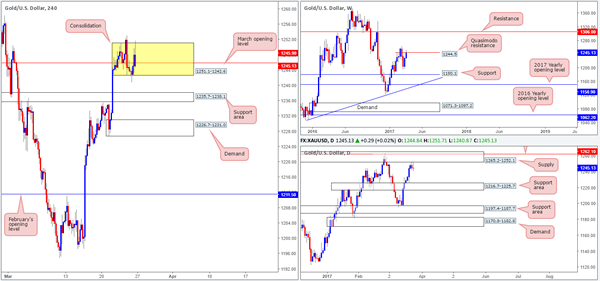
GOLD:
Weekly gain/loss: + $16
Weekly closing price: 1245.1
The gold market enjoyed another relatively successful week, reaching a high of 1253.0. Also of note on the weekly timeframe is price marginally closed beyond the Quasimodo resistance level at 1244.5. However, given that this close is considered minor on this scale, we believe this resistance still has a good chance of rotating price this week.
Turning our attention to the daily timeframe, the bears are seen responding relatively well to the supply zone printed at 1265.2-1252.1 (encapsulates a resistance level at 1262.1). This – coupled with the weekly Quasimodo resistance level in play right now could force bullion down to the daily support area penciled in at 1216.7-1225.7 sometime this week.
Since Wednesday, the yellow metal has been consolidating around March's opening level at 1245.9 between 1251.1-1242.6 (yellow zone). Based on the higher-timeframe structure, a close below this range is likely. Still, to short here would be challenging with a H4 support area lodged just below at 1235.7-1238.1, followed relatively closely by a H4 demand area at 1226.7-1231.0 which is also located just above the aforementioned daily support area.
Our suggestions: Although the higher timeframes indicate that lower prices could be seen this week, nearby H4 structure is suggesting otherwise. With this in mind, remaining on the sidelines may very well be the better path to take today.
Levels to watch/live orders:
- Buys: Flat (stop loss: N/A).
- Sells: Flat (stop loss: N/A).
US Dollar Opens Trading Week With Major Weakness
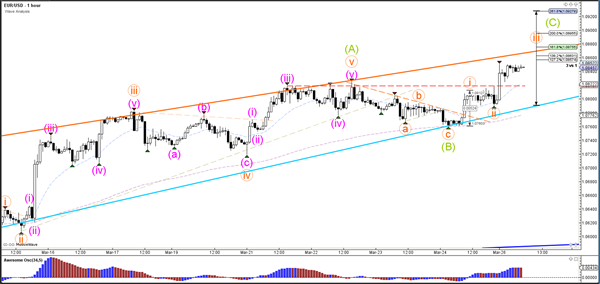
Currency pair EUR/USD
The EUR/USD broke above the 1.0828 resistance level which has invalidated last week's wave 2 structure. With the bullish break it seems likely that price will continue with the uptrend as part of wave C (green).
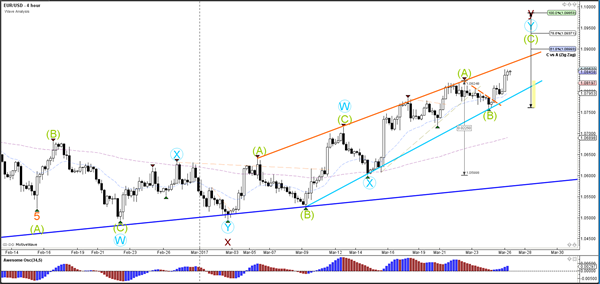
The EUR/USD could be in a bullish wave 3 (orange) aiming for the Fibonacci targets.
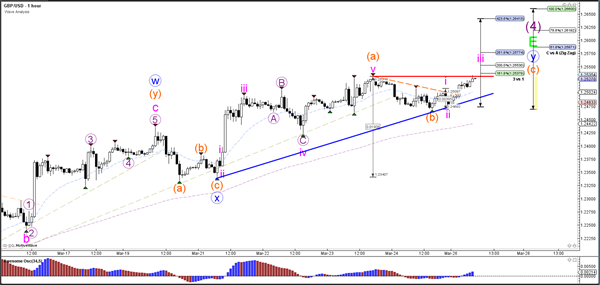
Currency pair GBP/USD
The GBP/USD is trying to break above the resistance trend line (red line) but just above it are also two strong Fibonacci levels as well. A break below support (blue) could see a bearish breakout.
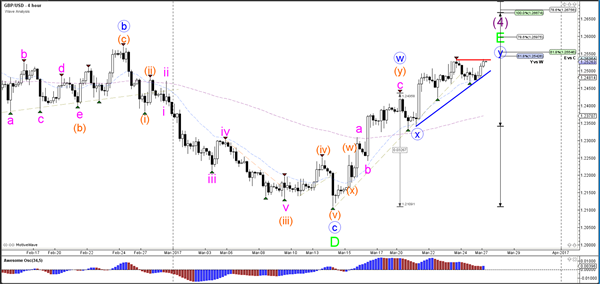
The GBP/USD broke above resistance (red) could see bullish momentum within wave C (orange) push price towards the Fib targets.
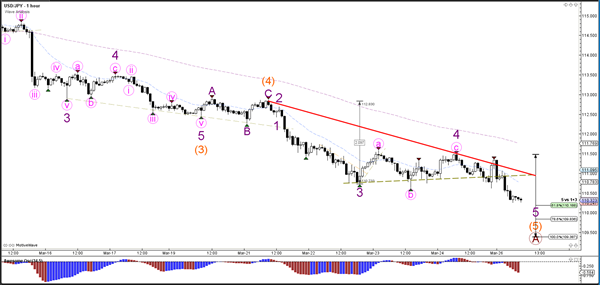
Currency pair USD/JPY
The USD/JPY is building a larger bearish ABC zigzag (brown), which could take price down to the 50% Fibonacci retracement support level of wave 4 vs 3 (purple).
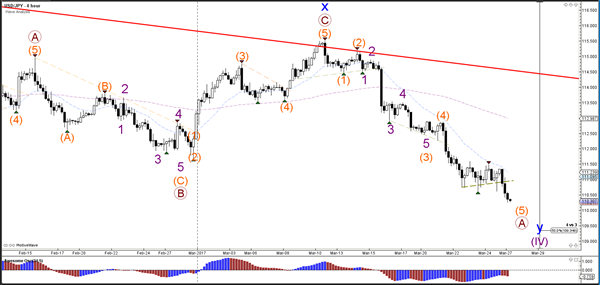
The USD/JPY broke below support (dotted green) and is moving towards the Fibonacci targets of wave 5 (purple/orange).