
Sample Category Title
AUD/USD Daily Outlook
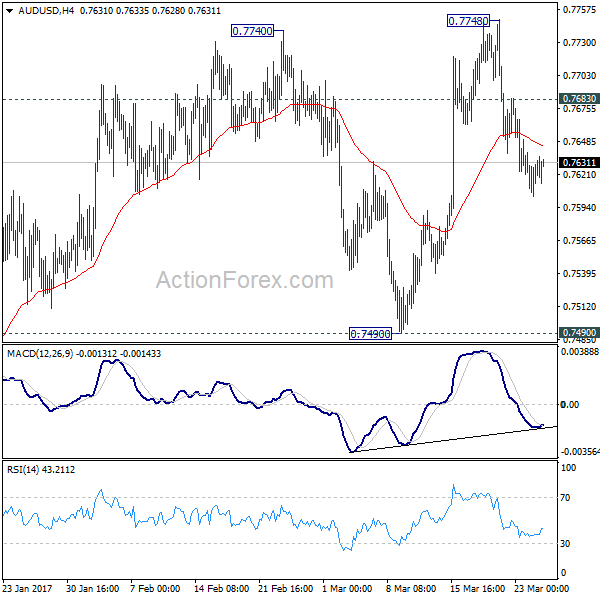
Daily Pivots: (S1) 0.7603; (P) 0.7622; (R1) 0.7640; More...
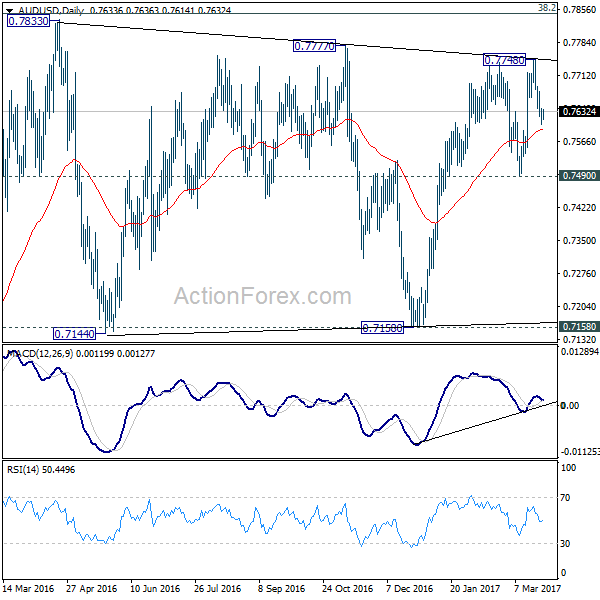
Intraday bias in AUD/USD remains mildly on the downside for the moment. With 0.7683 minor resistance intact, deeper decline is in favor to 0.7490 support. Firm break there will confirm completion of rise from 0.7158. In such case, near term outlook will be turned bearish for 0.7158 support next. On the upside, though, above 0.7683 minor resistance will turn bias back to the upside for 0.7748 and above. At this point, we'd continue to expect strong resistance from long term retracement level at 0.7849 to limit upside.
In the bigger picture, we're still treating price actions from 0.6826 low as a correction. And, as long as 38.2% retracement of 0.9504 to 0.6826 at 0.7849 holds, long term down trend from 1.1079 is expected to resume sooner or later. Break of 0.6826 low will target 0.6008 key support level. However, firm break of 0.7849 will indicate that rise from 0.6826 is developing into a medium term rebound, rather than a sideway pattern. In such case, stronger rise should be seen to 55 month EMA (now at 0.8169) and above.
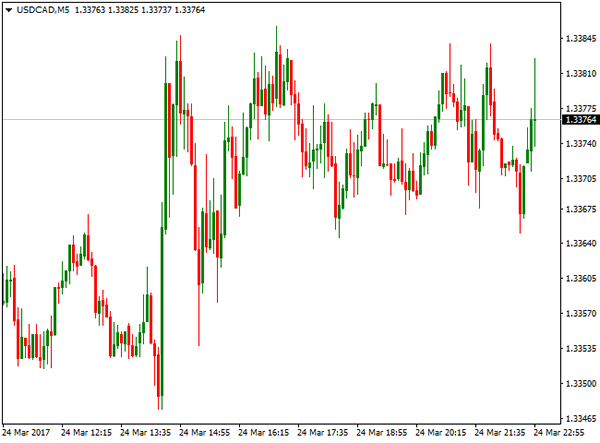
USD/CAD Daily Outlook
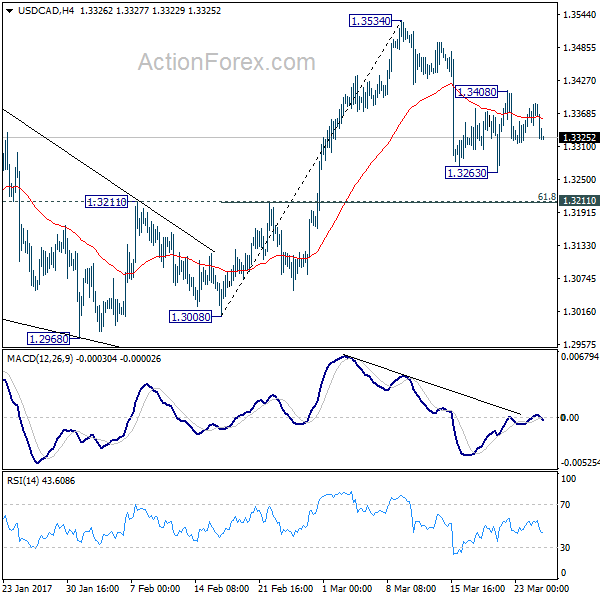
Daily Pivots: (S1) 1.3349; (P) 1.3367; (R1) 1.3396; More....
Intraday bias in USD/CAD remains neutral for the moment as it's bounded in range of 1.3263/3408. On the upside, above 1.3408 will turn bias to the upside for 1.3534. Break will target 1.3598 high next. On the downside, below 1.3263 will extend the fall from 1.3534. Still, fall from 1.3534 is seen as a correction only. Hence, in that case, we'd expect strong support from 1.3211 cluster level (61.8% retracement of 1.3008 to 1.3534 at 1.3209) to contain downside and bring rebound. Overall, rise from 1.2968 is expected to resume later to extend through the whole medium term rise from 1.2460 through 1.3598.
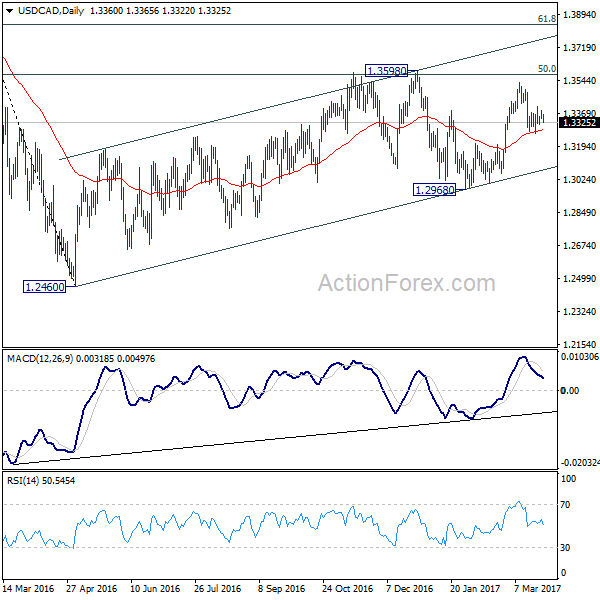
In the bigger picture, price actions from 1.4689 medium term top are seen as a correction pattern. The first leg has completed at 1.2460. The second leg is likely still in progress and could target 61.8% retracement of 1.4689 to 1.2460 at 1.3838. We'd look for reversal signal there to start the third leg. Break of 1.2968 wold at least bring at retest of 1.2460 low. However, sustained trading above 1.3838 would pave the way to retest 1.4689 high.
What’s Up Next For The AUD?
Key Points:
- The AUD could go either way this week depending on the fundamentals.
- EMA bias remains bullish which could see a near-term recovery.
- However, MACD crossover is hinting at further downside
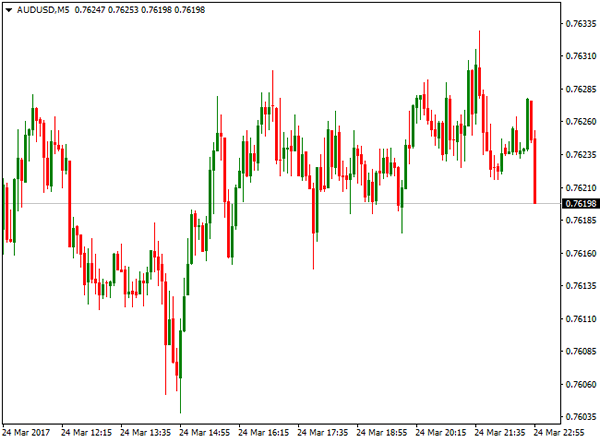
The AUDUSD has reached a bit of an impasse as a result of last week's tumble which now raises the question of what is next on the agenda. Consequently, it may be worth taking a look at what brought the pair to where it is now and what might be fuelling either the potential recovery or extension of the recent downtrend.
Starting with last week's performance, the Aussie Dollar was initially looking fairly bullish last week as it surged higher in response to the political risks sparked by the ongoing ‘Trumpcare' fiasco. However, this buying pressure was short-lived as it brought the pair into conflict with the descending trend line around the 0.7732 handle. Importantly, this proved to be a reversal point that slapped the pair sharply lower in short order. However, these losses continued to be realised as the fundamental bias began to favour the USD. Notably, the pair had another big slide in response to an uptick in the US New Home Sales figure to 592K m/m.
On the technical front, as mentioned, the AUD is now at a bit of a crossroads which could see either a mild recovery or further losses this week. Which of the two outcomes occurs is largely predicated on whether or not the pair breaks through the 50.0% Fibonacci level around the 0.7609 mark. If we do see the level broken, the MACD signal line crossover will complete which could mean losses extend back to the 0.7562 mark before the 100 day EMA provides some support. However, if the retracement holds, the generally bullish EMA bias could see the AUD move to recover some of last week's losses.
As for what lies ahead on the news front, the first half of the week will largely focus on the usual slew of US data and some scheduled comments from a number of Fed members. Conversely, the second half of the week will be slightly more Australian news focused as the HIA New Home Sales and Job Vacancies are due out on Thursday. Although, it is worth mentioning that the US Final GDP figure is also due on Thursday which could either compound or mitigate the effect of the two Australian results, dependent on whether or not the 2.0% q/q uptick is realised.
Ultimately, it's worth keeping an eye on this pair as it has the potential to please both the bulls and the bears out there. However, remember to pay close attention to both the fundamentals and that 50.0% Fibonacci retracement as these will be key in catching either the rebound or the fresh breakout and subsequent downside risk.
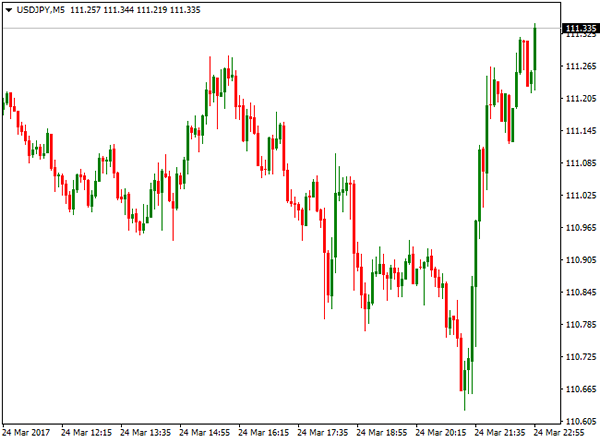
USDJPY Faces A Critical Support Zone As 1.10 Handle Now In Focus
Key Points:
- USDJPY flirting with a 1.10 handle breakdown.
- Net positioning towards shorts.
- Watch for a breakdown in the coming days.
The past week has been highly negative for the USDJPY as s sentiment swing, against the U.S. Dollar, has been in progress following some upset expectations around potential Fed rate hikes. Subsequently, the pair has plumbed new depths as a determined depreciation has sent the pair reeling towards the 1.10 handle. Subsequently, we review the major events of last week with and discuss some of the key points that are likely to impact the pair's valuations in the week ahead.
The USDJPY slid sharply lower throughout most of last week as the pair was beset by a broadly negative greenback sentiment swing. The change in sentiment is largely due to shifting goal posts around future FOMC rate hikes with little in the way of hawkish rhetoric from the Fed last week. Subsequently, net greenback short positions are increasing which led to significant selling of the USDJPY late into the week's session. This saw the pair take out some key support zones and enter the close sharply under pressure around the 110.61 mark.
The week ahead is likely to be critical for the pair with the key 110.00 support level looming and the bears waiting in the wings. The market's key focus for the coming week is likely to be the Japanese CPI and U.S. Jobless Claims. In particular, the U.S. Unemployment Claims figures are likely to be closely watched by traders as they grapple with the Fed's potential direction on rate hikes in the coming months. Most economists have the result coming in around the 245k mark but a miss could see some significant selling pressure on the pair and put the 110.00 handle in focus.
From a technical perspective, the pair's recent collapse seems to suggest that a corrective phase is in progress and is yet to complete. The pair has plumbed some key lows but we are yet to see some sharp follow through selling. Regardless, the bears are firmly in control and the coming week is likely to open with plenty of short selling. Support is currently in place for the pair at 110.40, 109.08, and 107.62. Resistance exists on the upside at 111.87, 113.28, and 114.40.
Ultimately, it would appear that the bears aren't going anywhere soon as we move into the Asian trading session. This is especially the case given the both technical and fundamental factors suggest that the decline is not yet over for the pair. Subsequently, keep a close watch in the coming days as a breach of the key 110.00 handle could signal a recommencement of the sharp falls.
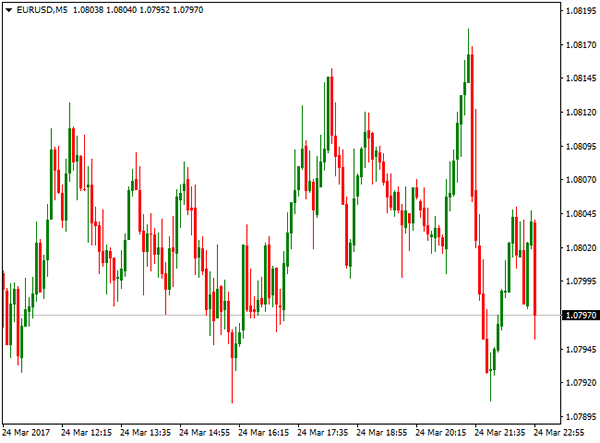
EUR/USD Daily Outlook
Daily Pivots: (S1) 1.0764; (P) 1.0791 (R1) 1.0823; More.....
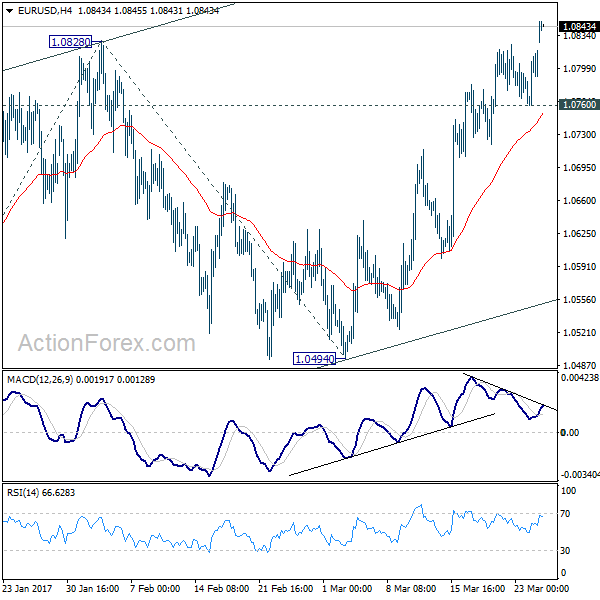
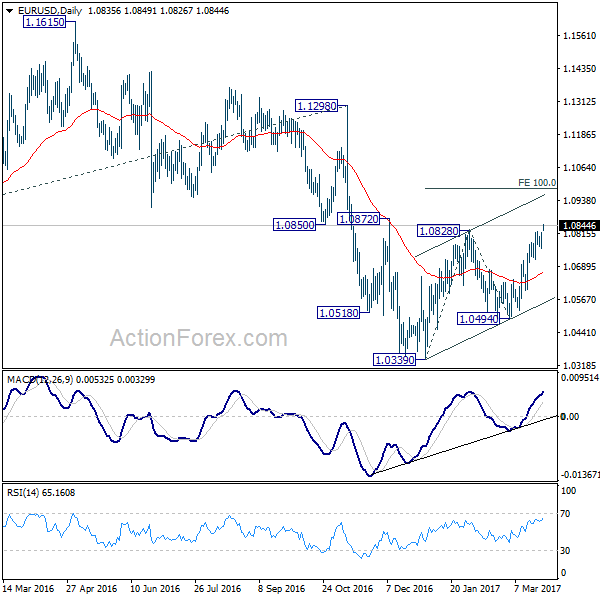
EUR/USD's rise from 1.0339 resumed by taking out 1.0828 resistance and reaches as high as 1.0849 so far. Intraday bias is back on the upside. Next target will be 100% projection of 1.0339 to 1.0828 from 1.0494 at 1.0983. However, as rise from 1.0339 is seen as a corrective move. We'd expect upside to be limited by 1.0983 to complete the correction. On the downside, break of 1.0760 minor support will turn bias to the downside for 1.0494 support first.
In the bigger picture, as long as 1.1298 key resistance holds, whole down trend from 1.6039 (2008 high) is still expected to continue. Break of 1.0339 low will send EUR/USD through parity to 61.8% projection of 1.3993 to 1.0461 from 1.1298 at 0.9115. However, considering bullish convergence condition in weekly MACD, break of 1.1298 will indicate term reversal. this would also be supported by sustained trading above 55 week EMA.
GBP/USD Daily Outlook
Daily Pivots: (S1) 1.2453; (P) 1.2487; (R1) 1.2506; More...
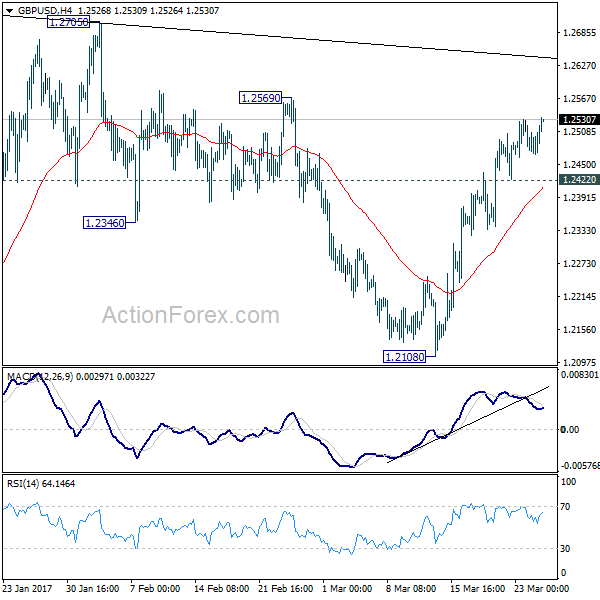
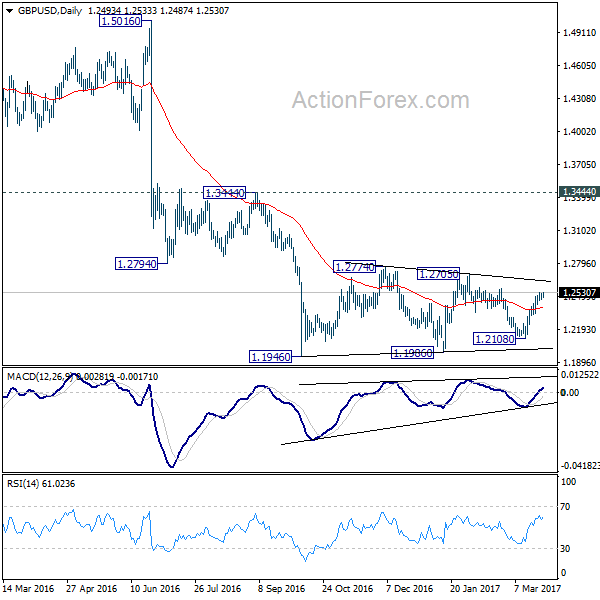
GBP/USD's rise resumed by taking out 1.2530 and intraday bias is turned back to the upside. Rebound from 1.2108 would target 1.25689 resistance first. Break will target 1.2705/74 resistance zone. Such rise is seen as part of the consolidation pattern from 1.1946. We'd expect upside to be limited by 1.2705/2774 to bring down trend resumption eventually. On the downside, below 1.2422 minor support will turn bias back to the downside for 1.2108 support first. Though, sustained break of 1.2774 will extend the rise towards 1.3444 key resistance level.
In the bigger picture, fall from 1.7190 is seen as part of the down trend from 2.1161. There is no sign of medium term reversal yet. Sustained trading below 61.8% projection of 2.1161 to 1.3503 from 1.7190 at 1.2457 will target 100% projection at 0.9532. Overall, break of 1.3444 resistance is needed to confirm medium term bottoming. Otherwise, outlook will remain bearish.
USD/JPY Daily Outlook
Daily Pivots: (S1) 110.79; (P) 111.14; (R1) 111.65; More...
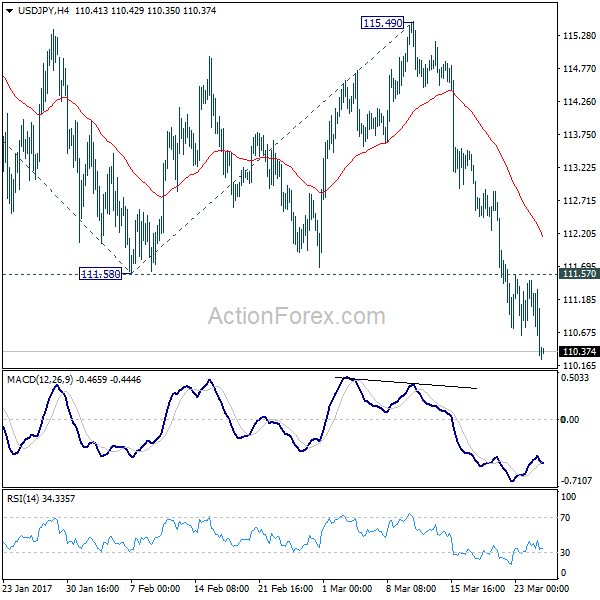
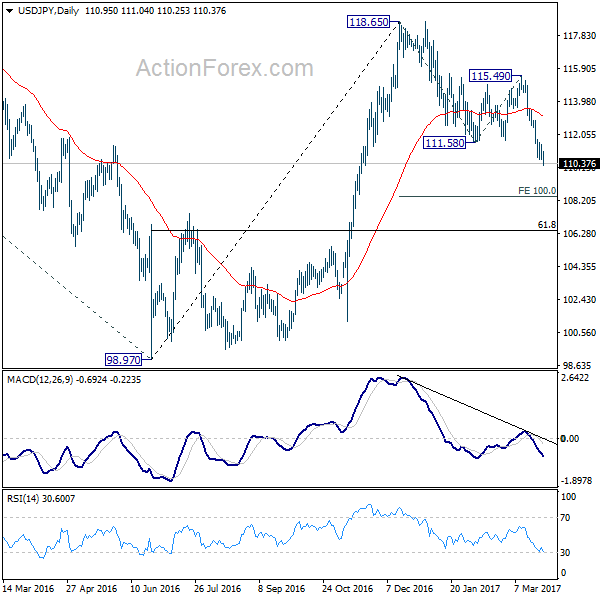
USD/JPY's fall resumed by taking out 110.62 and reaches as low as 110.25 so far. Current development suggests that decline from 118.65 is deeper than originally expected. Intraday bias is turned back to the downside for 100% projection of 118.65 to 111.58 from 115.49 at 108.42 and possibly below. On the upside, above 111.57 minor resistance will turn bias neutral first. But near term outlook will stay mildly bearish as long as 115.49 resistance holds.
In the bigger picture, price actions from 125.85 high are seen as a corrective pattern. sustained trading below 55 week EMA (now at 111.11) will indicates that such consolidation is not completed. And another fall would be seen back to 98.97 as the third leg. In that case, downside would be contained by 61.8% retracement of 75.56 to 125.95 at 94.77 to complete the correction. On the upside, above 115.49 will extend the rise from 98.97 to retest 125.85 first. Overall, up trend from 75.56 is expected to resume after the consolidation from 125.85 completes.
Weekly Report: Energy, Commodities, Indices, Forex
ENERGY
US Oil remained in red last week after recovery attempts were capped under psychological $50 per barrel resistance, as hopes that output cut agreed between OPEC and non-OPEC oil producers was offset by persistently high crude inventories. Oil producers agreed to curb production by 1.8 million barrels per day, from Jan 1 for six months, in order to drain record stockpiles, but inventories remain high.
WTI oil price was in stable descend from the beginning of the week, with spikes higher on concerns over North Korea's missile launch and weaker US dollar, being short-lived.
American Petroleum Institute (API) report released on Tuesday showed that crude stocks rose by 4.5 million barrels at the end of last week, in larger than expected build.
The report from Energy Information Administration (EIA), released on Wednesday, confirmed strong build of crude stock that reached fresh record at 533.1 million barrels, after weekly stocks rose 5 million barrels nearly double of expectations for 2.8 million barrels build.
US oil traded in a choppy and wide-range mode on Tuesday and Wednesday, hitting weekly high at $49.46 per barrel and low of the week at $47.08 per barrel, when the price retested Mar 14 low nearly four-month low.
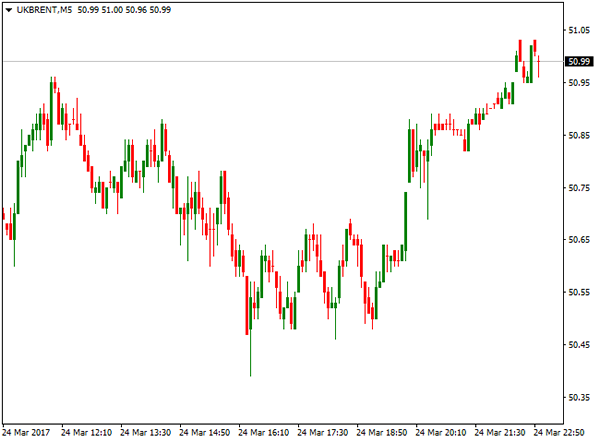
Brent oil contract for May was also pressured by rising crude stocks and failure of OPEC production cut plan to lift oil prices and fell to the lowest level since Nov 30 at $49.70, on the second attempt below psychological $50 per barrel support.
Crude Oil prices maintain negative sentiment after taking out some important technical supports and may extend losses further in the coming sessions.
May Brent oil is targeting technical support at $47.20 per barrel, while WTI contract for April delivery has already dented important technical support at $47.20 per barrel and can extend weakness towards $45 per barrel zone.
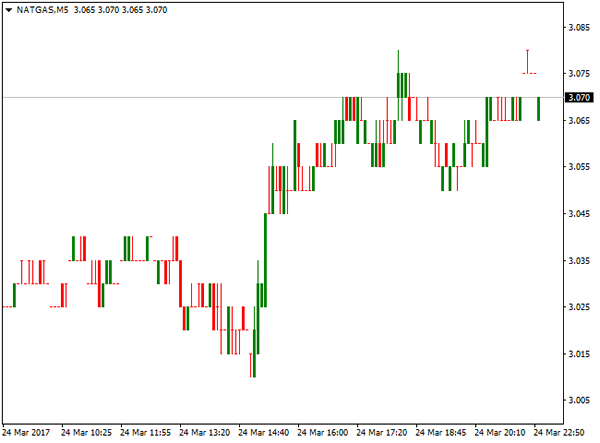
Natural gas contract for April delivery registered strong gains at the beginning of the week, hitting the highest level since February, after forecasts showed cooler weather on the way that boosted the price.
The price hit the weekly high at $3.105 per million BTU on weather forecast, but pulled back on forecasts for warmer weather, ahead of Natural Gas Storage report.
Data released on Thursday showed draw in draw of 150 billion cubic feet that was in line with forecasts. Natural gas price returned above $3.000 per million BTU, after support was cracked on dip to $2.980 just before data release.
Despite warmer weather that is expected to drop gas demand to 84 billion cubic feet per day, traders were more focused on high stockpiles, low production and rising exports as key factors that direct natural gas price.
COMMODITIES
Spot gold benefited from weaker dollar last week and rose around$20 for the week. Increased risk-off sentiment in the markets came after Chicago Fed President Evans reinforced perception, introduced after Fed's last policy meeting that the US central bank will not accelerate the pace of interest rate hike.Dovish stance from US policymakers about interest rates and global political uncertainty, triggered strong appetite for safe-haven assets. This was also one of the reasons why gold fell after Fed increased rates in mid-March, moving against logic that interest rate sensitive asset usually gets under pressure on increase of interest rates.
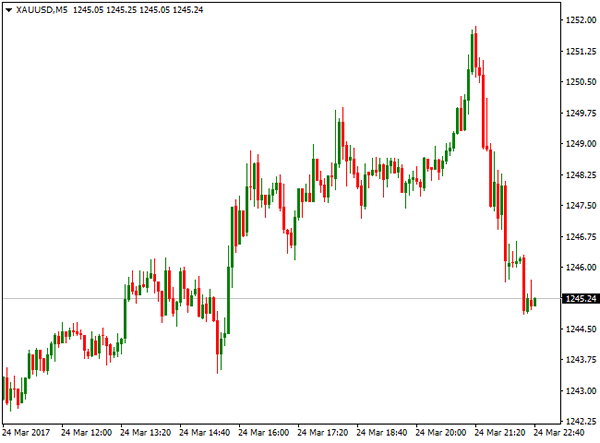
This time it was not the case. The US dollar has already seen quite strong rally before FOMC meeting and soft tone from the statement prompted investors to take their profits and send the greenback significantly lower across the board. Gold gained pace on such move and boosted by safe-haven buying, peaked at $1253, the highest traded since end of February and also ending the second consecutive week positively. Technical studies in bullish mode also support the rally, as gold is now not far from its short-term targets at $1260/63. Consolidation which is expected to precede next move higher, is likely to hold above supports at $1240 and $1230, as gold pulled back in late Friday after Republican leader in House of Representatives pulled Healthcare plan that was the one of top events of last week from voting, due to shortage of votes that temporarily boosted the dollar and sent gold prices lower.
Gold future contract for April delivery was up from $1226, weekly low, posted on Tuesday, to the highest traded last week at $1253, posted on Thursday. Strong bullish sentiment that pushed the price significantly higher persists, however, technical studies suggest consolidation in coming sessions.
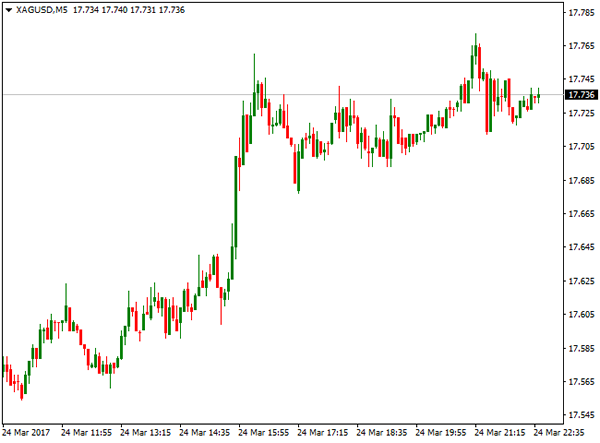
Spot Silver remained in strong ascend last week, running from $1732 low to the high of the week at $17.72 on Friday. Bullish technicals maintain positive outlook for extension towards short-term target and technical barrier at $18.00.
Silver future contract for delivery in May was up 2.6% for the week, on rally from $17.33 to week's high at $17.78.
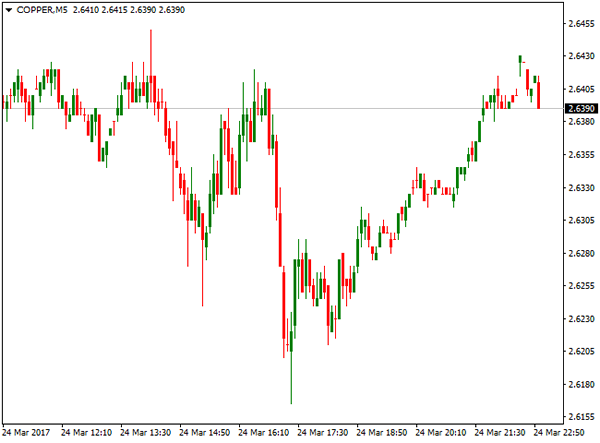
Copper contract for May delivery ended week with loss of nearly 2%, as workers in world's top copper mine in Chile agreed to resume work ending concerns on supply. Recent strikes and lower production in the biggest mines affected copper price that peaked at $2.6975 at the beginning of the week but reversed gains during the week, trimming gains in 2017.
Commodity markets are eyeing decisions of President Trump, regarding increase spending in infrastructure that has driven commodities significantly higher since November, after Trump highlighted this as one of his priorities after election.
INDICES
US Stocks fell significantly on Tuesday, with global stocks following and maintaining negative sentiment, rising concerns about President Trump's pro-growth policies and signals that Increase in US interest rates is losing the pace, prompted investors into safe-haven Treasuries and Gold.
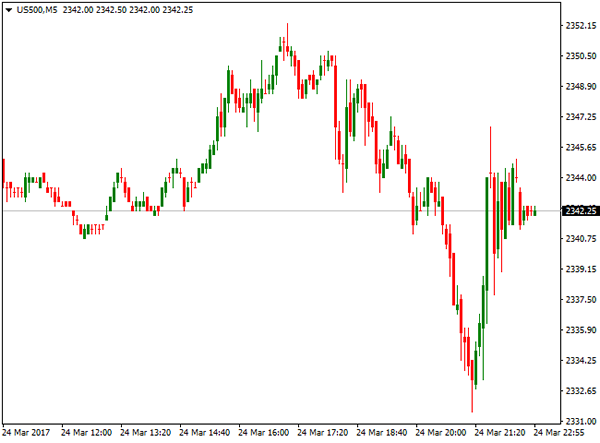
US benchmark indices were significantly lower on strong sell-off. S&P Contract for June delivery posted the biggest one-day loss since 11 Oct 2016, falling 1.2%, while S&P financial sector was down 3.1% on Tuesday.
Dow Jones contract for June registered the same losses, while Nasdaq100 June contract was down 1.5%.
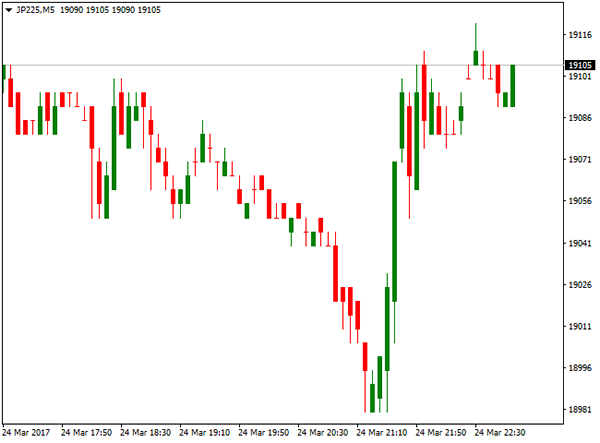
Losses extended into Far East and European stocks on Wednesday, with Japan's Nikkei 225 index being down on Wednesday and extended losses of 1.35% previous day.
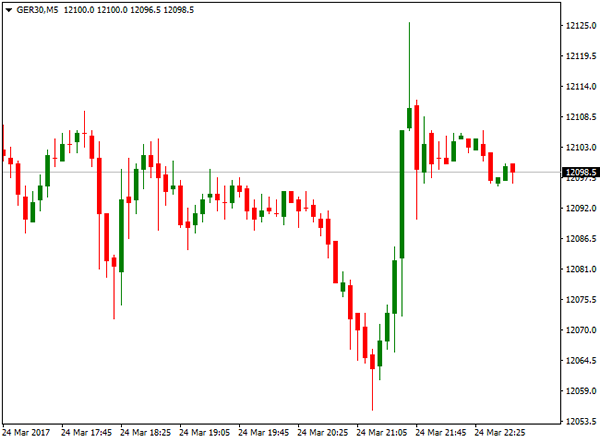
European indexes remained under strong pressure on Wednesday. German DAX hit fresh three-week low after loss of 1.3% previous day.
From the US Indexes, Dow Jones and S&P 500 remained in tight ranges just above weekly lows, while Nasdaq100 was slightly higher at the end of the week. However, all three US benchmarks ended week in red.
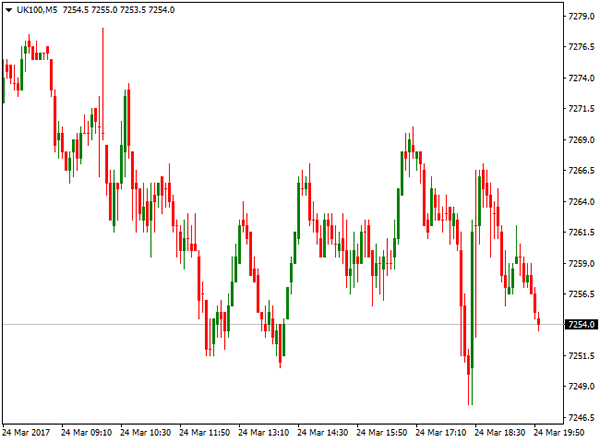
Britain's FTSE 100 Index also ended week in negative mode, on extension of pullback from previous week's fresh all time high. FTSE was dragged by fall of global stocks and stronger British pound, but price action was also strongly influenced by terrorist attack in London, as well as growing uncertainty over Brexit, as official beginning of final divorce process is set for March 29, when UK PM Theresa May will trigger the Article 50.
UK airlines were among the first to be hit on EU warning that UK airlines may need to move their headquarters to Europe and sell their shares to European nationals if the want to continue to fly internal EU routes after Brexit.
This is the first sector of FTSE 100 that came at risk, however, other sectors may be hit by new EU's deal for UK companies to operate in the union after Brexit.
FOREX
EURUSD ended fourth consecutive week positively and hit levels above 1.0800 barrier, the highest since early February. The single currency rallied strongly on Tuesday, gaining 0.65% for the day, after French presidential candidate Macron won the first TV debate. This has sidelined growing concerns about the victory of far-right candidate Marine Le Pen and fears of possible exit from the EU bloc that Le Pen highlighted in her campaign.
The Euro gained strong bullish momentum also on weaker dollar and held stable near 1.0800 handle, after hitting weeks high at 1.0824 and keeping in focus targets at 1.0863 and 1.0888.
Bullish technical studies are supportive for Euro, with corrective actions expected to hold above strong supports at 1.0700 zone to keep bullish sentiment in play.
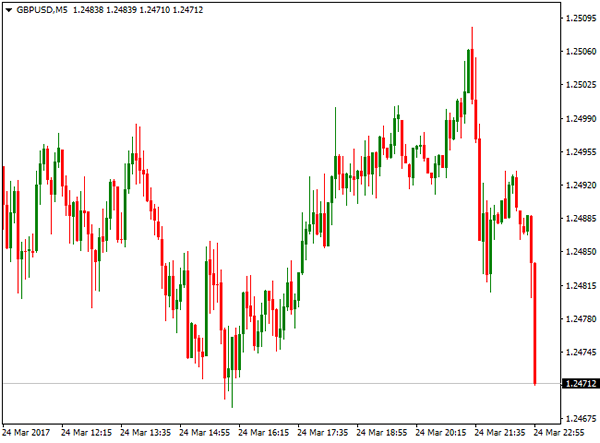
GBPUSD hit weekly high at 1.2530, remaining steady after London's attack and being supported by weaker US dollar. The pair received strong support from upbeat inflation numbers. CPI rose by 2.3%, well above forecasted levels, marking the biggest annual increase in nearly 3 ½ years, pushed by global oil prices increase and the impact of Brexit vote.
The pound also enjoyed support on speculations that BoE may hike rates earlier after one of BoE's policymakers voted to raise interest rates from record lows on growing inflation and UK economy's resilient response so far on Britain's decision to leave the European Union.
Overall bullish technical studies are also supportive for pound, with solid supports at 1.2400 zone seen ideally holding corrective actions.
Sterling is now turning focus towards next week's official start of divorce process from the EU.
AUDUSD came under pressure and fell around 1% last week and ended week in red after larger bulls were capped at 0.7647. Australian central bank said in minutes of March 7 meeting released on Tuesday, that risk is building in housing sector that was one of reasons to keep rates steady.
Current easing of the Aussie dollar could be seen as technical correction, as prevailing tone remains bullish, with the pair facing strong resistance at 0.7740 zone, where two attempts to break higher failed so far.
On the other side, solid supports at 0.7500 zone should keep consolidative phase limited to prevent risk of stronger correction.
Weaker US dollar continues to boost its Australian counterpart for now.
USDCAD managed to recover after strong fall earlier this week and end week positively. The pair traded within 1.3263 and 1.3408 range during the week and bounced from 1.3263 low, the lowest in past three weeks, hit by Canada's stronger-than-expected retail sales data. Retail sales jumped 2.2% in January, well above forecasted 1.1% increase.
USDJPY ended the second consecutive week in red, as the dollar remains under pressure and investors moved into safe-haven yen on fresh risk-off mode.
The pair hit weekly low at 110.60, coming closer to its target at psychological 110.00 level, but further losses were so far on hold, as the pair faced strong technical support that so far counteracted broader bears.
Friday's close was the first positive after eight straight days in red that may signal extended consolidation with upticks, before broader bears resume.
Foreign Exchange Market Commentary
EUR/USD
The American dollar closed the week mixed, down against most of its major rivals, but those related to commodities, as speculative interest focused last week in unwinding the so-called "Trump-trade." Equities in the US had their worst week since last September, extending their early week decline on Friday after the US President Trump Obamacare repeal bill was pulled back by Republicans, after failing to gather enough support from the Congress. Trump made a quick statement in the Oval Office afterwards, announcing that his party will probably work on the tax reform now, which partially offset dollar and equities' decline. The EUR/USD pair closed the week around 1.0800, not far from this year high of 1.0828.
In the data front the week was quite light, with March preliminary Markit PMIs taking center stage. In Europe, estimated for the current month beat expectations and final February figures, indicating that the strong pace of growth in the region seen late 2016 continues to accelerate. According to the official report, the Eurozone economic growth reached a six-year high, with the Composite PMI up to 56.7 from 56.0 in the previous month. On the contrary, the US private sector expanded at its slowest pace for six months in the US, as the Markit Composite PMI came in at 53.2, from 54.1 in February.
From a technical point of view, the EUR/USD pair has been contained by a major mid-term resistance, the 1.0820 level which represents the 50% retracement of the post-US election's decline, although pullbacks from the area have been quite shallow, which implies a high risk of a bullish breakout. In the daily chart, the Momentum indicator maintains its bullish slope, now within overbought territory, whilst the RSI indicator consolidates around 62, reflecting the latest range-bound trading. In the same chart, the 20 DMA heads north below the current level after crossing above the 100 DMA, all of which supports additional advances, particularly on an upward extension beyond the 1.0820/30 region. Shorter term, the 4 hours chart shows that the price has settled a few pips above a horizontal 20 SMA, whilst technical indicators lack directional strength, also reflecting the latest lack of directional strength rather than suggesting buying exhaustion.
Support levels: 1.0765 1.0730 1.0700
Resistance levels: 1.0830 1.0870 1.0910
USD/JPY
The USD/JPY pair fell to a fresh yearly low of 110.63 last Friday, undermined by poor US data and news that the US government pulled back from the Congress the healthcare bill, before facing a defeat, as the Republicans were unable to gather enough support. The pair however, bounced some 60 pips, and closed the week in the 111.30 region, as risk aversion eased following Trumps speech in the Oval Office, announcing that they will now focus on the tax reform. Wall Street bounced from its lows after the news, whilst US Treasury yields also recovered some ground, but anyway closed in the red for a second consecutive week. Also weighing on the pair was a tepid advance in US Durable Goods Order in February, and worse-than-expected flash Markit PMIs, showing the slowest pace of expansion in six months. Japan will release its latest inflation figures this upcoming Thursday, alongside with preliminary industrial data for March and employment figures for February. The pair is still at risk of falling further, as in the daily chart, it settled well below its 100 SMA, now flat around 114.50, whilst the Momentum indicator maintains is bearish slope within bearish territory, and the RSI indicator is barely bouncing from oversold readings, now around 33. Furthermore, the pair has met selling interest around 111.60, where the pair bottomed multiple times earlier this year. In the 4 hours chart, technical indicators have bounced from oversold readings, and the Momentum indicator heads north above its mid-line, but the price remains well below its 100 and 200 SMAs, both converging around 113.30/40. The upward corrective movement can extend up to 112.00, a major Fibonacci resistance, without actually affecting the dominant bearish trend. Renewed selling interest below 111.00 should favor a steeper decline towards 109.90, the 50% retracement of late 2016 monthly rally.
Support levels: 111.00 110.70 110.30
Resistance levels: 111.60 112.00 120.45
GBP/USD
The GBP/USD pair fell on Friday, but advanced for a second week in-a-row, settling at 1.2470. The Pound got a boost last Tuesday, following the release of higher-than-expected UK inflation figures, exacerbated by broad dollar's weakness ever since the week started. Nevertheless the pair was unable to advance to retake the 1.2500 level, despite multiple intraday attempts to break higher. Attention this week will center in PM May's announcement of the beginning of Brexit, as the UK government will trigger the art. 50 of the Lisbon treaty this Wednesday. News released over the weekend showed that the Labour Party will announce its conditions for backing any deal with the EU this Monday, anticipating that they would only support a deal that has the ‘exact same benefits’ as the single market, raising the bar for May's negotiations. Still early to speculate on the outcome, the UK will indeed face a rough couple of years from now on. The pair topped this past week at 1.2530, 10 pips shy of the 23.6% retracement of the January's rally, and the daily chart shows that technical indicators have lost their upward strength, but remain near overbought territory, whilst the price is well above a modestly bullish 20 SMA, indicating that the pair may extend its bearish move, particularly if the mentioned 1.2530/40 region continues to cap the upside. In the 4 hours chart, the price broke below its 20 SMA for the first time since mid March, while technical indicators have turned south, currently around their mid-lines, supporting a downward extension. 1.2425 is the 38.2% retracement of the mentioned rally, and a break below it will likely result in a steeper decline towards 1.2330/50.
Support levels: 1.2425 1.2380 1.2340
Resistance levels: 1.2500 1.2540 1.2585
GOLD
Spot gold closed the week with gains at $1,243.59 a troy ounce, marginally lower on Friday, despite dollar and stocks' decline. The bright metal trimmed its intraday gains on the last day of the week, following the late bounce in US stocks, and after failing to advance beyond its weekly high. Gold peaked at $1,253.20 a troy ounce on Thursday, after the US Congress announced the delay in the vote of the healthcare reform bill. Still, the commodity retreated sub-1,250.00, a major psychological level that gold seems unable to surpass. Technically, the daily chart shows that the commodity closed with a doji for a third consecutive day in-a-row, below and also below its 200 DMA. In the same chart, the Momentum indicator maintains a bullish slope within positive territory, whilst the RSI indicator consolidates around 61, as the price stands well above its 20 and 100 DMAs, all of which limits chances of a steeper decline, particularly as the market has already digested the fact that the US Federal Reserve will likely raise rates two more times this year and that is no longer a key factor in price´s action. In the 4 hours chart, the price settled below its 20 SMA, whilst the Momentum indicator entered bearish territory, and the RSI indicator pulled back sharply from overbought readings, supporting a short term downward corrective move on a break below 1,240.93 Friday's low and the immediate support.
Support levels: 1,240.90 1,233.25 1,224.40
Resistance levels: 1,253.20 1,263.80 1,272.80
WTI CRUDE
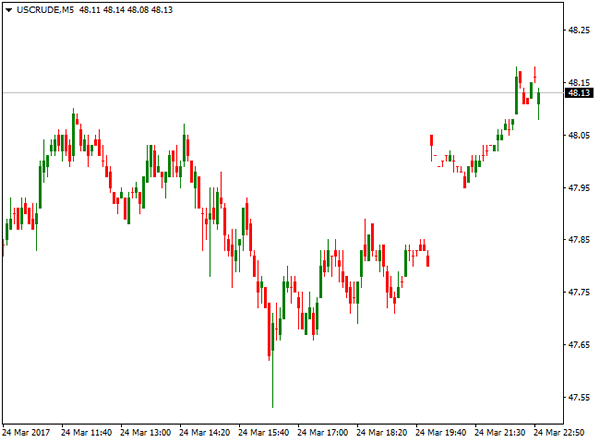
Crude oil prices closed the week with losses, with West Texas Intermediate crude futures settling at $48.13 a barrel, having flirted with the 47.00 threshold earlier in the week, the lowest since the OPEC announced its output cut deal. There were no major news in the oil market this past week, although this Sunday, five representatives of OPEC and non-OPEC countries that signed the output agreement—Kuwait, Algeria, Venezuela, Russia and Oman—meet in Kuwait to review the current level of compliance, and any headline coming from the meeting will likely affect oil prices. The daily chart shows that the price remained well below its moving averages, with the 20 DMA maintaining a strong bearish slope around 49.85, whilst technical indicators have bounced from oversold territory, but remain well below their mid-lines, maintaining the risk towards the downside. In the 4 hours chart, the price ended a few cents above a bearish 20 SMA, while technical indicators have corrected higher, but lost upward momentum within neutral territory, in line with the longer term outlook.
Support levels: 47.80 47.00 46.40
Resistance levels: 48.30 48.80 49.50
DJIA
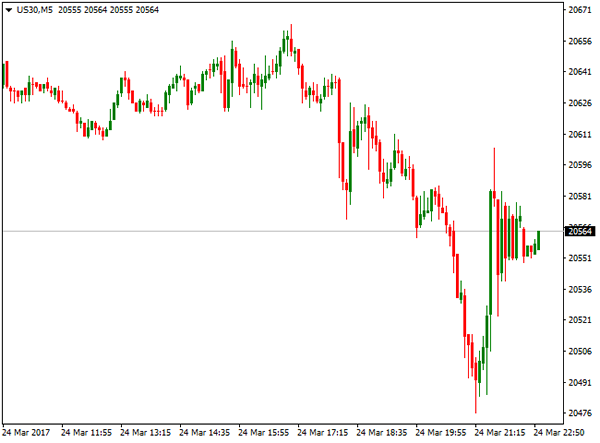
Wall Street closed mixed on Friday, after the ruling Republican party pulled out the healthcare bill amid lack of support. The Dow Jones Industrial Average settled at 20,596.72, down 0.29% or 59 points, while the S&P lost 2 points, to 2,343.98. The Nasdaq Composite managed to advance 11 points, and closed at 5,828.74. Indexes plummeted after the news, but bounced off the daily lows, as the healthcare sector turned positive after the news, and following Trump's words that the government will move on towards the tax reform. Within the Dow, Nike led the advance adding 1.79%, followed by American Express that closed 0.46% higher. Goldman Sachs was the worst performer, down 1.5%, followed by El du Pont that shed 1.19%. The technical picture for the index is bearish according to the daily chart, as the index extended its decline further below a now bearish 20 DMA, whilst technical indicators have turned south within bearish territory, with the RSI indicator heading south at 39 and anticipating some further declines. In the 4 hours chart, the index met selling interest on approaches to a bearish 20 SMA, currently at 20,659, while the Momentum indicator heads modestly lower below its 100 level, whilst the RSI indicator consolidates around 35, maintaining the risk towards the downside.
Support levels: 20,578 20,528 20,467
Resistance levels: 20,648 20,707 20,742
FTSE 100
The FTSE 100 closed at 7,336.82 last Friday, down on the day 0,05% or roughly 4 points, to its worst week since mid January. Investors were cautious ahead of the US Congress decision on the healthcare bill. Smiths Group led the way higher, adding 2.89% after the company said that its pretax profit more than doubled I the six months to January 31st. Smurfit Kappa led decliners, ending the day 3.16% lower, followed by Ashtead Group that shed 2.43%. Mining-related equities closed mixed, with Randgold Resources making it to the top 10 list, closing 0.92% higher. The daily chart for the index shows that it remained capped by a modestly bullish 20 DMA for a third consecutive day, but closed not far below, whilst technical indicators remain flat within neutral territory, not enough to confirm further declines ahead. In the 4 hours chart, the 20 SMA heads lower above the current level, around 7,357, providing an immediate resistance. In the same chart the Momentum indicator heads higher within negative territory, but the RSI indicator remains flat around 42, reflecting the ongoing range bound trading.
Support levels: 7,301 7,262 7,239
Resistance levels: 7,357 7,392 7,447
DAX
European equities closed generally lower on Friday, although the German DAX managed to add 24 points or 0.20% and settled at 12,064.27. Trading was choppy in the region, as investors were waiting for the US Congressional decision over the healthcare bill. Supporting the German benchmark was the release of March preliminary PMIs, as according to Markit, the private sector in the country grew as its strongest pace in over five years, with the Composite PMI estimated at 57.0 from 56.8 in February. Infineon Technologies was the top performer, adding 8.97%, after the company said that it increased the outlook for revenues for the full 2017 fiscal year. RWE AG followed, closing up 1.75%. Deutsche Bank on the other hand led decliners, ending the day 1.27% lower. The daily chart for the index shows that it managed to advance further above a bullish 20 SMA, whilst technical indicators turned north after a failed attempt to break lower, supporting additional gains ahead. Shorter term, and according to the 4 hours chart, the risk is also towards the upside, as the benchmark settled above all of its moving averages, whilst technical indicators present modest upward slopes after entering bullish territory.
Support levels: 12,028 11,976 11,928
Resistance levels: 12,091 12,139 12,177
Market Morning Briefing
STOCKS
Global indices look bullish in the near term except the Dow which could possible test some more levels on the downside before pausing.
Dow (20596.72, -0.29%) could possibly be on the verge of breaking below the daily channel support. The resistance on the 3-day and weekly candles seems to be holding good for now and while that holds, we could see a test of 20400-20000 levels in the near term.
Dax (12064.27, +0.20%) is clearly trading within the upward channel on the daily candle chart and while that holds, we could see the index move up in the near term. Immediate target if 12200 on the upside. Near term looks bullish.
Nikkei (18983.19, -1.45%) may continue to remain indecisive while it trades within the broad sideways range of 18600-19600. A bounce from current levels could be expected in case, Dollar-Yen also bounces back from immediate support. (Refer FOREX section below)
Shanghai (3275.78, +0.19%) has risen in line with our expectation almost heading towards our first target of 3300. A break above 3300 could take it towards resistance near 3400. Near term looks bullish.
Nifty (9108, +0.24%) bounced back well in the last sessions and could continue to move up towards 9200 and higher in the near term.
COMMODITIES
Fresh weakness in Dollar index (99.30) has boosted bullion significantly. Gold (1256) has broken its bearish channel resistance (since Sep 16) at 1248-50 and could move towards 1267 and 1307 respectively.
Similar kind of chart has been formed in silver (17.89) also as it is trading ab resistance around above its pivot of 17.45. The possibility of a rise towards 18.33 levels can’t be ruled out.
Copper (2.60) is trading within a range of 2.57-2.70. Only above 2.70, higher resistances of 2.80 can come into consideration. In the medium term 2.55-57 are going to be a strong support now and a close below that could open up 2.55 and 2.49 levels respectively.
Oil prices dipped again as rising U.S. drilling activity outweighed talks that an OPEC-led production cut initially due to end in mid-2017 may be extended. We think that prices may receive some support (Specially Brent at $50) from talks between OPEC and other producers, including Russia in order to prop up the market. Considering the short term oversold sate in Brent (50.75) and WTI (47.34), we may see some profit taking rally towards their respective resistances of 52-53 for Brent and 48.50-49.80 for WTI respectively. But the trend is still bearish in the near to medium term time frame. Any corrective bounce may face selling pressure at the higher levels.
FOREX
The collapse of the healthcare bill legislation by the Republicans not only signalled a setback for Trump but raised questions about the ability of the President fulfil his other promises including a boost in the infrastructure spending and tax cuts. Not a good position for Dollar.
Dollar Index (99.29) is very close to the major support area of 99.00-98.50 as expected and some short covering from the area leading to a bounce towards 100.00-40 this week can’t be ruled out.
Euro (1.0845) is trading right at the resistance of 1.0850 following a bounce from our support 1.0750 and now may rise past 1.0850 for 1.1000 in the next few sessions, negating the immediate bearish possibilities.
Dollar-Yen (110.39) has turned out to be more impatient than expected as it continues its decline without any consolidation. Sustained trading below 110.50 may drag it down to 109.40 and 108.50 soon with resistance coming at 111.50.
Pound (1.2524) continues its gradual rise towards 1.2650-1.2700 with near term support unchanged at 1.2440-20.
Aussie (0.7625) is holding above the support of 0.76 as expected and may continue sideways trading in the range of 0.7600-0.7750 for a couple of sessions more.
Dollar Rupee (65.52) is trading at 65.40 in the NDF, almost at the midpoint of our range 65.20-70 which may remain intact for the week.
INTEREST RATES
The German-Us 2YR (-1.97%) is heading towards near term channel resistance near -1.95% and could possibly come off from there in the near term. But looking at the German-US 10YR (-1.96%) which has broken above the horizontal resistance coming from Mar’15 there is enough room on the upside. Although there is lack of clarity just now, but if the 2Yr yield spread come off, the upside for Euro could be limited in the near term.
The US yields have broken below the immediate support levels and are headed lower. The 5Yr (1.90%), 10Yr (2.37%) and the 30YR (2.98%) have all fallen and could test 1.80%, 2.30% and 2.90% respectively.
The UK 10-5YR (0.57%) is falling sharply and could be headed towards 0.50% in the near term.
The German yields are in a pause mode and could possibly come off in the near term. The 5Yr (-0.31%), 10Yr (0.41%) and the 30Yr(1.14%) are slightly higher but could possibly come down again in the coming sessions.