Sample Category Title
GBP/USD Mid-Day Outlook
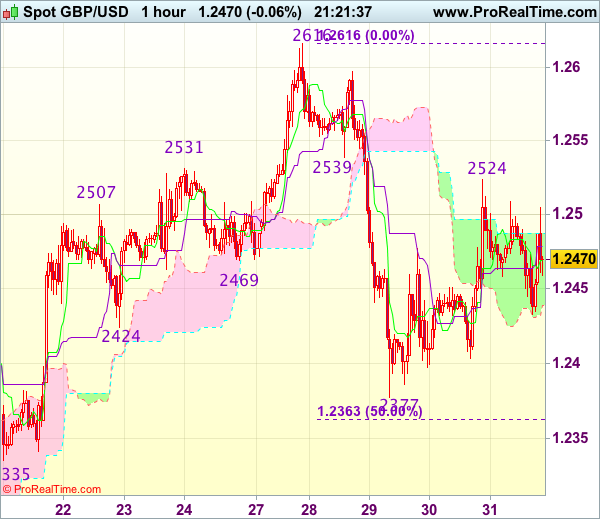
Daily Pivots: (S1) 1.2405; (P) 1.2465; (R1) 1.2527; More...
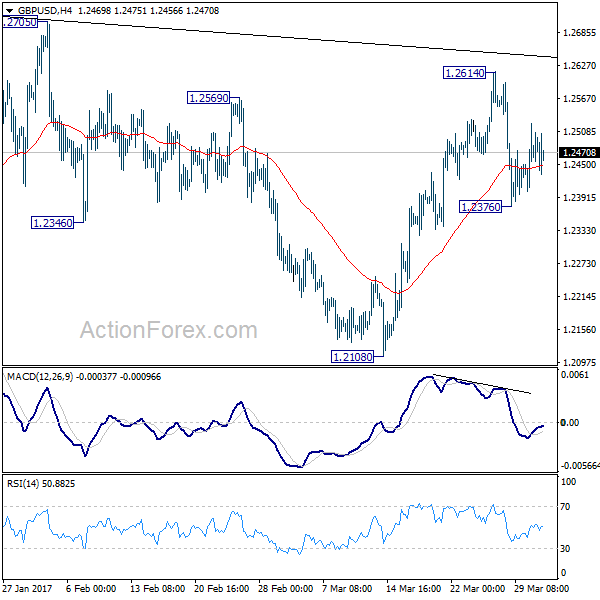
Intraday bias in GBP/USD remains neutral for the moment. Break of 1.2614 will extend the rise from 1.2108. Overall, price actions from 1.1946 are viewed as a consolidation pattern pattern. Upside should be limited by 1.2705/2774 resistance zone to bring larger down trend resumption eventually. On the downside, below 1.2376 will target 1.2108 support next. Break there will be an early sign of larger down trend resumption.
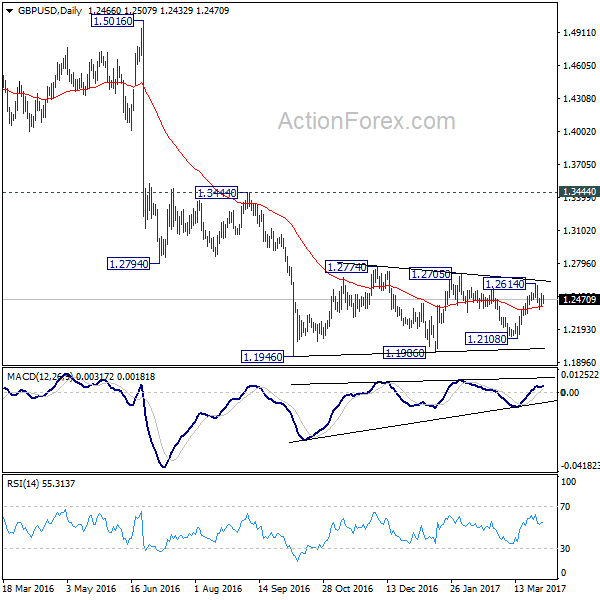
In the bigger picture, fall from 1.7190 is seen as part of the down trend from 2.1161. There is no sign of medium term reversal yet. Sustained trading below 61.8% projection of 2.1161 to 1.3503 from 1.7190 at 1.2457 will target 100% projection at 0.9532. Overall, break of 1.3444 resistance is needed to confirm medium term bottoming. Otherwise, outlook will remain bearish.
Trade Idea Update: USD/CHF – Buy at 0.9950
USD/CHF - 1.0002
Original strategy :
Buy at 0.9950, Target: 1.0050, Stop: 0.9915
Position : -
Target : -
Stop : -
New strategy :
Buy at 0.9950, Target: 1.0050, Stop: 0.9915
Position : -
Target : -
Stop : -
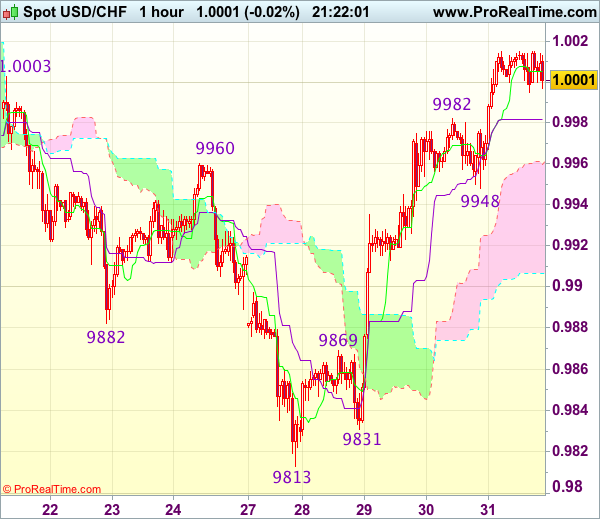
As the greenback has surged again after finding renewed buying interest at 0.9948 yesterday, adding credence to our view that recent decline has ended at 0.9813 and bullishness remains for the rise from there to extend further gain to 1.0030, then towards previous support at 1.0060 (now resistance), however, near term overbought condition should limit upside and price should falter below resistance at 1.0109, risk from there is seen for a retreat later.
In view of this, would not chase this rise here and would be prudent to buy dollar on pullback as said support at 0.9948 should limit downside. Below 0.9910-15 would abort and signal top is formed instead, bring correction to 0.9880 but reckon previous resistance at 0.9869 would hold from here.
Canadian Dollar in Holding Pattern Ahead of GDP
USD/CAD has edged higher in the Friday session. Currently, the pair is trading at 1.3350. On the release front, Canada releases GDP for January, which is expected to remain unchanged at 0.3%. In the US, today's highlight is UoM Consumer Sentiment, with the estimate standing at 97.8 points.
What's next for the Bank of Canada? On Tuesday, BoC Governor Stephen Poloz hinted that the BoC would not be raising interest rates in the near future, saying that the Canadian economy had not yet recovered from the huge drop in oil prices. He added that raising interests rates back to "normal" would have a negative effect on the economy and would likely trigger a recession. The last time the BoE raised rates was in 2010, and analysts don't forecast another hike before 2018. President Trump's "America first" stance is a serious concern for Canada, which is heavily reliant on open trade. Poloz criticized Trump's protectionist agenda, saying that "protectionism does not promote growth and its costs are steep".
Since Donald Trump assumed office in January, his administration has been beset by controversy and crises. Trump has yet to provide any details of an economic policy, much to the consternation of the markets. Last week, Trump's proposed healthcare bill was dead on arrival before even being voted on, a humiliating defeat for the president. This setback has made the markets even more jittery about Trump, and the inquiry into the Trump administration's links with Russia is gathering steam, which is another cause for concern for nervous investors. Trump has said he will now focus on tax reform, but the White House will need to improve coordination with Republican lawmakers to ensure that his next attempt to pass legislation is not a repeat of the healthcare debacle.
Trade Idea Update: GBP/USD – Stand aside
GBP/USD - 1.2465
New strategy :
Stand aside
Position : -
Target : -
Stop : -
Although cable has retreated after yesterday’s rise to 1.2524 in part due to cross-trading in sterling and consolidation below said resistance would be seen, break of 1.2400 is needed to revive bearishness and signal the rebound from 1.2377 has ended at 1.2524, bring retest of 1.2377 (this week’s low) first, otherwise, further choppy trading would take place and risk of another rebound remains.
In view of this, would not chase this fall here and would be prudent to stand aside in the meantime. Above 1.2500 would bring another test of 1.2524, break there would bring test of previous support at 1.2539, however, break there is needed to signal the fall from 1.2616 has ended, bring further rise to 1.2555-60 later.
Trade Idea Update: EUR/USD – Sell at 1.0745
EUR/USD - 1.0692
Original strategy :
Sell at 1.0745, Target: 1.0645, Stop: 1.0780
Position : -
Target : -
Stop : -
New strategy :
Sell at 1.0745, Target: 1.0645, Stop: 1.0780
Position : -
Target : -
Stop : -
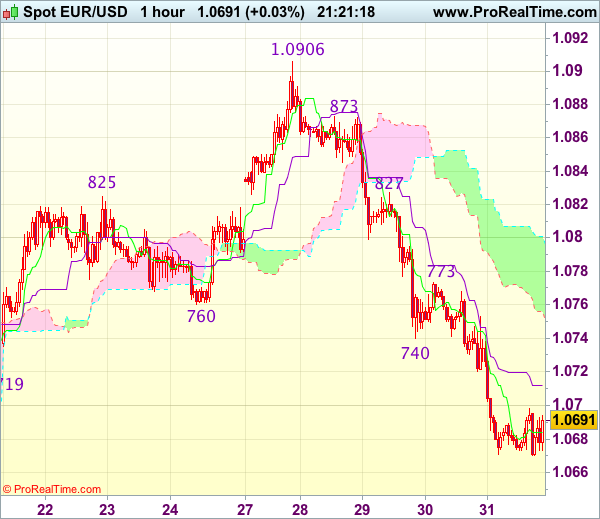
As this week’s selloff has kept euro under pressure, adding credence to our bearish view that top has been formed at 1.0906 and bearishness remains for the decline from there to extend further weakness to 1.0660, then 1.0640, however, near term oversold condition would limit downside and reckon previous strong support at 1.0600 would hold from here, bring rebound later.
In view of this, would not chase this fall here and would be prudent to sell dollar on recovery as 1.0740-50 should limit upside. Only above resistance at 1.0773 would suggest low is formed instead, bring a stronger rebound to 1.0800 but resistance at 1.0827 should remain intact.
EUR/USD Mid-Day Outlook
Daily Pivots: (S1) 1.0727; (P) 1.0777 (R1) 1.0814; More.....
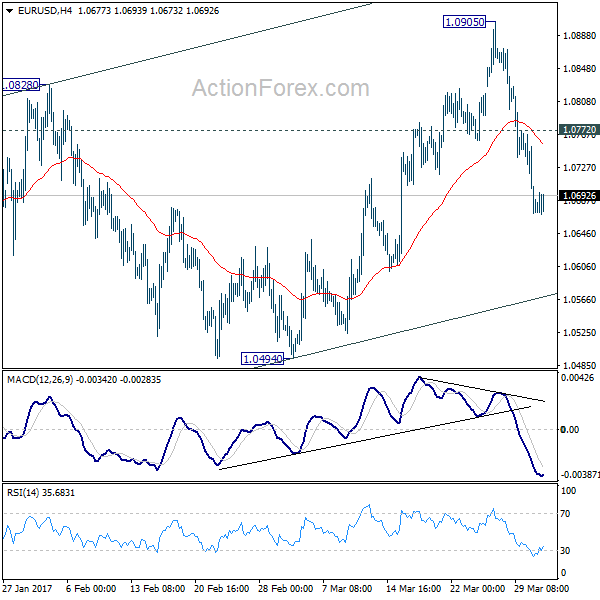
EUR/USD engages in sideway trading in early US session. But intraday bias remains on the downside for far. Current fall from 1.0905 should target 1.0494 support next. As noted before, corrective rise from 1.0339 could be completed at 1.0905. Break of 1.0494 should confirm this case and target 1.0339 low. On the upside, above 1.0798 minor resistance will turn bias back to the upside for 1.0905 instead.
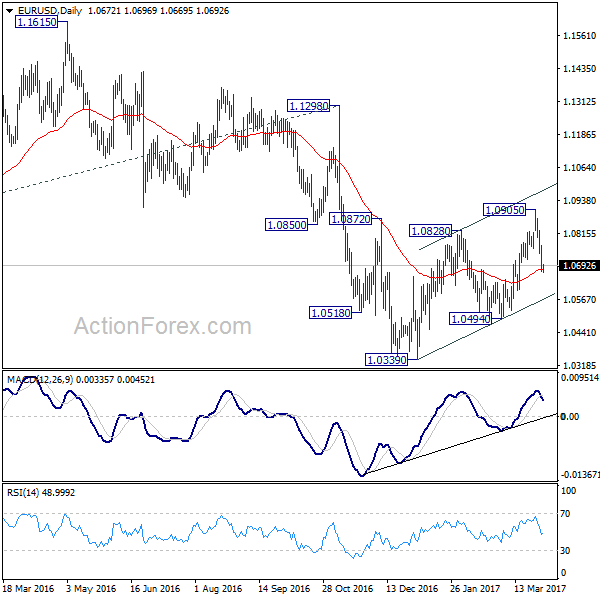
In the bigger picture, as long as 1.1298 key resistance holds, whole down trend from 1.6039 (2008 high) is still expected to continue. Break of 1.0339 low will send EUR/USD through parity to 61.8% projection of 1.3993 to 1.0461 from 1.1298 at 0.9115. However, considering bullish convergence condition in weekly MACD, break of 1.1298 will indicate term reversal. this would also be supported by sustained trading above 55 week EMA.
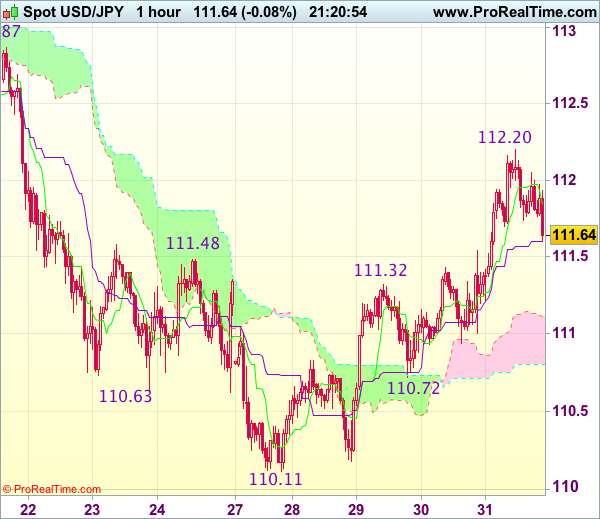
Trade Idea Update: USD/JPY – Buy at 111.30
USD/JPY - 111.65
Original strategy :
Buy at 111.50, Target: 112.50, Stop: 111.15
Position : -
Target : -
Stop : -
New strategy :
Buy at 111.30, Target: 112.30, Stop: 110.95
Position : -
Target : -
Stop : -
As the greenback has eased after intra-day initial rise too 112.20, suggesting minor consolidation below this level would be seen and test of the Kijun-Sen (now at 111.60) is likely, however, reckon previous resistance at 111.32 would contain downside and bring another rise later, above indicated resistance at 112.20-26 would extend the upmove from 110.11 low to 112.50-55 but price should falter below previous resistance at 112.87-90, bring retreat.
In view of this, would not chase this rise here and would be prudent to buy dollar on pullback as 111.25-30 should limit downside. Below the upper Kumo (now at 111.11) would defer and risk test of 110.90-95, break there would abort and signal top is formed instead, bring weakness to support at 110.72, break there would suggest the rebound from 110.11 (this week’s low) has ended, then further fall to 110.45-50 would follow.
Euro to Stay Weak before Close after CPI Miss
Trading is relatively subdued in the forex markets today as the quarter is heading for close. Euro turned into sideway trading but is set to end the week as the weakest major currency. In spite of more Brexit news, Sterling is just mixed for the week, up against Dollar, Europeans and Yen. Canadian dollar continues to be supported by firmness in oil price as WTI crude oil is holding on to 50 handle after brief retreat. Aussie follows as risk appetite returned to the markets. In other markets, European indices are mixed while US futures point to a flat open. Gold lost steam as Dollar rebounds and is heading back to 1240.
EC Tusk lays out four issues for Brexit negotiation
European Council President Donald Tusk set out the guidelines for Brexit negotiation with UK. Tusk said that EU doesn't want to punish UK as "Brexit is punitive enough". But the foremost principle is that talks on trade relationship would only start after the enough progress is made on separation. And a final agreement on trade would not be concluded before Brexit. This is in the opposite to UK Prime Minister Theresa May's parallel approach.
Meanwhile, Tusk also mentioned four issues for the first phase of the negotiation. Those include protecting rights of EU citizens in UK and UK citizens in EU; the bill for Brexit based on financial commitments and liabilities; clear legal framework to avoid uncertainties for businesses and institutions; how to maintain a "soft" border between Ireland and Northern Ireland. Tusk also said that EU would "firmly stand by" the proposals while "the talks which are about to start will be difficult, complex and sometimes even confrontational."
Released from UK, Q4 GDP was revised down to 0.6% qoq, finalized. Total business investment dropped -0.9% qoq. Index of services rose 0.7% 3mo3m in January. Current account deficit narrowed to GBP -12.1b in Q4. Nationwide house price dropped -0.3% mom in March. Gfk consumer sentiment was unchanged at -6 in March.
Eurozone CPI dropped sharply to 1.5% yoy
Eurozone CPI slowed sharply to 1.5% yoy in March, down from 2.0% yoy and missed expectation of 1.8% yoy. Core CPI also slowed to 0.7% yoy, down from 0.9% yoy and missed expectation of 0.8% yoy. The data is inline with recent report that ECB would be cautious to any adjustment in its language as markets misinterpreted March's. Unless there is a resurgence in inflationary pressure, it's unlikely for ECB to change course this year on monetary policy. Nonetheless, as scheduled, ECB will reduce bond buying by EUR 20b to EUR 60b starting April, and run till at least the end of the year. Also from Eurozone, German retail sales rose 1.8% mom in February. German unemployment dropped -30k in March while unemployment rate dropped to 5.8%.
US core PCE unchanged at 1.8% yoy
From US, personal income rose 0.4% in February while spending rose 0.1%. Headline PCE rose to 2.1% yoy while core PCE was unchanged at 1.8% yoy. From Canada, GDP rose 0.6% mom in January. New York Fed President William Dudley said yesterday that federal funds rate remains "unusually low". And, "it seems appropriate to scale back monetary policy accommodation gradually" Also, economic outlook abroad has "brightened" with risks "significantly lower than they were a year ago." He said two more rate hikes this year "seems reasonable". Dallas Fed President Robert Kaplan said three rate hike this year is still his "base case".
Japan national CPI rose but Tokyo CPI worsened
In Japan, national CPI core rose 0.2% yoy in February, meeting expectations. This is also the first back to back increase in CPI since late 2015. However, it should be noted that Tokyo CPI dropped -0.4% yoy in March, worse than February's -0.3% yoy and missed expectation of -0.2% yoy. Unemployment rate dropped to 2.8% in February, lowest since 1994. Household spending dropped -3.8% yoy in February,below expectation of -1.6% yoy. Industrial production rose 2.0% mom in February, above expectation of 1.2% mom. Housing starts dropped -2.6% yoy. All in all, the set of data from Japan is not too encouraging.
Elsewhere, New Zealand building permits rose 14.0% mom in February. NBNZ business confidence dropped to 11.3 in March. China PMI manufacturing rose 0.2 to 51.8 in March while non-manufacturing PMI rose to 55.1. UK Gfk consumer sentiment was unchanged at -6 in March, nationwide house prices dropped -0.3% mom in March. Germany retail sales rose 1.8% mom in February.
EUR/USD Mid-Day Outlook
Daily Pivots: (S1) 1.0727; (P) 1.0777 (R1) 1.0814; More.....
EUR/USD engages in sideway trading in early US session. But intraday bias remains on the downside for far. Current fall from 1.0905 should target 1.0494 support next. As noted before, corrective rise from 1.0339 could be completed at 1.0905. Break of 1.0494 should confirm this case and target 1.0339 low. On the upside, above 1.0798 minor resistance will turn bias back to the upside for 1.0905 instead.
In the bigger picture, as long as 1.1298 key resistance holds, whole down trend from 1.6039 (2008 high) is still expected to continue. Break of 1.0339 low will send EUR/USD through parity to 61.8% projection of 1.3993 to 1.0461 from 1.1298 at 0.9115. However, considering bullish convergence condition in weekly MACD, break of 1.1298 will indicate term reversal. this would also be supported by sustained trading above 55 week EMA.
Economic Indicators Update
| GMT | Ccy | Events | Actual | Forecast | Previous | Revised |
|---|---|---|---|---|---|---|
| 21:45 | NZD | Building Permits M/M Feb | 14.00% | 0.80% | 201% | |
| 23:01 | GBP | GfK Consumer Confidence Survey Mar | -6 | -7 | -6 | |
| 23:30 | JPY | Unemployment Rate Feb | 2.80% | 3.00% | 3.00% | |
| 23:30 | JPY | Household Spending Y/Y Feb | -3.80% | -1.60% | -1.20% | |
| 23:30 | JPY | National CPI Core Y/Y Feb | 0.20% | 0.20% | 0.10% | |
| 23:30 | JPY | Tokyo CPI Core Y/Y Mar | -0.40% | -0.20% | -0.30% | |
| 23:50 | JPY | Industrial Production M/M Feb P | 2.00% | 1.20% | -0.40% | |
| 00:00 | NZD | NBNZ Business Confidence Mar | 11.3 | 16.6 | ||
| 01:00 | CNY | Manufacturing PMI Mar | 51.8 | 51.7 | 51.6 | |
| 01:00 | CNY | Non-manufacturing PMI Mar | 55.1 | 54.2 | ||
| 05:00 | JPY | Housing Starts Y/Y Feb | -2.60% | -1.20% | 12.80% | |
| 06:00 | EUR | German Retail Sales M/M Feb | 1.80% | 0.70% | -0.80% | |
| 06:00 | GBP | Nationwide House Prices M/M Mar | -0.30% | 0.30% | 0.60% | |
| 07:55 | EUR | German Unemployment Change Mar | -30k | -10k | -14k | -17k |
| 07:55 | EUR | German Unemployment Rate Mar | 5.80% | 5.90% | 5.90% | |
| 08:30 | GBP | Current Account (GBP) Q4 | -12.1b | -16.0b | -25.5b | -25.7b |
| 08:30 | GBP | GDP Q/Q Q4 F | 0.60% | 0.70% | 0.70% | |
| 08:30 | GBP | Index of Services 3M/3M Jan | 0.70% | 0.70% | 0.80% | |
| 08:30 | GBP | Total Business Investment Q/Q Q4 F | -0.90% | -1.00% | -1.00% | |
| 09:00 | EUR | Eurozone CPI Estimate Y/Y Mar | 1.50% | 1.80% | 2.00% | |
| 09:00 | EUR | Eurozone CPI - Core Y/Y Mar A | 0.70% | 0.80% | 0.90% | |
| 12:30 | CAD | GDP M/M Jan | 0.60% | 0.30% | 0.30% | |
| 12:30 | USD | Personal Income Feb | 0.40% | 0.40% | 0.40% | 0.50% |
| 12:30 | USD | Personal Spending Feb | 0.10% | 0.20% | 0.20% | |
| 12:30 | USD | PCE Deflator M/M Feb | 0.10% | 0.10% | 0.40% | |
| 12:30 | USD | PCE Deflator Y/Y Feb | 2.10% | 2.10% | 1.90% | |
| 12:30 | USD | PCE Core M/M Feb | 0.20% | 0.20% | 0.30% | |
| 12:30 | USD | PCE Core Y/Y Feb | 1.80% | 1.70% | 1.70% | 1.80% |
| 13:45 | USD | Chicago PMI Mar | 57 | 57.4 | ||
| 14:00 | USD | U. of Michigan Confidence Mar F | 97.6 | 97.6 |
Scexit: Can Sterling Weather the Great British Divide?
On Wednesday 29 March, the British Prime Minister officially began the process of leaving the EU. Brexit might be taking up the column inches, but there's more to play for than trade deals and shared custom agreements. On Tuesday 28 March, the Scottish Parliament voted in favour of holding a second Independence Referendum.
The news that Sturgeon intends to call another vote for Scottish Independence was not entirely unexpected -- grumblings from the SNP have abounded since July. The majority of Scottish voters have no appetite for a Brexit, and the probability of being dragged kicking and screaming from the familial bosom of Europe might just be enough to ignite a desire for an Independent Scotland with EU membership.
The practicalities of a Scexit remain sketchy at best. The first attempt at Independence relied on the profitability of North Sea oil - which has plummeted since the Scots last went to the polls. The first bid was soundly defeated by a 10% margin, and recent data suggests there's even less interest in a split the second time around. Only 40% of Scots are thought to welcome a pre-Brexit dash for freedom. Nicola Sturgeon will need to convince her electorate she can compensate the significant financial support her country currently receives from Westminster. Most critically of all, she will need to set out how to create a Europhilic Scotland with a deficit that would preclude membership.
What Happens If Scotland Goes It Alone?
When news of a second Referendum broke on 13 March, sterling initially dipped, but quickly recovered any lost ground to finish the week at one month highs. Tuesday's announcement that Holyrood would call a second referendum barely impacted the currency. The invoking of Article 50, however, saw a fluctuation between losses and small gains, with the Pound trading at $1.239 by late Wednesday night.
Doubts over the legitimacy of the SNP's Independence strategy might be negating any impact on the Pound now, but the currency is unlikely to remain so resilient should the possibility of a sterling-wielding Scotland, independent of both the UK and EU, become a real possibility.
The most recent figures put Scotland's annual public spending deficit at 9.5% of GDP. Currently, that's propped up by a transfer between Scotland and the UK of around £9 billion, but an Independent Scotland would have to dramatically cut public spending or significantly increase taxes to compensate. Either could lead to a serious contraction of the domestic economy. A significant increase in taxes (recent estimates suggest an annual hike of GBP £1,000 per person would be needed to offset current spending) or cuts in public spending are likely to have a negative impact on pivotal industries such as retail, construction, tourism, and agriculture. This is before we account for any future decisions on the division of national debt between Scotland and the rest of the UK, and the impact a divide would have on the job market.
To add to these economic woes, an Independent Scotland without the Euro to fall back on would have few choices but to dollarize sterling (i.e., use the Pound outside of an official currency union). This would rob Holyrood of any control over the management of the monetary framework and severely limit its ability to provide liquidity to the financial sector at a time of massive upheaval.
An alternative could be to copy the 1926 example of the Irish Free State, and create a Scottish currency anchored to sterling. Scotland would gain some economic controls while maintaining the stability of the Pound and neatly side-step any additional costs associated with trading with the rest of the United Kingdom.
Of course, this assumes that the Pound will weather Brexit intact. The growing threat of an independence vote in Scotland destabilizing the United Kingdom could create further uncertainty and weigh heavily on investor sentiment; faith in sterling is likely to plummet should both Scotland and the rest of the UK extradite themselves from the tangle of long-established unions at the same time. The Pound did navigate the first independence referendum in 2014 well, only dropping to five month lows as voting day hit the horizon and public sentiment swung towards an out vote. By post-Brexit standards though, that low ($1.611) now seems positively buoyant. A second Scexit - with or without European support - could very well lampoon the floundering currency. Uncertainty revolving around Brexit has already made the outlook for Sterling bearish, with the Scottish referendum development encouraging bears to install renewed rounds of selling. Since the Brexit shocker back in the June 2016, the GBPUSD has traded in a very wide range, but Scexit might well act as a catalyst for another market shaking selloff.
WTI Crude Oil Broke Key Barriers
Strong rally in past three days eventually broke and closed above key barriers at $50.00/10 (psychological barrier / Fibo 38.2% of $55.01/$47.06 descend), generating firmer bullish signal.
Recovery from $47.06 base peaked at $50.45, with subsequent easing signaled by reversal of 4-hr RSI / slow stochastic from overbought territory.
Dips may extend below $50, now acting as initial support and should be ideally contained above $49.25/16 support zone ( yesterday's low / broken 20SMA / Fibo 38.2% of $47.08/$50.45 rally) ahead of fresh attempts higher.
Also, weekly close above $50.0 handle would be seen as strong bullish signal for extension towards next strong barrier at $51.03 (50% retracement of $55.01/$47.06) reinforced by 100SMA.
Res: 50.45; 51.03; 51.21; 51.73
Sup: 50.00; 49.50; 49.16; 48.67