Sample Category Title
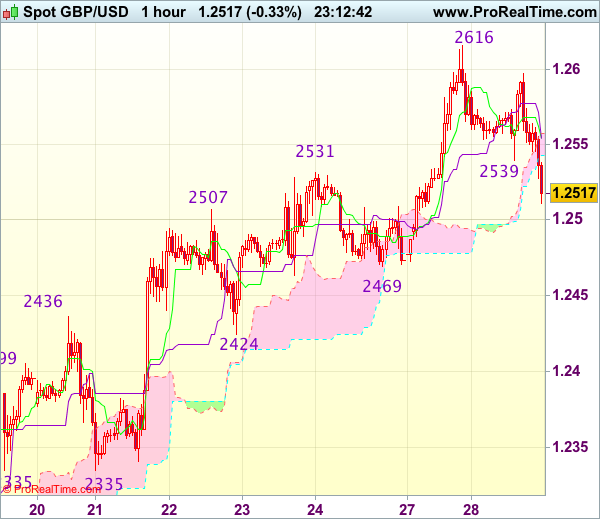
Trade Idea Wrap-up: GBP/USD – Buy at 1.2470
GBP/USD - 1.2515
Most recent candlesticks pattern : N/A
Trend : Near term up
Tenkan-Sen level : 1.2551
Kijun-Sen level : 1.2551
Ichimoku cloud top : 1.2557
Ichimoku cloud bottom : 1.2543
Original strategy :
Buy at 1.2490, Target: 1.2600, Stop: 1.2455
Position : -
Target : -
Stop : -
New strategy :
Buy at 1.2470, Target: 1.2590, Stop: 1.2435
Position : -
Target : -
Stop : -
Cable’s retreat after rising to 1.2616 yesterday suggests consolidation below this level would be seen and initial downside risk remains for weakness to 1.2490-00, however, reckon support at 1.2469 would limit downside and bring another upmove later, above said resistance at 1.2616 would extend recent rise from 1.2109 to 1.2635-40 but loss of upward momentum should prevent sharp move beyond 1.2670-80 and price should falter below previous resistance at 1.2706, risk from there is seen for a retreat later.
In view of this, would not chase this rise here and would be prudent to buy cable on further subsequent retreat as said support at 1.2469 (Friday’s low) should limit downside. Only below 1.2422-24 (38.2% Fibonacci retracement of 1.2109-1.2616 and previous support) would abort and signal top is formed, bring retracement of recent upmove to 1.2390-00 and possibly towards 1.2360-65 (50% Fibonacci retracement).
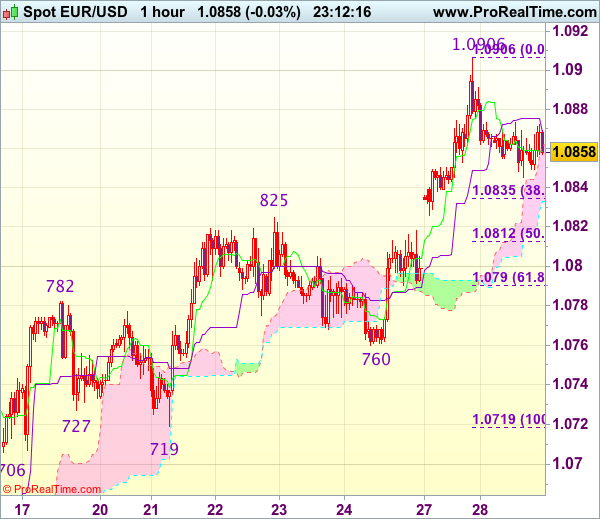
Trade Idea Wrap-up: EUR/USD – Buy at 1.0800
EUR/USD - 1.0863
Most recent candlesticks pattern : N/A
Trend : Near term up
Tenkan-Sen level : 1.0859
Kijun-Sen level : 1.0868
Ichimoku cloud top : 1.0862
Ichimoku cloud bottom : 1.0833
Original strategy :
Buy at 1.0800, Target: 1.0900, Stop: 1.0765
Position : -
Target : -
Stop : -
New strategy :
Buy at 1.0800, Target: 1.0900, Stop: 1.0765
Position : -
Target : -
Stop : -
As the single currency has retreated after surging to 1.0906 yesterday, suggesting consolidation below this level would be seen and pullback to 1.0835 (38.2% Fibonacci retracement of 1.0719-1.0906) is likely, however, reckon downside would be limited to 1.0810-15 (50% Fibonacci retracement), bring another rise later, above said resistance at 1.0906 would extend recent upmove to 1.0930-35 (61.8% Fibonacci retracement of 1.1300-1.0340) but loss of near term upward momentum should prevent sharp move beyond 1.0955-60 and price should falter below 1.0990-00.
In view of this, would not chase this rise here and we are looking to buy euro on subsequent pullback as 1.0800-10 should limit downside. Only below support at 1.0760 would abort and signal top is formed, bring retracement of recent upmove to 1.0730 but 1.0719 support should remain intact.
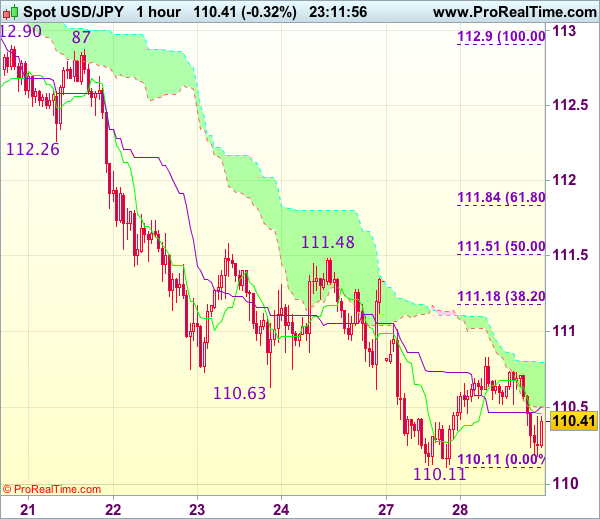
Trade Idea Wrap-up: USD/JPY – Sell at 111.20
USD/JPY - 110.43
Most recent candlesticks pattern : N/A
Trend : Down
Tenkan-Sen level : 110.46
Kijun-Sen level : 110.51
Ichimoku cloud top : 110.80
Ichimoku cloud bottom : 110.50
Original strategy :
Sell at 111.20, Target: 110.20, Stop: 111.55
Position : -
Target : -
Stop : -
New strategy :
Sell at 111.20, Target: 110.20, Stop: 111.55
Position : -
Target : -
Stop : -
Although dollar retreated after meeting resistance at 110.83, as long as support at 110.11 holds, further consolidation would be seen and another corrective bounce to 110.95-00 cannot be ruled out, however, reckon upside would be limited to 111.15-20 (38.2% Fibonacci retracement of 112.90-110.11) and price should falter well below resistance at 111.48, bring another decline later, below said support at 110.11 would signal recent decline is still in progress and may extend weakness to 109.95-00 but loss of downward momentum should prevent sharp fall below 109.70-75 and reckon 109.50 would hold.
In view of this, would not chase this fall here and would be prudent to sell dollar on recovery as 111.15-20 should limit upside. Above 111.48-51 (previous resistance and 50% Fibonacci retracement of 112.90-110.11) would abort and signal low is formed, bring a stronger rebound to 111.80-85 first (61.8% Fibonacci retracement).
National Home Prices Edge Higher to Start 2017
National home prices rose 0.6 percent in January, pushing the year-over-year gain to 5.9 percent. Home prices are being supported by steady gains in demand and the continued low level of homes for sale.
U.S. Home Prices Continue to Rise
National home prices continue to edge higher as tight supplies and continued uptrend in home sales push prices higher. The S&P CoreLogic Case-Shiller National Home Price Index rose 5.9 percent over the past 12 months and the 20-City and 10-City indices are up 5.7 percent and 5.1 percent, respectively.
On a regional basis, Seattle, Portland and Denver continue to see the strongest year-to-year price gains.
Prices Have Risen the Fastest in Larger Markets
While only the national home price index has regained its prerecession level, the recovery has been driven by the rebound in the 20-City and 10-City indices, which both fell harder during the housing crisis and rose faster during the ensuing recovery.
Much of the earlier price recovery was dominated by big global coastal markets. Price appreciation has moderated, however, as European and Latin American buying has diminished.
Pound Dips as US Consumer Confidence Soars
GBP/USD has edged lower in Tuesday's North American session. Currently ,GBP/USD is trading at 1.2530. On the release front, it's another quiet day, with no UK events on the schedule. In the US, CB Consumer Confidence rocketed to 125.5, crushing the estimate of 113.9. There was also good news on the manufacturing front, as the Richmond Manufacturing Index improved to 22, well above the forecast of 16 points.
The dollar is showing some strength in North American trading, courtesy of a spectacular reading from CB Consumer Confidence. The key indicator surprised the markets by climbing to 125.5, its highest level since December 2000. Clearly, consumers remain optimistic about the economy, and a major factor in this sentiment is the red-hot labor market, which remains close to capacity. An increase in consumer confidence often translates into stronger consumer spending, which would be bullish for the US dollar, which has headed lower since the Federal Reserve rate hike on March 15. We'll get a look at consumer spending data on Friday, with the release of Personal Spending.
Donald Trump suffered his first major setback as president last week, as his bill to replace the Affordable Care Act was pulled before it even went to a vote. Trump is used to giving the orders in the private sector and on reality TV, but he didn't get his way on healthcare, despite the Republicans enjoying a majority in Congress. This bruising defeat has sent the US dollar sharply lower, and sent market jitters higher. Trump's administration has stumbled out of the starting gate, and after more than two months in office, he has yet to provide any details over even an outline of economic policy. The inquiry into the Trump administration's links with Russia is gathering steam, and is another cause for concern for nervous investors. Trump has said he will now focus on tax reform, but he has his work cut out, trying to convince a skeptical Congress and general public that he can deliver the goods and pass new, effective legislation.
Britain departure from the European Union will move into second gear on Thursday, as the government formally gives notice to its EU colleagues of its intent to withdraw from the club. However, actual negotiations between the parties may not commence until June, according to recent statements from EU policymakers. The negotiations are supposed to be conducted over a two-year period, and promise to be tough and perhaps acrimonious. The EU cannot afford to "go easy" on the UK and give it a sweet deal, since this would provide ammunition to euro-skeptics on the continent who also want to quit the EU. For its part, the British government needs to reach what it considers a fair deal, and has threatened to leave the EU without a deal if the EU is intransigent in the negotiations.
USD Struggles as Reflation Trade Fails to Resume
Headlines
European stock markets opened around 0.5% higher in a catch-up move and managed to hold on to gains. US stock markets slightly slip away in the opening.
US eco data were stronger than expected. Consumer confidence increased from 116.1 to 125.6 in March, the highest level since December 2000. The Richmond Fed manufacturing index also beat expectations, rising from 17 to 22, the strongest since April 2010. The US trade deficit was smaller than expected in February and housing prices (S&P CS) increased faster than forecast in January.
The ECB improperly veered into political activity during the eurozone crisis and should withdraw from the "troika" of international bailout monitors, according to anti-corruption watchdog Transparency International.
South Africa's rand plummeted for a second day as speculation intensified that President Jacob Zuma is preparing to fire his finance minister after summoning him back from an overseas investor roadshow. USD/ZAR temporarily rose above 13.
US President Trump will sign an executive order to undo a slew of Obama-era climate change regulations that his administration says is hobbling oil drillers and coal miners, a move environmental groups have vowed to take to court.
The National Bank of Hungary kept its policy rate unchanged at 0.9%, but the central bank raised its CPI forecast for 2017 to 2.6% in its quarterly Inflation Report from 2.4% in the previous report published in December. It did not change the 3% forecast for 2018 and in a new set of data also predicted 3% inflation in Hungary for 2019.
Rates
Jury still out on future reflation trade
Global core bonds traded with a small upward bias today in an insignificant trading session. The jury is still out on the future of the reflation trade with several markets giving different signals. Stocks and oil prices rise, while the dollar (USD/JPY) and yields are slightly lower. At the time of writing, changes on the German yield curve range between -1.1 bp (5-yr) and +0.8 bps (2-yr). Changes on the US yield curve vary between +0.9 bps (2-yr) and -1.2 bps (30-yr). On intra-EMU bond markets, 10-yr yield spread changes versus Germany narrow up to 3 bps (Italy) with Greece (-14 bps) outperforming.
Intraday, the Bund opened slightly lower in a catch-up move with WS yesterday. During Monday's US trading session, risk sentiment turned positive again, partly reversing the correction on the reflation trade after Friday's failed health care bill. There was no follow-though Bund selling and the Bund/US Note future even traded with an upward bias throughout today's session. A miserable German Schatz auction, a smaller than expected February trade deficit and higher than forecast housing data (S&P CS) had no impact on trading. Today's rise of global core bonds occurred despite rising oil prices and stock markets. There are plenty central bank speakers tonight, but the topics of their speeches suggest that they won't touch upon monetary policy/sensitive information for markets.
The German Finanzagentur's €4B 2-yr Schatz auction (€4B 0% Mar2019) went miserably. Total bids amounted only €3.19B, way below the €5.49B average at the previous 4 Schatz auctions and below the amount on offer. As the Bundesbank set aside €1.11B for secondary market operations, the official bid cover was 1.1 instead of 0.8. The auction tailed 1.3 cent, which is also unusual for Schatz auctions. The US Treasury continues its end-of-month refinancing operation tonight with a $34B 5-yr Note auction. Currently, the WI trades around 1.91%. .

Currencies
USD struggles as reflation trade fails to resume
USD traders still haven't found a clear guide in the wake of the debacle of the US healthcare vote on Friday. Yesterday evening, the dollar decline slowed as US equities found their composure. However, it is too early for investors to engage further in the reflation trade. Uncertainty and a further (modest) slide in core yields weighs on USD/JPY. After a strong performance yesterday, the euro didn't go anywhere today. EUR/USD is locked in the mid 1.08 area.
Overnight, Asian equities joined yesterday's intraday rebound in the US, but the gains were modest. This was also the case for the comeback of the dollar. USD/JPY rebounded temporary to the 110.80 area, but returned soon to the mid 110 area. EUR/USD hovered in the 1.0865 area. So, yesterday's top just north of 1.09 was still within reach.
European investors didn't really know which card to play. European equities caught up with yesterday's late session rebound in the US but there was no trigger to start a new sustained up-leg in the global reflation trade. Indecisiveness again prevailed. USD/JPY stabilized in a narrow range in the mid 110 area. EUR/USD also didn't go anywhere and settled near 1.0850. The German 2-yr auction went quite difficult. There was no direct impact on the euro, but lingering market speculation on an early reduction of ECB policy stimulation suggests that USD sentiment will have to improve in quite a profound way to support a sustained comeback of the dollar against the euro anytime soon.
Risk sentiment deteriorates slightly as US traders joined the action. The move was probably still due to investors adapting positions in the wake of the Trumpcare debacle. The US February trade deficit was slightly smaller than expected at $64.8B, but didn't help the dollar. Contrary to what was the case yesterday, USD/JPY again faced the strongest headwinds. The pair is trading in the 110.30 area. The recent low (110.10 area) is again on the radar. The loss of the dollar against the euro remains limited. EUR/USD is going nowhere in the mid 1.08 area.

Sterling traders await formal start of Brexit procedure
There were again no eco data in UK today. So, sterling trading was driven by technical considerations. Investors were looking forward to tomorrow's formal start of the Brexit procedure as UK PM May will send a letter to EU's Tusk to activate article 50 of the Lisbon Treaty. Sterling traded with a positive bias early in the session, but returned (modest) gains against the dollar and the euro later. The activation of Article 50 is of course no surprise, but the letter might also contain some indication on the UK's negotiation targets. So, it might be a first technical move in a long Brexit saga. For now, sterling remains unmoved. EUR/GBP trades in the 0.8650 area. Cable is at 1.2550.

Turbulence in Store for Trump and the US?
What you may have missed last week - and what to watch out for this week...
- A busy week for the UK and its trading partners
- Turbulence in store for Trump and the US?
- European energy dampened by the Dollar
- Surprises in store for New Zealand
A busy week for the UK and its trading partners
World markets are braced for an exciting week ahead, as UK Prime Minister, Theresa May, fires the Article 50 starting gun and the UK's trade negotiations across the globe begin in an official capacity. With the level of "certainty" that the triggering of Article 50 brings, Sterling is doing well, but the week ahead is likely to see currency market volatility as events unfold.
There will also be a veritable flurry of UK economic data, which, when teamed with the Article 50 launch, could cause some ups and downs for Sterling against its major currency partners. Key data due to be released includes house price index stats, UK mortgage data, Quarter Four Gross Domestic Product (GDP) figures, and the UK government's figures regarding the current account deficit.
Turbulence in store for Trump and the US?
The US Dollar has weakened as President Donald Trump has failed to launch his second major policy change after being thwarted by his own party. What he termed as the demolition of Obamacare has become an embarrassment for the President and his supporters. Final Q4 GDP growth figures are expected for the US this week, too, which are anticipated to be much the same as the previous assessments, although you never know in these unprecedented times. The US Dollar is at levels against the Euro not seen since a brief spike at the end of 2016, hovering around the $1.08 mark.
European energy dampened by the Dollar
The Euro, meanwhile, has crept up a little recently, but its fortunes are tied closely to the US Dollar and its recent weakness. Europe is also expecting some important news on the economic front – European Central Bank (ECB) and European Union (EU) speakers are scheduled this week; and there will be the final March inflation data, alongside business and consumer confidence indices. These are always a good benchmark of the economic state of play. The ECB is still confident that the European economic expansion will continue but events in Europe are playing out against a backdrop of contentious presidential elections in France and Germany, which have the capacity to deal a considerable blow to the Euro.
Surprises in store for New Zealand
On the other side of the globe, New Zealand released their latest trade balance figures. The markets had forecast a small surplus but the data actually showed a deficit of 18 million New Zealand Dollars. The Reserve Bank of New Zealand (RBNZ) kept interest rates at 1.75% as, was widely anticipated but the NZ Dollar is under pressure in spite of improving commodity markets which benefit NZ exporters.
Elliott Wave Analysis: Silver Trading In A Bullish Impulse
On the hourly chart of Silver, we see commodity undergoing a nice impulsive sequence to the upside, with price specifically trading in sub-wave v of three. That said, current sub-wave v may extend its gains towards the 161.8 or even higher to the 261.8 Fibonacci projected ratio, before making a new reversal to the downside. After sub-wave v of three finds a top, a minimum three wave correction may follow into the following wave 4.
SILVER, 1H
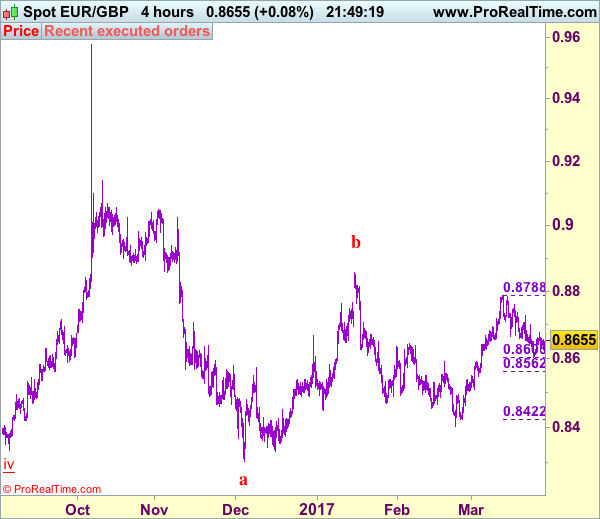
Trade Idea: EUR/GBP – Hold long entered at 0.8620
EUR/GBP - 0.8663
Recent wave: Major double three (A)-(B)-(C)-(X)-(A)-(B)-(C) is unfolding and 2nd (A) has possibly ended at 0.6936.
Trend: Near term down
Original strategy :
Bought at 0.8620, Target: 0.8750, Stop: 0.8600
Position : - Long at 0.8620
Target : - 0.8750
Stop : - 0.8600
New strategy :
Hold long entered at 0.8620, Target: 0.8720, Stop: 0.8600
Position : - Long at 0.8620
Target : - 0.8720
Stop : - 0.8600
As the single currency found support just above last week’s low at 0.8605 and has rebounded, retaining our bullishness and as long as this support holds, mild upside bias remains for another rebound, a break of indicated resistance at 0.8700 would bring test of 0.8727, above there would suggest low is formed, then gain to 0.8760 would follow, break there would suggest the pullback from 0.8788 has ended, bring retest of this level, a breach there would extend the rise from 0.8403 low to 0.8800 and later 0.8825-30.
In view of this, we are holding on to our long position entered at 0.8620. A firm break below 0.8605 (50% Fibonacci retracement of 0.8422-0.8788) would defer and suggest top has possibly been formed at 0.8788, risk test of 0.8560-65 (61.8% Fibonacci retracement) but support at 0.8547 should remain intact.
Our preferred count is that, after forming a major top at 0.9805 (wave V), (A)-(B)-(C) correction is unfolding with (A) leg ended at 0.8400 (A: 0.8637, B: 0.9491 and 5-waver C ended at 0.8400. Wave (B) has ended at 0.9413 and impulsive wave (C) has either ended at 0.8067 or may extend one more fall to 0.8000 before prospect of another rally. Current breach of indicated resistance at 0.9043 confirms our view that the (C) leg has ended and bring stronger rebound towards 0.9150/54, then towards 0.9240/50.
Trade Idea: USD/CAD – Stand aside
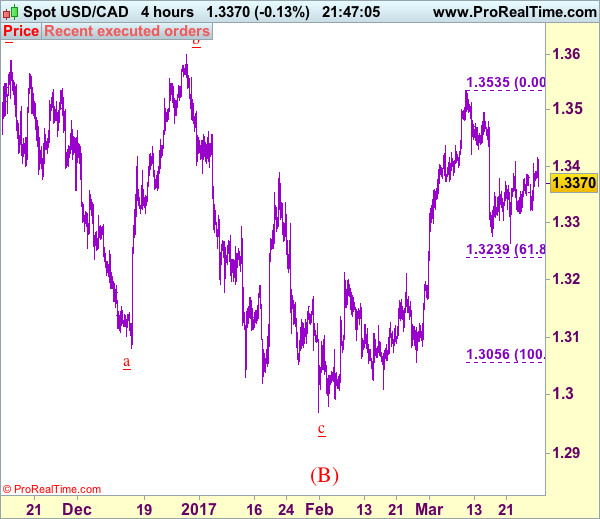
USD/CAD - 1.3379
Recent wave: Only wave v of c has ended at 0.9407 and wave C of major A-B-C correction is underway for headway to 1.4700
Trend: Near term up
Original strategy :
Exit short entered at 1.3400,
Position: - Short at 1.3400
Target: -
Stop: -
New strategy :
Stand aside
Position: -
Target: -
Stop:-
The greenback edged higher and further consolidation above 1.3326 support would be seen, a firm break above 1.3415 would signal low has been formed at 1.3264 last week, bring a stronger rebound to 1.3450 and possibly test of resistance at 1.3479 but only break of 1.3495 resistance would indicate the pullback from 1.3535 has ended and bring retest of this level later.
In view of this, would be prudent to stand aside for now. Below 1.3326 would revive bearishness, bring retest of said last week’s low at 1.3264, break there would add credence to our view that top has been made at 1.3535 earlier this month, bring further fall to 1.3235-40 (61.8% Fibonacci retracement of 1.3056-1.3535) but previous resistance at 1.3210 would hold due to loss of downward momentum.
To recap, wave B from 1.3066 is unfolding as an a-b-c and is sub-divided as a: 1.2192, b: 1.2716 and wave c is a 5-waver with i: 1.1983, ii: 1.2506, extended wave iii with minor iii at 1.0206, wave iv ended at 1.0781 and wave v as well as wave iii has ended at 0.9931, hence the subsequent choppy trading is the wave iv which is unfolding as (a)-(b)-(c) with (a) leg of iv ended at 1.0854, followed by (b) leg at 1.0108 and (c) leg as well as the wave iv ended at 1.0674. The wave v is sub-divided by minor wave (i): 0.9980, (ii): 1.0374, (iii): 0.9446, (iv): 0.9913 and (v) as well as v has possibly ended at 0.9407, therefore, consolidation with upside bias is seen for major correction, indicated target at 1.3700 and 1.4000 had been met and further gain to 1.4700 would be seen later.