
Sample Category Title
Currency Markets Stay Generally in Range, Yen Firm But Held by Monday’s Highs
The financial markets stabilized today with major European indices trading mixed. DAX jumps 0.5% at the time of writing while FTSE and CAC stays in tight range around break even. US futures also point to flat open. In the currency markets, commodity currencies are soft but generally confined in yesterday's range. Yen is firmer against all others but there is no follow through buying to push it throw Monday's highs yet. Dollar, on the other hand, remains mixed. Released from US, trade deficit fell shrank in February to USD -64.8b, comparing to prior month's USD -68.8b and expectation of -66.6b. Wholesale inventories rose more than expected by 0.4% in February. S&P Case-Shiller 20 cities house price rose 5.7% yoy in January.
UK to trigger Brexit tomorrow
Sterling pares back some of its earlier gain this week. Markets are awaiting UK Prime Minister Theresa May to trigger Brexit tomorrow. There are talks that while many officials are involved in the negotiation between EU and UK, German Chancellor Angela Merkel and UK May are the two key persons. Meanwhile, Brexit secretary David Davis will go head-to-head with EU chief negotiator Michel Barnier. European Council President Donald Tusk and the head of the council's Brexit task force Dider Seeuws are the other key persons on the EU's side. On the UK side, there will be significant involvement from UK ambassador to EU Time Barrow and director general of David Davis's department Sarah Healey. The comments from these figures will be closely watched as the negotiation starts.
RBA Harper: Export phase of mining boom to last another 30 years
In Australia, RBA board member Ian Harper said that the current "export phase" of the mining boom is going to extend for another 30 years. He noted that resources booms usually have three phases, "the prices phase, the investment phase and the export or production phase". And, "we're well and truly into the export, or production phase, and that will last probably for the next 30 years - this is still very much a large issue." Meanwhile, he also said that "and as mining investments come off, as the mining boom moves from the second phase to the third phase, the nature of its contribution changes." Hence, policy makers were keen to see rebalancing in the economy as the export phase gets underway.
Staying Positive In USDJPY Despite Near-Term Weakness
The financial markets generally stabilized temporarily from the risk selloff today. Trump administration's failure to repeal and replace Obamacare has hurt market sentiment, triggering concerns over the feasibility of the president's pro-growth policy agenda. In the FX market, US dollar fell across the board amidst concerns that reflation trades since Trump's victory is over. More downside is expected in USD/JPY in near term. But, in the medium-term, we remain positive over USDJPY, or US dollar in general. The next move for the Fed is a rate hike, rather than a rate cut. Policymakers would turn more upbeat should incoming macroeconomic data remain strong. Moreover, we believe USD as well as Treasury yields would be lifted as we come closer to the next rate hike. More in Staying Positive In USDJPY Despite Near-Term Weakness.
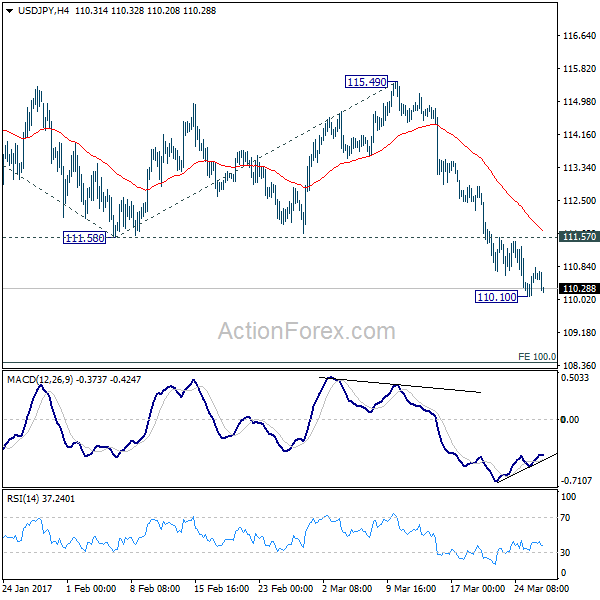
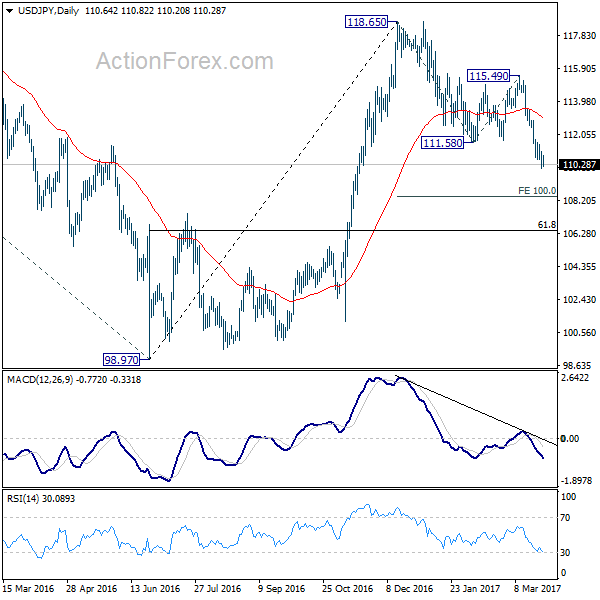
USD/JPY Mid-Day Outlook
Daily Pivots: (S1) 110.16; (P) 110.60; (R1) 111.10; More...
USD/JPY consolidates above 110.10 temporary low and intraday bias is neutral for the moment. As long as 111.57 resistance holds, deeper decline is expected in the pair. Below 110.10 will extend the current fall from 118.65 to 100% projection of 118.65 to 111.58 from 115.49 at 108.42 and possibly below. Meanwhile, firm break of 111.57 will indicate short term bottoming and bring rebound back to 55 day EMA (now at 113.09).
In the bigger picture, price actions from 125.85 high are seen as a corrective pattern. sustained trading below 55 week EMA (now at 111.11) will indicates that such consolidation is not completed. And another fall would be seen back to 98.97 as the third leg. In that case, downside would be contained by 61.8% retracement of 75.56 to 125.95 at 94.77 to complete the correction. On the upside, above 115.49 will extend the rise from 98.97 to retest 125.85 first. Overall, up trend from 75.56 is expected to resume after the consolidation from 125.85 completes.
Economic Indicators Update
| GMT | Ccy | Events | Actual | Forecast | Previous | Revised |
|---|---|---|---|---|---|---|
| 12:30 | USD | Advance Goods Trade Balance Feb | -64.8B | -66.6B | -69.2B | -68.8B |
| 12:30 | USD | Wholesale Inventories Feb P | 0.40% | 0.20% | -0.20% | |
| 13:00 | USD | S&P/Case-Shiller Composite-20 Y/Y Jan | 5.70% | 5.60% | 5.60% | 5.50% |
| 14:00 | USD | Consumer Confidence Mar | 113.7 | 114.8 |
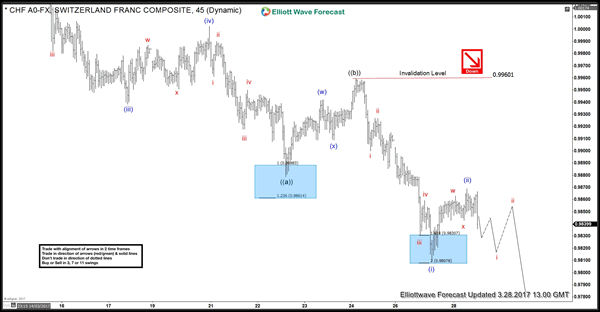
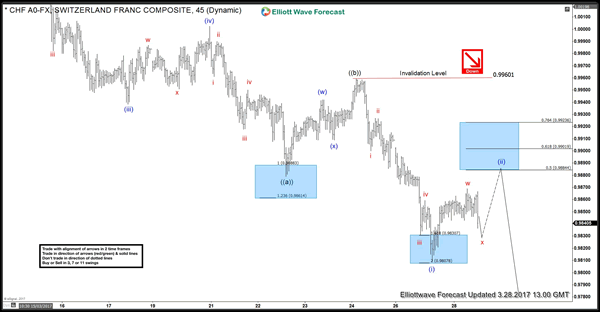
USDCHF Intraday Elliott Wave View
USDCHF decline from 3/7 (1.0170) high to 3/22 (0.9879) low could be viewed as a 5 swing move that we have labelled as Elliott wave ((a)). Bounce to 0.9960 was a three move and completed Elliott wave ((b)). Pair has since dropped to a new low below 0.9879 confirming the view that wave ((b)) ended at 0.9960. Decline from 0.9960 - 0.9809 was again in 5 swings and completed wave (i) of ((c)). Pair has already done 3 wave bounce to 0.9868 which could be all of wave (ii) and pair can now resume the decline in wave (iii). Pair doing small 5 waves from 0.9868 high will add conviction to this view but we would need to see a break below 0.9809 low to confirm wave (ii) ended at 0.9868 and wave (iii) of ((c)) lower is in progress. Until then, another push higher towards 0.9884 - 0.9901 area can't be ruled out to complete wave (ii) as a double three w-x-y structure. In either case, as pair is showing an incomplete bearish sequence down from 3/7 (1.0170) high, we expect the bounces to fail below 0.9960 high for extension lower and in case of another push, expect the pair to find sellers in 0.9884 - 0.9901 area. This view remains valid as far as price stays below 0.9960 high. Ideal target for wave ((c)) lower to complete is in the region of 0.9684 - 0.9569 and we can see the pair turning higher from there in 3 waves at least.
USDCHF 1 Hour Elliott Wave chart - Wave (ii) completed
Pair showing small 5 waves from blue wave (ii) peak will add conviction to this view and a break below 0.9809 will confirm this idea.
USDCHF 1 Hour Elliott Wave Chart - Wave (ii) in progress
Pair has already done 3 waves up from 0.9809 low and has minimum number of swings in place to call wave (ii) completed. However, while above 0.9809 low, another 3 swings higher and a test of 0.9884 - 0.9901 area can't be ruled out to complete wave (ii) as a 7 swing structure before decline resumes. In either case, expect rallies to fail below 0.9960 high for extension lower in USDCHF.
Markets Nurse Hangover from Trump Slump
Global stocks regained some composure on Tuesday with most arenas' edging higher after investors re-evaluated if Trump's failure on healthcare reforms would negatively impact his ability to pass other key reforms in the future. Asian stocks marched into the green territory as participants remained cautiously optimistic over the proposed tax cuts and fiscal stimulus with the upside momentum elevating European equities. Wall Street could find itself supported this evening as markets seemingly overlook the recent setbacks to giving the global reflation trade the benefit of the doubt. Although the current stock market resilience may be commended, stocks could still be exposed to downside risks, especially if investors become jittery ahead of the Article 50 invoke on Wednesday.
Sterling pressured ahead of Article 50 invoke
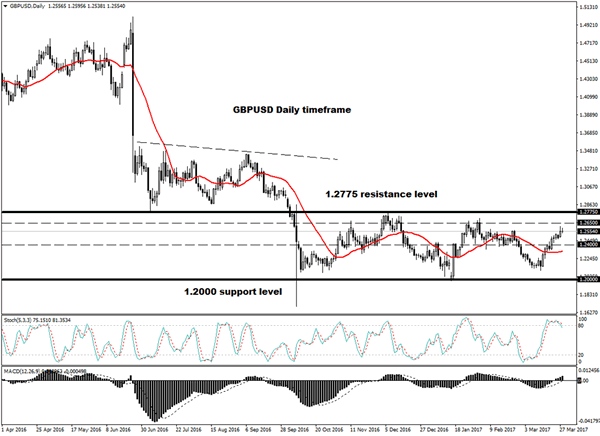
Sterling was slightly pressured during trading on Tuesday with investors observing the currency from a distance as anticipation mounted ahead of the Article 50 invoke on Wednesday. With the Brexit procedure officially switching from amber to green this week when the government delivers a letter to Donald Tusk, Sterling could become extremely sensitive. The fact that the formal negotiations may not start until after the second round of the French presidential election in May and potentially as late as June could expose Sterling to downside shocks as anxiety erodes buying sentiment further. From a technical standpoint, the GBPUSD exists in a very wide range on the daily timeframe with 1.2775 acting as a resistance and 1.2000 a solid support. Much attention will be directed to how prices react below the 1.2650 regions with any weakness opening a path lower back towards 1.2400.
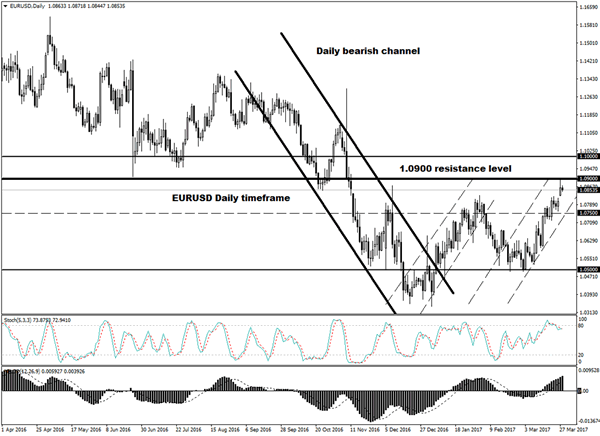
EURUSD momentarily clips above 1.0900
The receding political risks in Europe coupled with growing speculations of a potential QE tapering by the ECB in the future have boosted the Euro with prices clipping 1.0900 this week. A vulnerable Dollar from the renewed Trump jitters has attributed to the EURUSD resurgence with further inclines expected if 1.0900 is conquered. From a technical standpoint, prices are turning increasingly bullish on the daily timeframe as there have been consistently higher highs and higher lows. The candlesticks are trading above the daily 20 simple moving averages while the MACD has also crossed to the upside. If bulls manage to break above and secure a daily close above 1.0900 then the next level of interest is around 1.1000. On the other hand, weakness below this critical resistance could invite a decline back down towards 1.0750.
Dollar subdued ahead of Consumer Confidence
The Greenback remains on a back foot as the terrible combination of protectionism fears, Trump jitters and questions over the longevity of the reflation trade encourages sellers to attack the currency. Dollar bullish investors are in desperate need of inspiration to revive the Dollar with the pending consumer confidence report and speech from FOMC member Kaplan offering an opportunity. A positive consumer confidence report that exceeds expectations combined with a hawkish tone from Kaplan could offer the Dollar a temporarily lifeline above 99.00. From a technical standpoint, the Dollar Index remains under pressure on the daily charts with weakness below 99.00 potentially opening a path lower towards 98.50.
Commodity spotlight - WTI Crude
Oil prices were vulnerable to losses during trading on Monday with prices pressured on Tuesday after another weekly rise in U.S oil rig count compounded to the oversupply woes. Optimism continues to diminish by the day over the effectiveness of OPEC's output cuts to stabilize the oil markets while uncertainty over whether the cartel will extend its production cuts has weighed on sentiment. The fact that oil prices remain subdued below $50 despite Dollar's vulnerability continues to highlight how the oversupply concerns have become bone deep. With the bias towards oil clearly bearish, sellers may exploit the technical bounces to install heavy rounds of selling. From a technical standpoint, weakness back below $48 could open a path lower towards $47.
DAX Bulls Test Near Term Major Resistance
The DAX index has been oscillated in the range between 11900 and 12100 since early March.
Monday, we saw the release of German IFO expectations, current assessment and business climate figures for March, all better than expectations and the previous figures. The outperforming IFO figures provide DAX some support.
At present, the trend remains bullish. However, the price is currently nearing the near-term major resistance level at 12100, where the pressure is heavier. Be aware that the bullish momentum is likely to be restrained at this level.
The 4-hourly Stochastic Oscillator reading is above 80, suggesting a retracement.
The resistance level is at 12800, followed by 12100 and 12115.
The support line is at 12050, followed by 12030 and 12010.


Yen Quiet Ahead of Japanese Retail Sales
The Japanese yen has edged higher in the Tuesday session. In the North American session, USD/JPY is trading at 110.40. On the release front, today's highlight in the US is CB Consumer Confidence, which is expected to dip to 113.9 points. Japan will release Retail Sales, with the indicator expected to dip to 0.7%.
Donald Trump is used to getting his way in the private sector and on reality TV, but he had to swallow a bitter pill last week as he suffered his first major setback as president. His bill to replace the Affordable Care Act was pulled before it even went to a vote on the House floor, despite the Republicans enjoying a majority in Congress. This bruising defeat has sent the US dollar sharply lower, and sent market jitters higher. Trump's administration has stumbled out of the starting gate, and after more than two months in office, he has yet to provide any details over even an outline of economic policy. The inquiry into the Trump administration's links with Russia is gathering steam, and is another cause for concern for nervous investors. Trump has said he will now focus on tax reform, but he has his work cut out, trying to convince a skeptical Congress and general public that he can push his agenda through Congress.
On Monday, the Bank of Japan released a summary of the minutes of its policy meeting on March 16. There were no surprises, as policymakers said the BoJ's ultra-easy monetary stance would continue as long as inflation remains well below the target of 2 percent. Japan's economy has improved in recent months, boosted by a stronger manufacturing sector and an increase in exports, but domestic demand remains soft, resulting in weak inflation levels. We'll get a look at consumer indicators this week, with the release of retail sales on Tuesday, followed by household spending and Tokyo Core CPI on Thursday.
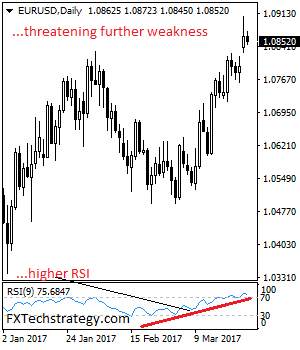
EURUSD: Hesitates, Faces Pullback Threats
EURUSD: With the pair now seen threatening a move lower, it looks to extend corrective pullback. On the upside, resistance comes in at 1.0900 level with a cut through here opening the door for more upside towards the 1.0950 level. Further up, resistance lies at the 1.1000 level where a break will expose the 1.1050 level. Conversely, support lies at the 1.0800 level where a violation will aim at the 1.0750 level. A break of here will aim at the 1.0700 level. All in all, EURUSD faces pullback threats on price failure.
FTSE Attempted to Fill Monday’s Gap
FTSE attempted to fill Monday's gap on extension of bounce from fresh low at 7179, but rally was so far short-lived, failing to benefit more on bullish signal from yesterday's Hammer.
Pound's correction lower provided temporary relief to the index, but prevailing tone on daily chart remains negative and keeps the downside at risk.
We look for today's close below cracked 55SMA (currently at 7230) for strong bearish signal for fresh attack at 7279 low (also daily cloud top / Fibo 61.8% of 7024/7444 upleg) that marks pivotal point and trigger for further downside.
The price may spend some time in consolidation, with upside attempts expected to hold below 7250 and keep negative near-term structure.
Conversely, extended recovery through 7250/80 pivots would generate initial reversal signal, with lift above 7311 (converged daily Tenkan-sen / Kijun-sen line, still in bullish setup), needed to confirm.
Res: 7231; 7250; 7280; 7311
Sup: 7210; 7179; 7123; 7100
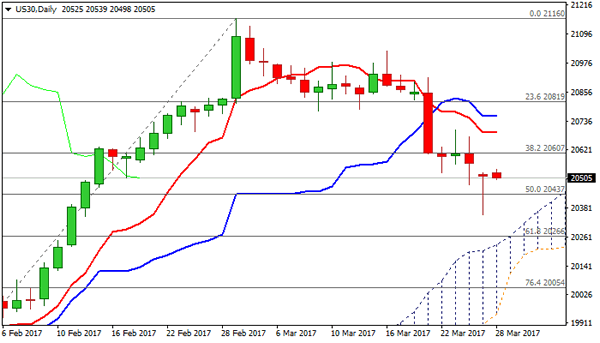
Dow is Consolidating in 20500 Zone
Dow is consolidating in 20500 zone on Tuesday after extension of pullback from 21160 peak hit fresh low at 20355 on Monday. Rising 55SMA contained dip, offering solid support at 20393 today.
Yesterday's strong downside rejection that left long-tailed Doji candle, signals indecision that may result in extended consolidation.
Upside attempts were so far capped by falling and thickening hourly cloud that prevents near-term studies of further strengthening.
Daily technicals are weak and favor renewed attacks at 55SMA, break of which would expose the top of rising daily cloud (currently at 20318), which is expected to ideally contain correction from 21160.
Meantime, extended upticks cannot be ruled out, with initial barrier at 20607 (broken Fibo 38.2% of 19713/21160) and daily Tenkan-sen (currently at 20692) expected to cap.
Res: 20539; 20607; 20663; 20692
Sup: 20498; 20437; 20393; 20355
Markets Take a Risk Pause, Brexit Divorce Next
Tuesday March 28: Five things the markets are talking about
The GOP's healthcare failure has not derailed market sentiment about fiscal stimulus it has temporarily modified it.
For now, with the pendulum of U.S political momentum having swayed in favor of 'gridlock' continues to hamper the "big" dollars natural progress and pressure both bond yields and equity prices.
However, in relatively quiet trading, that pace of decline has subsided somewhat overnight. To reignite capital markets bullish momentum investors will want to see concrete details about U.S tax reforms, infrastructure spending and deregulation.
It's believed that President Trump is prepared to work more with the Democrats, after feeling burned by sectors of his own party, while combining tax reform with an infrastructure investment initiative that may be an easier sell to the 'left.'
Remember, legislative gridlock stateside is not unusual, just look to the final years of the Obama administration, yet the stock market and the U.S dollar performed somewhat admirably.
U.K. Prime Minister Theresa May will tomorrow formally trigger the start of two-years of Brexit negotiations with a letter announcing Britain's planned withdrawal from the EU.
1. Global equities stop the bleeding
The selloff in riskier global assets has eased, with most equity markets resuming their upward trajectories as the dollar steadies after U.S stocks staged a recovery on Monday.
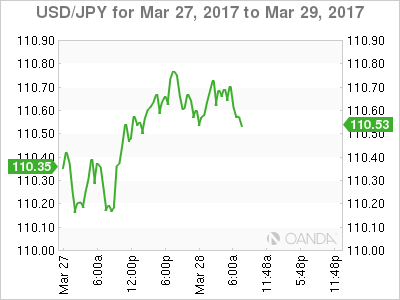
In Japan, the Nikkei share average rebounded (+1.1%) from a more than six-week low overnight as a rally in the yen (¥110.66) paused and investors bought high-yield stocks before they went ex-dividend. The broader Topix gained +1.3%.
In Hong Kong, stocks resisted China's downdraft and followed Asia higher on cautious hopes that U.S. President Trump would eventually be able to pass his planned economic stimulus policies. The Hang Seng index rose +0.6%, while the China Enterprises Index also gained +0.6%.
In China, stocks fell overnight on concerns about tightening liquidity conditions after the People's Bank of China (PBoC) refrained from injecting short-term funds into the banking system for the third consecutive session. The blue-chip CSI300 index fell -0.2%, while the Shanghai Composite Index lost -0.4%.
In Europe, equity indices are trading generally higher across the board. Banking stocks are mixed in the Eurostoxx, while commodity and mining shares support the FTSE 100.
U.S stocks are set to open little changed (+0.1%).
Indices: Stoxx50 +0.3% at 3,446, FTSE flat at 7,294, DAX +0.6% at 12,067, CAC-40 flat at 5,017, IBEX-35 +0.4% at 10,346, FTSE MIB +0.4% at 20,205, SMI +0.2% at 8,611, S&P 500 Futures +0.1%
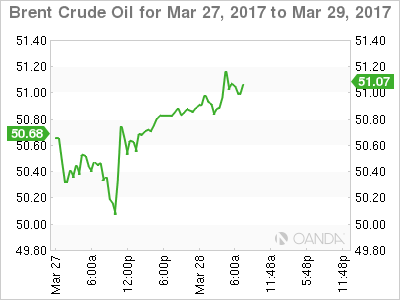
2. Oil rises on weak dollar, but bloated supply still weighs, gold steady
Currently, oil prices are being supported by a weaker dollar, but these prices gain are somewhat capped by surging U.S production and market uncertainty over whether an OPEC-led supply cut is big enough to rebalance the global market.
Prices for front-month Brent crude futures have gained +18c from Monday's close to +$50.93 per barrel, while West Texas Intermediate (WTI) crude futures are up +20c at +$47.93 a barrel.
Note: The greenback has lost -3% in March vs. G10 currencies on U.S political doubts.
Soaring production stateside and packed inventories have made U.S WTI crude much cheaper than international Brent, which is being supported above $50 per barrel by last Nov. OPEC-led output cut.
Note: Last weekend, an OPEC and non-OPEC Joint Compliance Committee agreed to review whether oil output cuts should be extended by six-months. They stopped short of an earlier draft statement that said the committee recommended keeping the Nov. measure in place.
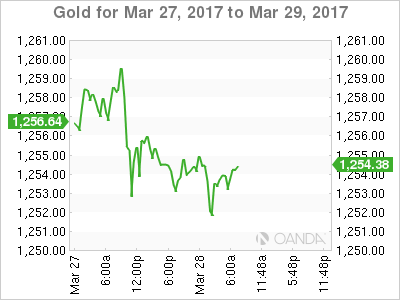
Ahead of the U.S open, gold prices (+$1,253.83) are steady as investors look to see if President Trump would be able to enact promised tax cuts and infrastructure spending.
Note: The 'yellow' metal has already rallied sharply from its Mar. 15 low ($1,197.18) following a less-hawkish-than-expected policy statement from the Fed.
3. Global yields struggling to climb
The uncertainty surrounding the Trump administration's ability to deliver on policy proposals is weighing on investor expectations for higher U.S interest rates.
Bets that the Fed will raise rates in June have fallen to +48.5% from +54% on Friday. Also, the market is pricing in a +52% chance that the Fed will raise rates at least two more times this year, compared to +55% on Friday.
This week's supply concentrates on shorter-dated U.S Treasuries, which explains why short-term product is underperform longer-dated bonds.
Despite lower yields, foreign demand for yesterday's $26B U.S 2-year auction (+1.26%) was the highest since Feb 2016. A proxy for foreign demand, indirect bidding, was +53.6%. The bid-to-cover ratio (overall demand) was 2.73 vs. the average of 2.64 for the past six-sales.
Note: The alternative product for the Euro investor is the German 2-year Schatz, but the similar maturity currently has a yield below zero (-0.71%).
U.S 10 year notes are little changed, up +1 bps at +2.39%.
4. Dollar Vols for the 'big-three' rise
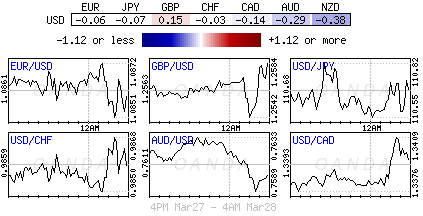
With the U.S dollar having weakened to a four-month low amid fears the Trump administration won't be able to deliver on its policy goals has volatility (Vols) in some major currency pairs trading atop of their multi-week highs.
Implied volatility for JPY over the next-month has risen to its highest level since March 3. Implied volatility in the EUR is at its highest level since Feb. 23. While GBP is little changed week-over-week, despite the pound topping £1.2600 yesterday for the first time since Feb 1.
Note: U.K. Prime Minister Theresa May will tomorrow formally trigger the start of two-years of Brexit negotiations with a letter announcing Britain's planned withdrawal from the EU.
EUR/USD is steady at €1.0860, USD/JPY at ¥110.65 and GBP/USD moving back towards the psychological £1.26 level.
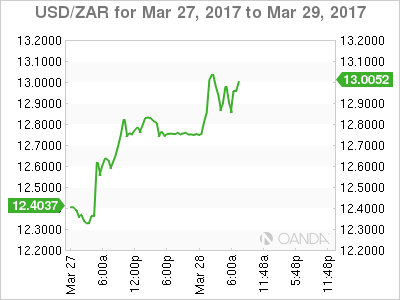
5. Rand Collapses As Zuma Threatens to Sack Finance Minister
South Africa's rand (ZAR) took another tumble overnight when President Zuma's suddenly decided to recall his finance minister, Pravin Gordhan, from London. Investors are viewing this as a sign of escalating tensions between the two.
Note: The general feeling is that the only thing standing between South Africa and a multi-agency downgrade of its sovereign debt to junk status is Mr. Gordhan.
The ZAR lost more than -2% to $13.0968 outright, after having dropped -2.4% yesterday in its steepest intraday loss in six-months.
Yields in dollar-denominated sovereign debt and local government benchmark bonds also jumped. Prior to this drop, the currency had gained +9.5% year-to-date, making it a top EM performer.
USD/CAD – Canadian Dollar Under Pressure At 1.34 On Trump Concerns
USD/CAD has posted small gains on Tuesday, continuing the upward trend which marked the Monday session. Currently, the pair is trading at the 1.34 level. On the release front, it's another quiet day. In the US, today's highlight is CB Consumer Confidence, which is expected to dip to 113.9 points. The sole event in Canada is a speech from BoC Governor Stephen Poloz in Oshawa.
Donald Trump is used to getting his way in the private sector and on reality TV, but he had to swallow a bitter pill last week as he suffered his first major setback as president. His bill to replace the Affordable Care Act was pulled before it even went to a vote on the House floor, despite the Republicans enjoying a majority in Congress. This bruising defeat has sent the US dollar sharply lower, and sent market jitters higher. Trump's administration has stumbled out of the starting gate, and after more than two months in office, he has yet to provide any details over even an outline of economic policy. The inquiry into the Trump administration's links with Russia is gathering steam, and is another cause for concern for nervous investors. Trump has said he will now focus on tax reform, but he has his work cut out, trying to convince a skeptical Congress and general public that he can deliver the goods and pass new, effective legislation.
Weaker oil prices could weigh on the soft Canadian dollar. West Texas crude has dropped 1.0% in March, and dipped to $47.05 last week, its lowest level since the end of November. Crude headed lower after Crude Oil Inventories posted a strong surplus of 5.0 million barrels, crushing the estimate of 1.9 million. The weekly indicator has recorded only two declines in 2017, as US oil drillers continue to enter the market and ratchet up US oil production. This, together with increased US shale production, has more than offset OPEC's production cuts. Last week, OPEC announced it was considering extending the production cut agreement by another 6 months, until the end of 2017, but it's doubtful that such a move will prop up oil prices.