Sample Category Title
EUR/CHF Buying Pressures Are Too Weak, EUR/JPY Continued Bearish Pressures, EUR/GBP Riding Downtrend Channel.
EUR/CHF Buying pressures are too weak.
EUR/CHF's is moving up and down. The medium-term pattern suggests us to see continued bearish pressures towards key support that can be found at 1.0623 (24/06/2016 low).
In the longer term, the technical structure is mixed. Resistance can be found at 1.1200 (04/02/2015 high). Yet,the ECB's QE programme is likely to cause persistent selling pressures on the euro, which should weigh on EUR/CHF. Supports can be found at 1.0184 (28/01/2015 low) and 1.0082 (27/01/2015 low).
EUR/JPY Continued bearish pressures.
EUR/JPY rejection at 122.88 has triggered a correction. The pair is also very volatile. Hourly support can be found at 119.33 (23/03/2017 low). Resistance stands at 122.88 (13/03/0217 high). Expected to show continued weakness.
In the longer term, the technical structure validates a medium-term succession of lower highs and lower lows. As a result, the resistance at 149.78 (08/12/2014 high) has likely marked the end of the rise that started in July 2012. Strong support at 94.12 (24/07/2012 low) looks nonetheless far away.
EUR/GBP Riding downtrend channel.
EUR/GBP continues to head lower. Closer resistance can be found at 0.8787 (13/03/2017 high). Key resistance is given at 0.8854 (15/01/2017 high). Hourly support located at 0.8645( 05/02/2017 low) has been broken but the pair has failed to hold below this level. Expected to show continued weakness.
In the long-term, the pair has largely recovered from recent lows in 2015. The technical structure suggests a growing upside momentum. The pair is trading above from its 200 DMA. Strong resistance can be found at 0.9500 psychological level.
Forex Technical Analysis
EUR/USD
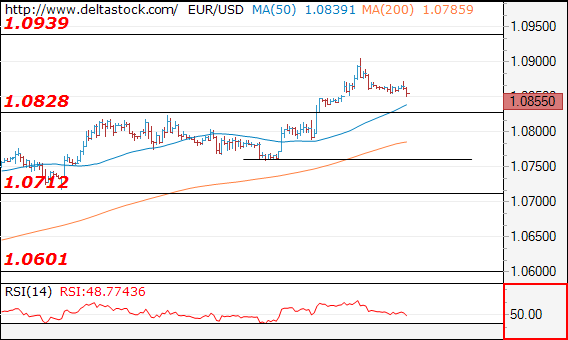
Current level - 10855
Yesterday's peak at 1.0904 was followed by a minor reversal and the intraday bias is slightly negative, for a tight test of 1.0820 support area. The latter is still a base for another leg upwards, to 1.0940. Crucial on the downside is 1.0760 and only a violation of that low will signal a major reversal and a bearish bias for 1.0600.
| Resistance | Support | ||
| intraday | intraweek | intraday | intraweek |
| 1.0870 | 1.0940 | 1.0828 | 1.0712 |
| 1.0940 | 1.1010 | 1.0760 | 1.0600 |
USD/JPY
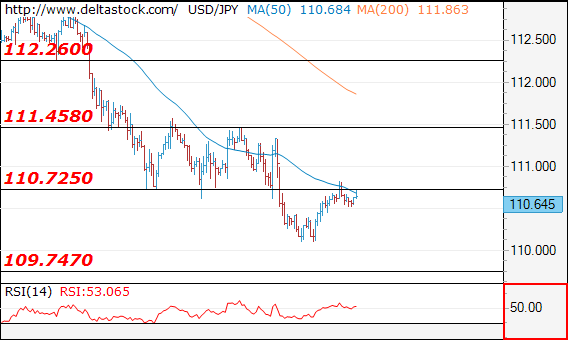
Current level - 110.64
Despite yesterday's rebound above 111.09, the outlook remains bearish below 110.70, for another attempt towards 109.75. Crucial on the upside is 111.45.
| Resistance | Support | ||
| intraday | intraweek | intraday | intraweek |
| 110.75 | 113.50 | 109.75 | 109.75 |
| 111.45 | 115.65 | 108.50 | 107.80 |
GBP/USD
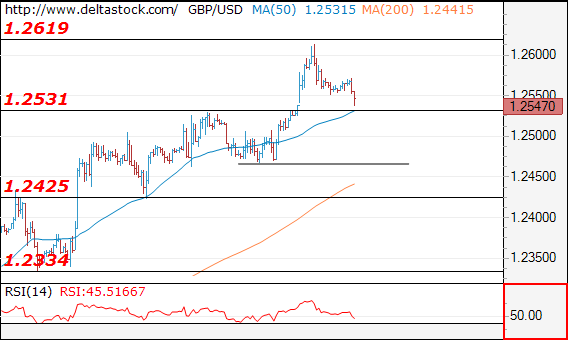
Current level - 1.2547
Current pullback below 1.2620 resistance should be considered corrective, preceding an advance towards 1.2650 area. Intraday support leis at 1.2530 and crucial on the downside is 1.2470.
| Resistance | Support | ||
| intraday | intraweek | intraday | intraweek |
| 1.2570 | 1.2570 | 1.2470 | 1.2107 |
| 1.2620 | 1.2705 | 1.2335 | 1.1984 |
Trade Idea: EUR/JPY – Stand aside
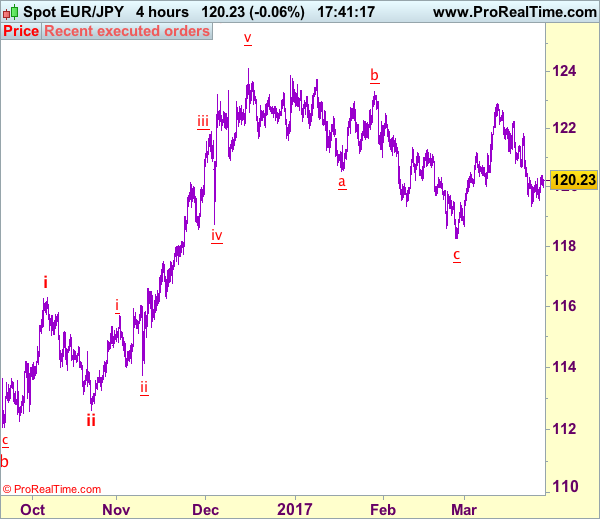
EUR/JPY - 120.23
Recent wave: wave v of (C) ended at 94.12 and major correction in wave A has ended at 149.79
Trend: Near term up
New strategy :
Stand aside
Position: -
Target: -
Stop:-
Although the single currency edged higher after rebound from 119.54 and near term upside risk remains for the corrective bounce from 119.32 to extend gain to 120.60-70, as this move is viewed as retracement of recent decline, reckon upside would be limited to 121.15-20, bring retreat later. Only break of 121.84 resistance would revive bullishness and signal the fall from 122.89 has ended, bring further gain to 122.25-30 first.
On the downside, below 119.80 would bring test of said support at 119.54 but break there is needed to signal the fall from 122.89 top has resumed and may extend weakness to 119.00, then 118.67 support but loss of momentum should prevent sharp fall below latter level and price should stay well above previous chart support at 118.25, risk from there is seen for a rebound later.
Our latest preferred count is that wave (ii) is ABC-X-ABC which ended at 123.33 and wave (iii) is unfolding with wave iii ended at 100.77, followed by wave iv at 111.57 and wave v as well as the wave (iii) has ended at 97.04, followed by wave (iv) at 111.43 and wave (v) has ended at 94.12 which is also the end of the larger degree v, this also implied the major wave (C) has also ended there, hence major correction has commenced from there with (A) leg unfolding in its lower degree wave c which has possibly ended at 145.69. Under this count, A-B-C wave (B) has commenced with A leg ended at 136.23, wave B at 143.79 and wave C has possibly ended at 149.79.
Our larger degree count is that the decline from 139.26 is wave (C) and is sub-divided into a diagonal triangle i-ii-iii-iv-v with wave i - 105.44, wave ii- 123.33, wave iii - 97.03, wave iv - 111.43, followed by the final wave v as well as the end of wave (C) at 94.12, this also mark the bottom of larger degree wave B. Under this count, major rise in wave C has commenced as an impulsive wave with minor wave III ended at 145.69, wave V is still in progress for further gain to 150.00. Having said that, this so-called wave V could well be the first leg of larger degree 5-waver wave C and this wave C should bring at least a retest of wave A top at 169.97 (July 2008).
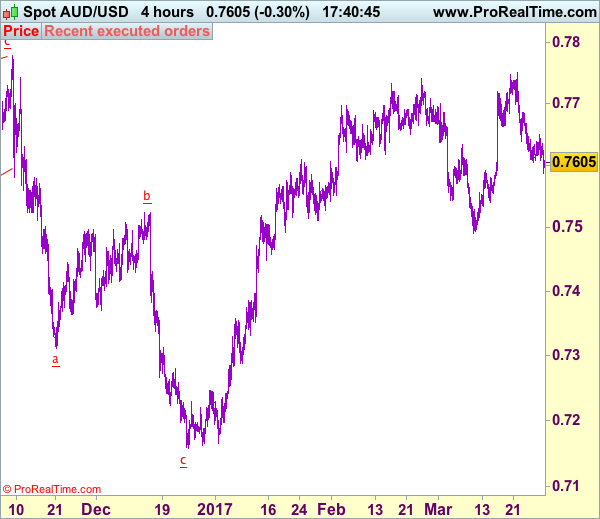
Trade Idea: AUD/USD – Hold long entered at 0.7645
AUD/USD – 0.7608
Recent wave: Wave 5 ended at 1.1081 and major correction has commenced for fall to 0.7000 and then towards 0.6500-10
Trend: Near term up
Original strategy :
Bought at 0.7645, Target: 0.7800, Stop: 0.7585
Position: - Long at 0.7645
Target: - 0.7800
Stop: - 0.7585
New strategy :
Hold long entered at 0.7645, Target: 0.7800, Stop: 0.7585
Position: - Long at 0.7645
Target: - 0.7800
Stop:- 0.7585
Although aussie has fallen again after meeting resistance at 0.7649, loss of near term downward momentum should prevent sharp fall from here and bring rebound later, above said resistance at 0.7649 would signal low is formed, bring a stronger rebound to 0.7685, break there would signal the retreat from 0.7750 (last week’s high) has ended, then retest of this level would follow, above this resistance would extend gain to 0.7778 (last year’s high), however, break there is needed to retain bullishness and extend headway to 0.7840-50 but price should falter below 0.7900.
In view of this, we are holding on to our long position entered at 0.7645. Only below 0.7585 would abort and signal top is formed instead, then further choppy trading would take place and risk is seen for pullback to 0.7530-40 but indicated support at 0.7491 should remain intact.
On the 4-hour chart, the move from 0.8066 is the wave 5 with i: 0.8860, ii: 0.8315, wave iii is an extended move ended at 1.0183, iv: 0.9706 and wave v has ended at 1.1081 (also the top of entire wave 5). The subsequent selloff is the major correction which is unfolding as ABC-X-ABC and 2nd A leg has ended at 0.8848, followed by a-b-c wave B which ended at 0.9758, hence, 2nd C wave is now in progress and indicated downside target at 0.7000 and 0.6950 had been met, so further fall to 0.6710-20 cannot be ruled out.
USD/CHF Weakening, USD/CAD Holding Below 1.3400, AUD/USD Pushing Lower.
USD/CHF Weakening.
USD/CHF is declining. Hourly support is given at 0.9862 (31/01/2017 low) has been broken. Key resistance can be found at a distance at 1.0344 (15/12/2016 high). Expected to show continued weakness.
In the long-term, the pair is still trading in range since 2011 despite some turmoil when the SNB unpegged the CHF. Key support can be found 0.8986 (30/01/2015 low). The technical structure favours nonetheless a long term bullish bias since the unpeg in January 2015.
USD/CAD Holding below 1.3400.
USD/CAD is bouncing. However a break of resistance area around 1.3400 is needed to invalidate the current short term bearish technical structure. The road seems still wideopen for larger decline. Key support is given at 1.2969 (31/01/2017 low).
In the longer term, there is a golden cross with the 50 dma crossing the 200 dma indicating further upside pressures. Strong resistance is given at 1.4690 (22/01/2016 high). Long-term support can be found at 1.2461 (16/03/2015 low).
AUD/USD Pushing lower.
AUD/USD is correcting lower since the pair has failed to test the key resistance at 0.7778 (08/11/2016 high). Expected to see some shortterm weakness towards support area around 0.7500.
In the long-term, we are waiting for further signs that the current downtrend is ending. Key supports stand at 0.6009 (31/10/2008 low) . A break of the key resistance at 0.8295 (15/01/2015 high) is needed to invalidate our long-term bearish view.
EUR/USD Breaking Resistance Given At 1.0874, GBP/USD Edging Higher, USD/JPY Ready For Further Weakness.
EUR/USD Breaking resistance given at 1.0874.
EUR/USD keeps on pushing higher towards key resistance given at 1.0874 (08/12/2017 high) has been broken. Strong support can be found at 1.0493 (22/02/2017 low). Expected to show continued increase.
In the longer term, the death cross late October indicated a further bearish bias. The pair has broken key support given at 1.0458 (16/03/2015 low). Key resistance holds at 1.1714 (24/08/2015 high). Expected to head towards parity.
GBP/USD Edging higher.
GBP/USD now lies in a short-term uptrend channel. There are rooms for further strength. Hourly resistance located at 1.2570 (24/02/2017 high) has been broken. Hourly support is given at 1.2324 (03/17/2017 low). Expected to show continued strength towards resistance at 1.2771 (05/10/2016 high).
The long-term technical pattern is even more negative since the Brexit vote has paved the way for further decline. Long-term support given at 1.0520 (01/03/85) represents a decent target. Long-term resistance is given at 1.5018 (24/06/2015) and would indicate a long-term reversal in the negative trend. Yet, it is very unlikely at the moment.
USD/JPY Ready for further weakness.
USD/JPY continues its declined since the pair has failed to break key resistance given at 115.62 (19/01/2016 high). The pair is heading lower. Hourly resistance can be located at 113.57 (16/03/2017 high).
We favor a long-term bearish bias. Support is now given at 96.57 (10/08/2013 low). A gradual rise towards the major resistance at 135.15 (01/02/2002 high) seems absolutely unlikely. Expected to decline further support at 93.79 (13/06/2013 low).

AUDUSD Is Holding In The Daily Cloud, Further Downside Seen After Consolidation
The Aussie remains under pressure and penetrated into thick daily cloud that offered temporary support in previous sessions.
Yesterday's close below cloud top (0.7631) and daily Kijun-sen (0.7618) generated bearish signal, with the pair holding firmly in the cloud today and met next target at 0.7588 (Fibo 61.8% of 0.7489/0.7747 upleg).
This also marks pivotal support and close below it would trigger further downside extension towards next significant support at 0.7544 (200SMA).
Daily bulls are fading and support further easing, however, oversold slow stochastic suggests that near-term bears may be paused.
The pair is currently moving between 0.7588 Fibo support and daily cloud top (currently at 0.7631), which is expected to cap and keep near-term bears in play for fresh attempts lower.
Res: 0.7618, 0.7631, 0.7649, 0.7666
Sup: 0.7588, 0.7544, 0.7531, 0.7489
EUR/USD – Euro Subdued, US Consumer Confidence Next
EUR/USD is almost unchanged on Tuesday, as the pair trades at 1.0860. On the release front, there are no eurozone events. In the US, today's highlight is CB Consumer Confidence, which is expected to dip to 113.9 points.
The improving euro punched above the 1.09 level on Monday, its highest level since November 2016. The currency was boosted by an excellent reading from German Ifo Business Climate, which rose to 112. 3 points. This marked its highest level since July 2011. The release underscores high optimism in the business sector, despite rumblings of protectionism from the US and the uncertainty in Europe over the imminent Brexit negotiations. Germany, the largest economy in Europe, continues to post strong numbers, which has been good news for the eurozone economy. Last week's PMIs pointed to expansion in the manufacturing and service sectors. German and eurozone Manufacturing PMIs both beat their estimates and hit their highest levels since 2011. Later this week, Germany releases key indicators, including CPI, retail sales and unemployment claims. One soft spot in the economy, however, is consumer confidence. GfK German Consumer Climate lost ground for a second straight month, as the indicator dropped to 9.8 in March, its lowest level since November 2016. Eurozone Consumer Confidence remains weak, as the indicator posted a decline of -5 in March, almost unchanged from a month earlier. These soft numbers are largely a result of higher inflation, as consumers are concerned about their reduced purchasing power. If inflation levels head higher, consumers could respond by curtailing spending, which could hamper economic growth.
Donald Trump suffered his first major setback as president last week, as his bill to replace the Affordable Care Act was pulled before it even went to a vote. Trump is used to giving the orders in the private sector and on reality TV, but he didn't get his way on healthcare, despite the Republicans enjoying a majority in Congress. This bruising defeat has sent the US dollar sharply lower, and sent market jitters higher. Trump's administration has stumbled out of the starting gate, and after more than two months in office, he has yet to provide any details over even an outline of economic policy. The inquiry into the Trump administration's links with Russia is gathering steam, and is another cause for concern for nervous investors. Trump has said he will now focus on tax reform, but he has his work cut out, trying to convince a skeptical Congress and general public that he can deliver the goods and pass new, effective legislation.
ZAR Fell Amid Rising Political Uncertainty, USD Consolidates
News and Events:
ZAR slides as political uncertainty rises
The South African rand was one of the few currencies that did not make the most of the broad USD sell-off. Since Monday, USD/ZAR surged 4.3% and hit the 13.00 threshold for the first time since March 15th amid rising political uncertainty. On Monday, Finance Minister Pravin Gordhan was recalled by President Zuma from an investor roadshow to face a court showdown today. Rumours are now circulating that President Jacob Zuma will soon request Minister Gordhan to step down. Finding a potential successor will be a tall order and the uncertainty has caused investors to pull back from sovereign bonds sending 10-year yields up 47bps to 8.80%.
However, the market is used to sudden spikes in volatility caused by Zuma's government; therefore we expect that pressure should soon return to normal levels as investors resume their hunt for yields. USD/ZAR should quickly return towards the 12.50 level in the short-term.
Stick with core driver over short term Trump hype
Our core drive for macro asset pricing for the last five years has been that global central banks accommodating policy will support risk taking. Brexit, Trump, terrorism for all their thunder can move investors off cheap capital. If the prospect of breaking up the world's largest economic union in 2 days (UK triggering Article 50) elicit panic stampede of risk aversion why would prospect of US political grid lock? We cautioned investors from getting stuck on transitional headlines and nonstructural forced pullback (risk valuations are high) as opportunity to reposition long. Asia stock indices reversed the US decline indicating that traders have already shifted from the Trump story. Additional weakness in US yields curve has help support risk taking (US 10 year stabilized at 2.37%). USD has been weaker against most EM currencies especially RUB and MXN, as Chicago Fed President Evans provided a dovish tone (not surprising). He indicated that failure of the repeal Obamacare bill increased uncertainty and should naturally lower prospects of a Fed hike. This new cycle highlights risk of chasing volatility verse sticking to the core driver. On the docket today two know hawks in Kaplan and George will keep the hopes of a June hike alive. We remain bullish on risk despite evidence of overstretch USD selling viewing the opportunity to harvest carry as a rationale to participate in higher yielders (limited macro risk). The lone exception would be our short trade EURCHF which is expected to grind lower, placing the SNB in a very difficult situation.
Mexico regains some strength despite Trump
Markets are pricing in further difficulties for Trump to deliver his program. The never-ending story of Trump's wall for the Mexican border is far from over, yet it seems very difficult to imagine how it will be financed, though we recall that his initial thoughts were that Mexico should pay for it themselves.
Economically, Mexico is closely scrutinising any and all developments from the Fed. This Thursday, Banxico will likely increase its overnight rate to 6.5% from 6.25%. The Mexican central bank has changed its meeting dates to closely follow FOMC meetings in order to make sure that Mexican monetary policy is not surprised by any Fed moves. One of Banxico's main objectives is to keep a rate spread between itself and the US to avoid any capital outflow.
Currency-wise, the MXN, which has suffered from Trump's election, has strengthened since mid-January. Other data, shows that Mexico has regained some colour in its cheeks, including trade deficit which narrowed in February from $736 million in January to $398 million and factory exports, which have also enjoyed a boost.
Furthermore, we firmly believe that Trump will face major challenges in attempting to rewrite the NAFTA (North American free-trade agreement), which has tied Canada, the US and Mexico for more than two decades. For this reason, we believe that there is further room for MXN and we target 16.00 before year-end.
Today's Key Issues (time in GMT):
- Jan Industrial Orders MoM, exp -2,60%, last 2,80%, rev 3,00% EUR / 08:00
- Jan Industrial Orders NSA YoY, last -0,90% EUR / 08:00
- Jan Industrial Sales MoM, last 2,60%, rev 2,50% EUR / 08:00
- Jan Industrial Sales WDA YoY, last 9,40% EUR / 08:00
- mars.23 FIPE CPI - Weekly, exp 0,06%, last 0,02% BRL / 08:00
- 4Q Non-Farm Payrolls QoQ, last 1,00% ZAR / 09:30
- 4Q Non-Farm Payrolls YoY, last 0,90% ZAR / 09:30
- ECB's Makuch Speaks in Bratislava EUR / 11:00
- Mar FGV Construction Costs MoM, exp 0,50%, last 0,53% BRL / 11:00
- Jan House Price Index YoY, last 12,22% TRY / 11:30
- Jan House Price Index MoM, last 0,81% TRY / 11:30
- ECB's Benoit Coeure in Panel Discussion in Brussels EUR / 11:45
- Feb PPI Manufacturing MoM, last 0,28% BRL / 12:00
- Feb PPI Manufacturing YoY, last -0,03% BRL / 12:00
- Feb Advance Goods Trade Balance, exp -$66.4b, last -$69.2b, rev -$68.8b USD / 12:30
- Feb P Wholesale Inventories MoM, exp 0,20%, last -0,20% USD / 12:30
- Feb Retail Inventories MoM, last 0,80% USD / 12:30
- Jan S&P CoreLogic CS 20-City MoM SA, exp 0,70%, last 0,93% USD / 13:00
- Jan S&P CoreLogic CS 20-City YoY NSA, exp 5,60%, last 5,58% USD / 13:00
- Jan S&P CoreLogic CS 20-City NSA Index, last 192,61 USD / 13:00
- Jan S&P CoreLogic CS US HPI YoY NSA, last 5,85% USD / 13:00
- Jan S&P CoreLogic CS US HPI NSA Index, last 185,54 USD / 13:00
- Mar Conf. Board Consumer Confidence, exp 114, last 114,8 USD / 14:00
- Mar Conf. Board Present Situation, last 133,4 USD / 14:00
- Mar Conf. Board Expectations, last 102,4 USD / 14:00
- Mar Richmond Fed Manufact. Index, exp 15, last 17 USD / 14:00
- Bank of Canada Governor Stephen Poloz Speech in Oshawa CAD / 14:10
- Bank of Canada Governor Stephen Poloz Press Conference CAD / 15:10
- Bank of Italy Governor Visco Speaks at Book Presentation EUR / 15:30
- SNB's Maechler Speaks in Geneva CHF / 16:30
- Fed's George Speaks in Midwest City, OK USD / 16:45
- Fed Chair Janet Yellen Speaks USD / 16:50
- Fed's Kaplan Speaks in Dallas USD / 17:00
- Fed Governor Jerome Powell Speaks USD / 20:30
- Apr Business Survey Manufacturing, last 81 KRW / 21:00
- Apr Business Survey Non-Manufacturing, last 77 KRW / 21:00
The Risk Today:
EUR/USD keeps on pushing higher towards key resistance given at 1.0874 (08/12/2017 high) has been broken. Strong support can be found at 1.0493 (22/02/2017 low). Expected to show continued increase. In the longer term, the death cross late October indicated a further bearish bias. The pair has broken key support given at 1.0458 (16/03/2015 low). Key resistance holds at 1.1714 (24/08/2015 high). Expected to head towards parity.
GBP/USD now lies in a short-term uptrend channel. There are rooms for further strength. Hourly resistance located at 1.2570 (24/02/2017 high) has been broken. Hourly support is given at 1.2324 (03/17/2017 low). Expected to show continued strength towards resistance at 1.2771 (05/10/2016 high). The long-term technical pattern is even more negative since the Brexit vote has paved the way for further decline. Long-term support given at 1.0520 (01/03/85) represents a decent target. Long-term resistance is given at 1.5018 (24/06/2015) and would indicate a long-term reversal in the negative trend. Yet, it is very unlikely at the moment.
USD/JPY continues its declined since the pair has failed to break key resistance given at 115.62 (19/01/2016 high). The pair is heading lower. Hourly resistance can be located at 113.57 (16/03/2017 high). We favor a long-term bearish bias. Support is now given at 96.57 (10/08/2013 low). A gradual rise towards the major resistance at 135.15 (01/02/2002 high) seems absolutely unlikely. Expected to decline further support at 93.79 (13/06/2013 low).
USD/CHF is declining. Hourly support is given at 0.9862 (31/01/2017 low) has been broken. Key resistance can be found at a distance at 1.0344 (15/12/2016 high). Expected to show continued weakness. In the long-term, the pair is still trading in range since 2011 despite some turmoil when the SNB unpegged the CHF. Key support can be found 0.8986 (30/01/2015 low). The technical structure favours nonetheless a long term bullish bias since the unpeg in January 2015.
| EURUSD | GBPUSD | USDCHF | USDJPY |
| 1.1300 | 1.3445 | 1.0652 | 121.69 |
| 1.0954 | 1.3121 | 1.0344 | 118.66 |
| 1.0906 | 1.2771 | 1.0171 | 115.62 |
| 1.0859 | 1.2589 | 0.9857 | 110.67 |
| 1.0494 | 1.1986 | 0.9550 | 106.57 |
| 1.0341 | 1.1841 | 0.9444 | 106.04 |
| 1.0000 | 1.0520 | 0.9259 | 101.20 |
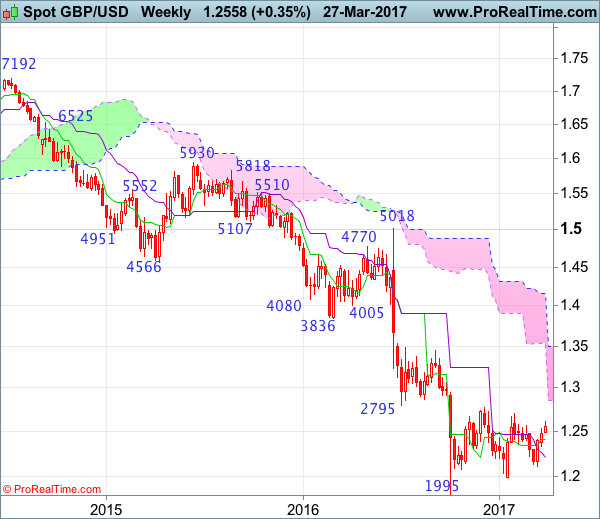
GBP/USD Candlesticks and Ichimoku Analysis
Weekly
• Last Candlesticks pattern: Shooting star
• Time of formation: 5 Sep 2016
• Trend bias: Down
Daily
• Last Candlesticks pattern: Long black candlestick
• Time of formation: 24 Jun 2016
• Trend bias: Down
GBP/USD – 1.2583
The British pound has risen again after brief pullback and upside bias remains for the rise from 1.2109 to extend further gain to 1.2640-50, however, as broad outlook remains consolidative, reckon upside would be limited and price should falter well below indicated previous resistance at 1.2706, bring retreat later. In the event cable is able to penetrate resistance at 1.2706, this would retain bullishness and extend the erratic rise from 1.1986 low towards another previous resistance at 1.2775 first.
On the downside, whilst initial pullback to 1.2490-00 cannot be ruled out, reckon the Tenkan-Sen (now at 1.2429) would limit downside and bring another rise later to aforesaid upside target. Below the Kijun-Sen (now at 1.2363) would suggest top is possibly formed, bring test of support at 1.2335 but a daily close below said support at 1.2335 is needed to confirm and suggest the rebound from 1.2109 has ended instead, risk weakness to 1.2240-45 and possibly towards 1.2200, however, price should stay well above said support at 1.2109 (this month’s low), bring rebound later.
Recommendation: Buy at 1.2470 for 1.2670 with stop below 1.2370.
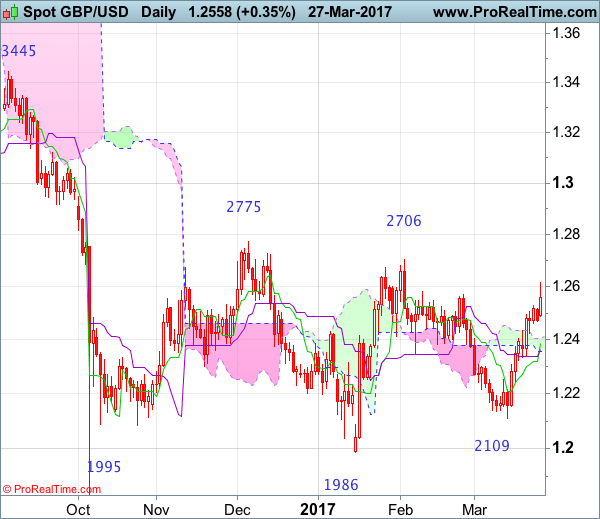
On the weekly chart, cable has continued moving higher after staging a strong rebound from 1.2109, adding credence to our bullish view that another leg of corrective rise from 1.1986 low is underway and may extend gain to 1.2706 resistance but break there is needed to provide confirmation, bring retracement of early downtrend for test of previous resistance at 1.2775 and later 1.2850-60 but price should falter well below psychological resistance at 1.3000.
On the downside, expect pullback to be limited to 1.2465-70 and renewed buying interest should emerge around there, bring another rise later to aforesaid upside targets. Only below support at 1.2335 would abort and prolong choppy trading within recent established broad range, bring further fall to 1.2240-50 but a weekly close below the Kijun-Sen (now at 1.2212) is needed to signal the rebound from 1.2109 has ended, bring further fall to 1.2140-50.