Sample Category Title
USD And Indices Bounce As Technical Support Holds
US equity markets are poised to open slightly higher on Tuesday, building on the recovery we saw throughout yesterday's session after indices started the week lower in response to Donald Trump's failed healthcare bill.
Equity markets rebound after questions raised over Trump's ability to deliver
The failure to generate support for the bill despite delivering a last ditch ultimatum to lawmakers is seen as potentially being a sign of weakness and even political naivety from Trump which has cast doubt on whether he'll face similar problems when it comes to his other policies. Ultimately, the more than 15% rally in equity markets, along with the rise in the US dollar and Treasury yields, since Trump's victory has been built on the belief that he will deliver and if doubts are in fact creeping in, those gains will start to disappear.
Another explanation could simply be that investors are capitalising in on Trump's healthcare issues – a policy that was not a key driver of the rally since November – and locking in some profit on the move. Once markets get back to more attractive levels, we may once again see the dips being bought and optimism in Trump to deliver on tax reform and fiscal stimulus will suddenly return as well. With Trump promising to move on to tax reform now that the healthcare bill failed, we may not have to wait too long for investors to become more optimistic again. That said, if tax reform fails then investors will not be so forgiving.
Key technical support levels being tested in the Dow, S&P and USD
If the latter is true, then the question becomes at which point do investors start seeing value again. The Dow and S&P both rebounded yesterday off their 55-day SMA, the first time they've threatening to break below here since shortly after the election in November. The fact that this coincided with a similar bounce in the US dollar index of its 200-day SMA would suggest both are testing significant support levels at the moment and a break of these could trigger further losses.
Yellen one of four Fed officials making an appearance today
There isn't much to watch on the economic calendar today, with CB consumer confidence and API oil inventories the only notable releases. We will, however, hear from four Fed officials including Chair Janet Yellen. Given how markets have responded to the dovish hike this month, it will be interesting to see whether policy makers remain along these lines or start talking up the prospect for another hike in June.
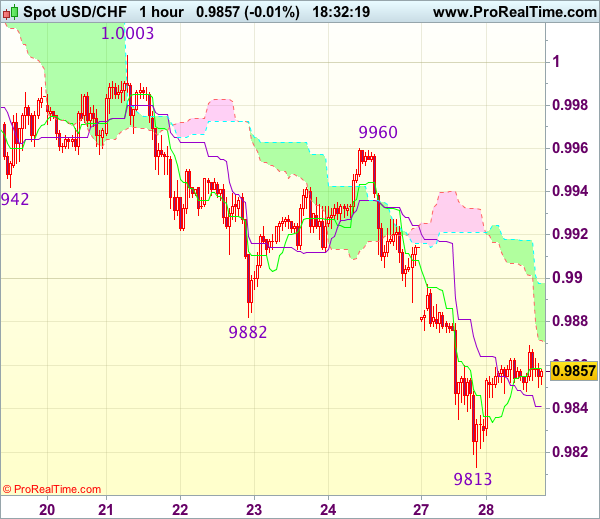
Trade Idea Update: USD/CHF – Sell at 0.9910
USD/CHF - 0.9855
Original strategy :
Sell at 0.9910, Target: 0.9800, Stop: 0.9945
Position : -
Target : -
Stop : -
New strategy :
Sell at 0.9910, Target: 0.9800, Stop: 0.9945
Position : -
Target : -
Stop : -
The greenback found support at 0.9813 yesterday and has recovered, suggesting consolidation above this level would be seen and corrective bounce to 0.9880 is likely but upside should be limited to 0.9900-10 and bring another decline later, below said support at 0.9813 would confirm recent decline has resumed and extend weakness to 0.9795-00, however, loss of downward momentum should prevent sharp fall below 0.9770-75 (100% projection of 1.0171-0.9942 measuring from 1.0003), bring rebound later.
In view of this, would not chase this fall here and we are looking to sell dollar on subsequent rebound as 0.9900-10 should limit upside. Only above said resistance at 0.9960 would abort and signal low is formed, bring retracement of recent decline towards indicated previous resistance at 1.0003.
DAX Punches Above 12,000 As Investors Await Next Trump Move
The DAX Index has edged upwards on Tuesday, as the DAX trades at 12,069.50. It's a quiet day on the release front, with no eurozone events on the schedule. On Wednesday, Germany releases Import Prices, which is expected to dip to 0.4%.
The DAX has pushed above the symbolic 12,000 level this week, bolstered by an excellent reading from German Ifo Business Climate, which rose to 112. 3 points. This marked its highest level since July 2011. The release underscores high optimism in the business sector, despite rumblings of protectionism from the US and the uncertainty in Europe over the imminent Brexit negotiations. Germany, the largest economy in Europe, continues to post strong numbers, which has been good news for the eurozone economy. Last week's PMIs pointed to expansion in the manufacturing and service sectors. German and eurozone Manufacturing PMIs both beat their estimates and hit their highest levels since 2011. Later this week, Germany releases key indicators, including CPI, retail sales and unemployment claims. One soft spot in the economy, however, is consumer confidence. GfK German Consumer Climate lost ground for a second straight month, as the indicator dropped to 9.8 in March, its lowest level since November 2016. Eurozone Consumer Confidence remains weak, as the indicator posted a decline of -5 in March, almost unchanged from a month earlier. These soft numbers are largely a result of higher inflation, as consumers are concerned about their reduced purchasing power. If inflation levels head higher, consumers could respond by curtailing spending, which could hamper economic growth.
Donald Trump is used to getting his way in the private sector and on reality TV, but he had to swallow a bitter pill last week as he suffered his first major setback as president. His bill to replace the Affordable Care Act was pulled before it even went to a vote on the House floor, despite the Republicans enjoying a majority in Congress. This bruising defeat has sent the US dollar sharply lower, and sent market jitters higher. Trump's administration has stumbled out of the starting gate, and after more than two months in office, he has yet to provide any details over even an outline of economic policy. The inquiry into the Trump administration's links with Russia is gathering steam, and is another cause for concern for nervous investors. Trump has said he will now focus on tax reform, but he has his work cut out, trying to convince a skeptical Congress and general public that he can deliver the goods and pass new, effective legislation
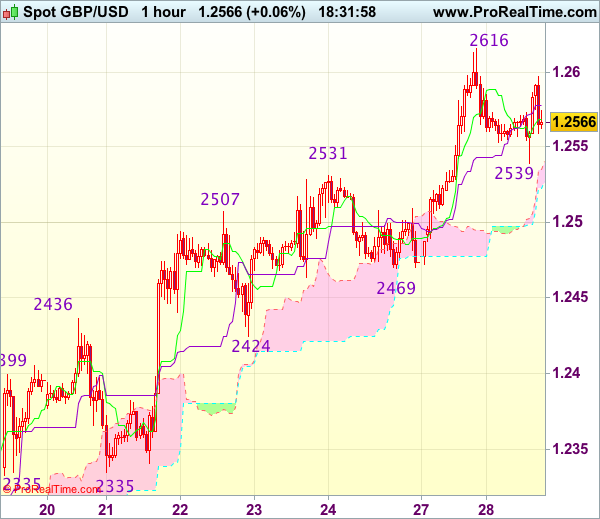
Trade Idea Update: GBP/USD – Buy at 1.2490
GBP/USD - 1.2569
Original strategy :
Buy at 1.2490, Target: 1.2600, Stop: 1.2455
Position : -
Target : -
Stop : -
New strategy :
Buy at 1.2490, Target: 1.2600, Stop: 1.2455
Position : -
Target : -
Stop : -
Cable’s retreat after rising to 1.2616 yesterday suggests consolidation below this level would be seen and below 1.2530 would bring retracement to 1.2490-00, however, price should stay well above support at 1.2469, bring another upmove later, above said resistance at 1.2616 would extend recent rise from 1.2109 to 1.2635-40, however, loss of upward momentum should prevent sharp move beyond 1.2670-80 and price should falter below previous resistance at 1.2706, risk from there is seen for a retreat later.
In view of this, would not chase this rise here and would be prudent to buy cable on subsequent retreat. Only below support at 1.2469 (Friday’s low) would abort and signal top is formed, bring retracement of recent upmove towards previous support at 1.2424 which is likely to hold from here.
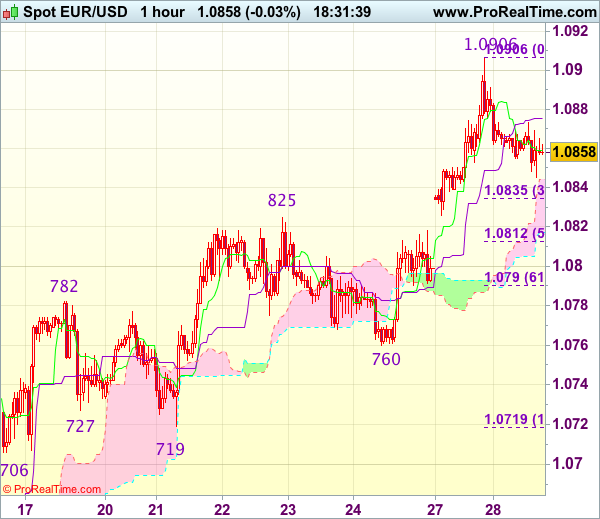
Trade Idea Update: EUR/USD – Buy at 1.0800
EUR/USD - 1.0860
Original strategy :
Buy at 1.0800, Target: 1.0900, Stop: 1.0765
Position : -
Target : -
Stop : -
New strategy :
Buy at 1.0800, Target: 1.0900, Stop: 1.0765
Position : -
Target : -
Stop : -
As the single currency has retreated after surging to 1.0906 yesterday, suggesting consolidation below this level would be seen and pullback to 1.0835 (38.2% Fibonacci retracement of 1.0719-1.0906) is likely, however, reckon downside would be limited to 1.0810-15 (50% Fibonacci retracement), bring another rise later, above said resistance at 1.0906 would extend recent upmove to 1.0930-35 (61.8% Fibonacci retracement of 1.1300-1.0340) but loss of near term upward momentum should prevent sharp move beyond 1.0955-60 and price should falter below 1.0990-00.
In view of this, would not chase this rise here and we are looking to buy euro on subsequent pullback as 1.0800-10 should limit downside. Only below support at 1.0760 would abort and signal top is formed, bring retracement of recent upmove to 1.0730 but 1.0719 support should remain intact.
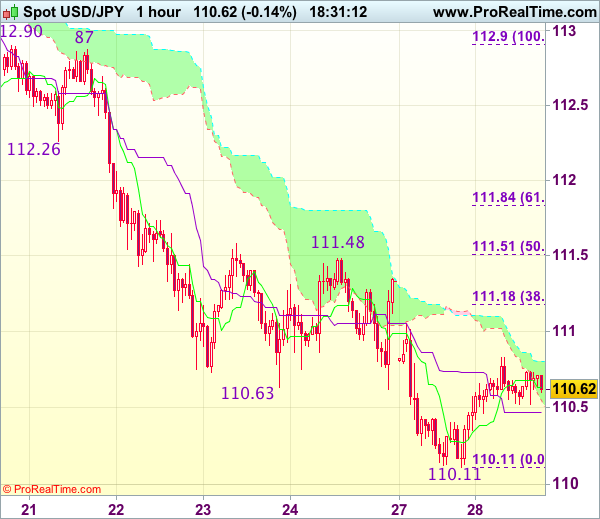
Trade Idea Update: USD/JPY – Sell at 111.20
USD/JPY - 110.62
Original strategy :
Sell at 111.20, Target: 110.20, Stop: 111.55
Position : -
Target : -
Stop : -
New strategy :
Sell at 111.20, Target: 110.20, Stop: 111.55
Position : -
Target : -
Stop : -
The greenback recovered after falling to 110.11 and consolidation above this level would be seen and corrective bounce to 110.95-00 cannot be ruled out, however, reckon upside would be limited to 111.15-20 (38.2% Fibonacci retracement of 112.90-110.11) and price should falter well below resistance at 111.48, bring another decline later, below said support at 110.11 would signal recent decline is still in progress and may extend weakness to 109.95-00 but loss of downward momentum should prevent sharp fall below 109.70-75 and reckon 109.50 would hold.
In view of this, would not chase this fall here and would be prudent to sell dollar on recovery as 111.15-20 should limit upside. Above 111.48-51 (previous resistance and 50% Fibonacci retracement of 112.90-110.11) would abort and signal low is formed, bring a stronger rebound to 111.80-85 first (61.8% Fibonacci retracement).
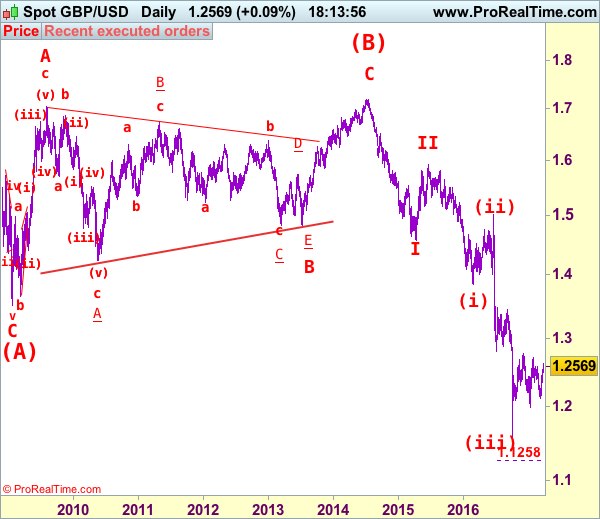
GBP/USD Elliott Wave Analysis
GBP/USD – 1.2463
GBP/USD – Wave 4 is unfolding as an (A)-(B)-(C) and could have ended at 1.7192
Cable has maintained a firm undertone after staging a strong rebound from 1.2109, retaining our bullishness and near term bullishness remains for test of resistance at 1.2706 but break there is needed to signal another leg of corrective upmove from 1.1986 low is underway for further gain to 1.2800 and then 1.2900 but psychological resistance at 1.3000 would remain intact.
Our preferred count on the daily chart is that cable's rebound from 1.3500 (wave (A) trough) is unfolding as a wave (B) with A ended at 1.7043, followed by triangle wave B and wave C as well as wave (B) has possibly ended at 1.7192, below support at 1.4232 would add credence to this count, then further fall to 1.4000 level would follow but reckon downside would be limited to 1.3655 support and price should stay above previous support at 1.3500.
On the downside, whilst initial pullback to 1.2450-60 cannot be ruled out, reckon downside would be limited to 1.2365-70 and bring another rise later. A daily close below support at 1.2335 would dampen this bullish view and bring weakness to 1.2290-00 but reckon 1.2240-50 would hold, bring another rebound. A drop below 1.2240-50 would suggest the rebound from 1.2109 has ended instead, bring further fall to 1.2200 and then 1.2150-60 but said support at 1.2109 should remain intact.
Recommendation: Buy at 1.2370 for 1.2650 with stop above 1.2270.
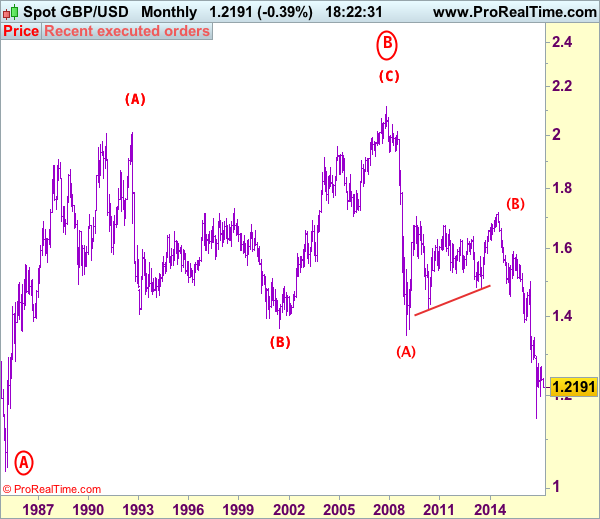
Longer term - Cable's rise from 1.0520 (Feb 1985) to 2.0100 (September 1992) is seen as [A], the decline to 1.3682 is labeled as (B) and (C) wave rally has ended at 2.1162 (9 Nov, 2007) which is also the top of larger degree wave B with circle. The selloff from there is a 5-waver with wave (A) ended at 1.3500 (23 Jan 2009), wave (B) itself is labeled as A: 1.6733, triangle wave B: 1.4813 and wave C as well as top of wave (B) ended at 1.7192 (2014), hence the selloff from there is an impulsive wave (C) with wave I : 1.4566, wave II 1.5930, an extended wave III is unfolding and already exceeded our downside target at 1.3500 and 1.3000, hence weakness to 1.2500 and possibly 1.2000 cannot be ruled out, however, price should stay well above psychological level at 1.0000.
USD/CAD Bullish Cup With Handle Pattern
The USD/CAD has reversed from the bottom, making bullish cup with handle pattern (purple square) with two POC zones that could reject the price towards 1.3420 and 1.3460. POC1 (61.8, EMA89, ATR pivot, handle bottom) could reject the price on the first retracement into the zone, while POC2 1.3325-40 ( D L4, 88.6, trend line, ATR low) is deeper retracement, final intraday support zone and could also reject the price if we see a retracement into the zone. targets for this USD/CAD bullish move are 1.3420 and 1.3460 on a subsequent breakout.
Quick Summary:
W H3 - Weekly H3 Camarilla (Weekly resistance)
POC - Point Of Confluence (The zone where we expect price to react - aka entry zone)
D L4 - Daily L4 Camarilla (Daily support)
GBP/CHF Elliott Wave Analysis
GBP/CHF – 1.2390
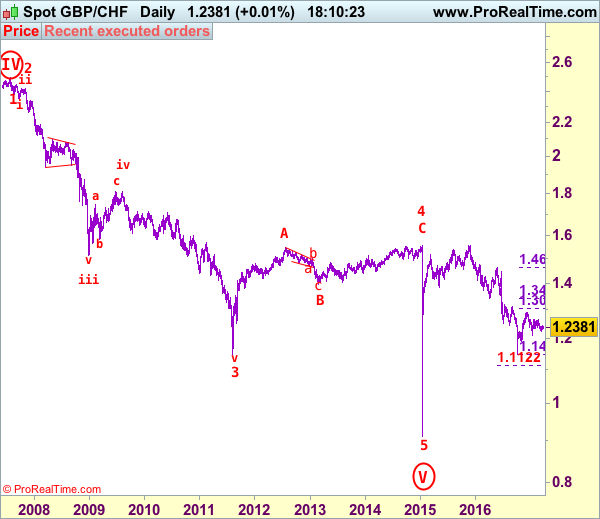
GBP/CHF – Circle wave v ended at 0.9106 and major correction has commenced for subsequent gain to 1.5547.
Although sterling recovered after finding support at 1.2215 earlier this month and consolidation above this level would be seen, reckon upside would be limited to 1.2445-50 and bring another decline, below 1.2295-00 would suggest the rebound from 1.2215 has ended and bring retest of this level later. A break of 1.2215 would signal the erratic fall from 1.2915 has resumed and extend weakness to previous support at 1.2102 which is likely to hold on first testing. Looking ahead, only a break below this level would extend the fall from 1.2915 to 1.2000-10 and later towards previous support at 1.1962 but reckon key support at 1.1899 would contain downside.
To recap the larger degree count, the selloff from 2.4965 (July 2007) is the beginning of wave V with circle and is labeled as 1: 2.3760, 2: 2.4425, wave 3 extension ended at 1.1470, followed by wave 4 at 1.5547, the quick rebound from 0.9106 suggests wave 5 as well as entire circle wave V could have ended there, hence consolidation with mild upside bias is seen for major correction to take place, bring initial test of 1.5547 (previous 4th of a lesser degree).
On the upside, whilst marginal gain from here cannot be ruled out, reckon upside would be limited to 1.2450-60 and bring another decline later. Above 1.2500-05 would abort and signal low is formed instead, risk a stronger rebound to 1.2570-75 but break of said resistance at 1.2660 is needed to shift risk back to the upside for the rebound from 1.2102 to extend further gain to 1.2745-55, above there would signal the retreat from 1.2915 has ended at 1.2102 and encourage for subsequent gain to 1.2800-10 first.
Recommendation: Hold short entered at 1.2410 for 1.2210 with stop above 1.2510.
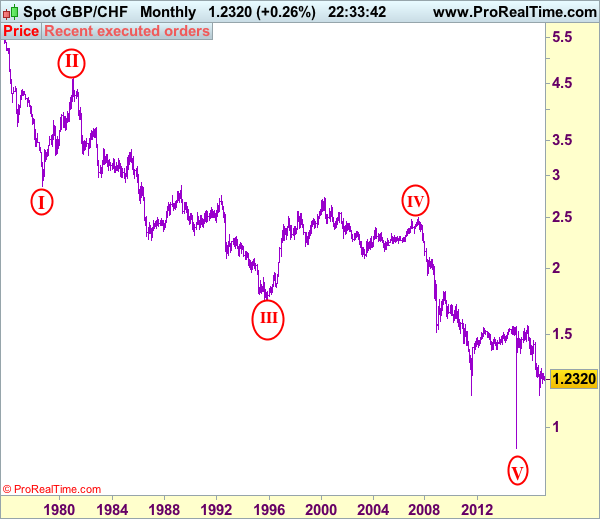
On the Monthly chart, the longer-term count is that major downtrend is under way with circle wave I at 2.8645 (Sep 1.978), then wave II with circle at 4.6175 (Feb 1981), the wave III with circle ended at 1.7425 (Nov 1995) and followed by wave IV with circle at 2.4965 (July 2007 with a short wave C) and wave V with circle has possibly ended at 0.9106. A monthly close above 1.5547 would add credence to this view, bring major correction to 1.7000, then towards psychological level at 2.0000.
Gold Very Short-Term Bearish Consolidation, Silver Pushing Above 18.00, Crude Oil Heading Downwards.
Gold Very short-term bearish consolidation.
Gold continues to head lower. The momentum seems back to bullish. Strong resistance is located at 1263 (27/02/2017 high). Hourly support can be found at 1224.10 (16/03/2017 low). Expected to show further strengthening.
In the long-term, the technical structure suggests that there is a growing upside momentum. A break of 1392 (17/03/2014) is necessary ton confirm it, A major support can be found at 1045 (05/02/2010 low).
Silver Pushing above 18.00.
Silver has increased above 18.00. Resistance given at 17.56 has been broken. Hourly support is given at 16.82 (15/03/2017 low).
In the long-term, the death cross indicates that further downsides are very likely. Resistance is located at 25.11 (28/08/2013 high). Strong support can be found at 11.75 (20/04/2009).
Crude oil Heading downwards.
Crude oil's bearish pressures continues despite correct bounce due to a short-squeeze. The commodity had been unable to mount a serious challenge to resistance at 49.61 (08/12/2017 low) hourly support given at 47.09 (016/03/2017 low) Expected to see deeper selling pressures.
In the long-term, crude oil has recovered after its sharp decline last year. However, we consider that further weakness are very likely. Strong support lies at 24.82 (13/11/2002) while resistance can now be found at 55.24 (03/01/2017 high).