
Sample Category Title
German Businesses Show Strongest Confidence In Six Years
'The political uncertainties don't affect the German economy.' - Klaus Wohlrabe, Ifo
In March, the German Business Climate Index rose more than many experts estimated. It surged to 112.3, appearing to be the highest since June 2011. Such notable change suggests that German businesses have finally adapted to the new US Administration and are not disturbed by the US President Donald Trump's plan to levy a 35% border tax on German car manufacturers or his $375 billion bill for NATO handed to the German Chancellor Angela Merkel. The positive rise of business confidence also shows that companies calmly perceive the upcoming elections in France and Germany and the already conducted elections in Netherlands. Altogether, this allows to assume that the German economy is relatively indifferent to the current political turbulences across the world. Nevertheless, the reason for such unexpected surge was also based on economic grounds. In particular, improvements in the manufacturing, construction and retailing sectors that were fuelled by higher demand for cars and machinery. Moreover, with respect to the construction industry, sentiment in the following sector reached the highest level in 26 years amid positive demographics, spiking wages and lower borrowing costs, which altogether created a housing boom.
Sterling Still Appreciating ahead of Brexit Announcement
This is not the weather forecast, but it was chilly up north when Theresa May met Nicola Sturgeon and made it clear that another Scottish independence vote before Brexit will not be fandabidozi. This meeting had no impact on the Pound, which strengthened against most other currencies yesterday. The impending triggering of Article 50 appears to be viewed with more enthusiasm by the markets than we might have expected. The lack of UK data today should leave the Pound meandering in its current tight ranges, but there are a number of central bankers speaking throughout the day, so who knows what might come out.
Germany's IFO survey delivered a pleasant surprise. At 112.3, the Business Climate Index was higher than forecast and paints a picture of a country in recovery mode. The supervisory board of the European Central Bank (ECB) says Eurozone banks have improved their stability, but there is more to do. That's the banking equivalent of a teacher writing 'must try harder' on a report card. Meanwhile, German members of the ECB are pressing the central bank to start raising interest rates and lower their bond holdings. So everyone is telling everyone else what to do whilst the Eurozone economy is still struggling to grow. The posturing ahead of UK-EU negotiations continues. German Finance Minister, Wolfgang Schauble, said "We have no interest in punishing the UK, but we also have no interest in putting European integration in danger over the UK." That is being touted as an anti-UK comment, but I disagree. Surely that is just eminently sensible, given Shauble's position.
Today's data diary is as empty as an election promise. Minor data releases from the US later in the day will not be market movers, but traders may well start positioning themselves ahead of tomorrow's expected Article 50 announcement from the UK Prime Minister.
And a chap in Nova Scotia has been told he cannot have a personalised licence plate on his car even though it only bears his name. Lorne Grabher had a plate with just his surname on it but authorities have said it makes a socially irresponsible statement. Deed & Poll are the words that spring to mind.
One liners
- It doesn't matter whether you win or lose...until you lose.
- One good turn gets most of the duvet.
- People who say "I slept like a baby" usually never had one.
- Remember the journey of a thousand miles begins with your Dad saying... "I know a shortcut"
- A torch is just a tube for keeping dead batteries in
- Duct tape is like the force, it has a light side and a dark side and it holds the universe together.
Euro Retreats On Tuesday
'The euro will be the final step because I want to wait for the result of the German election.' – Marine Le Pen (based on Bloomberg)
Pair's Outlook
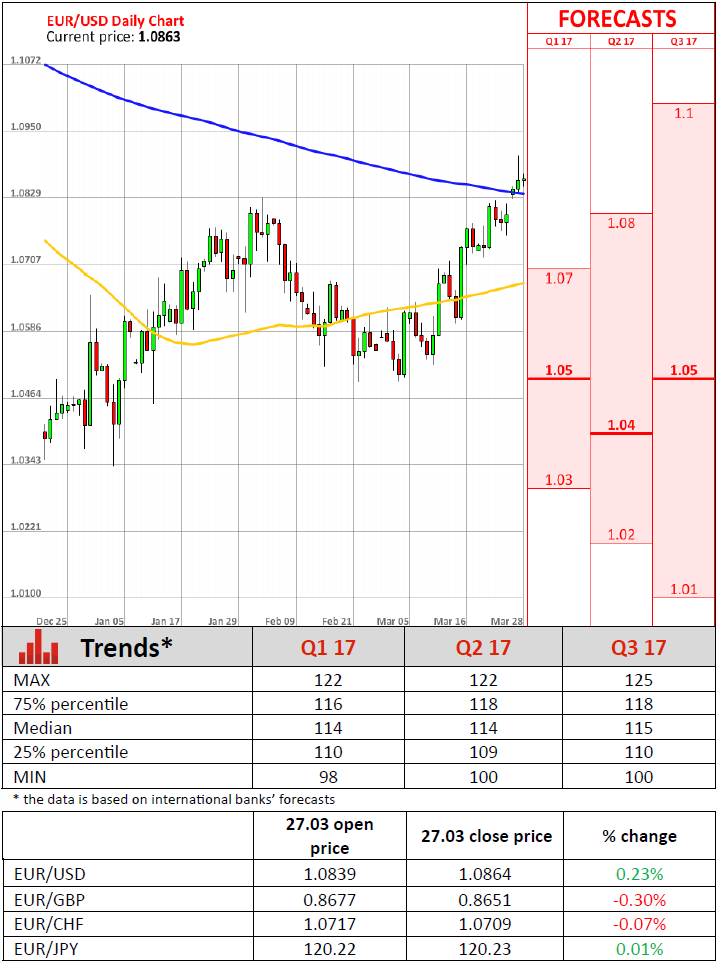
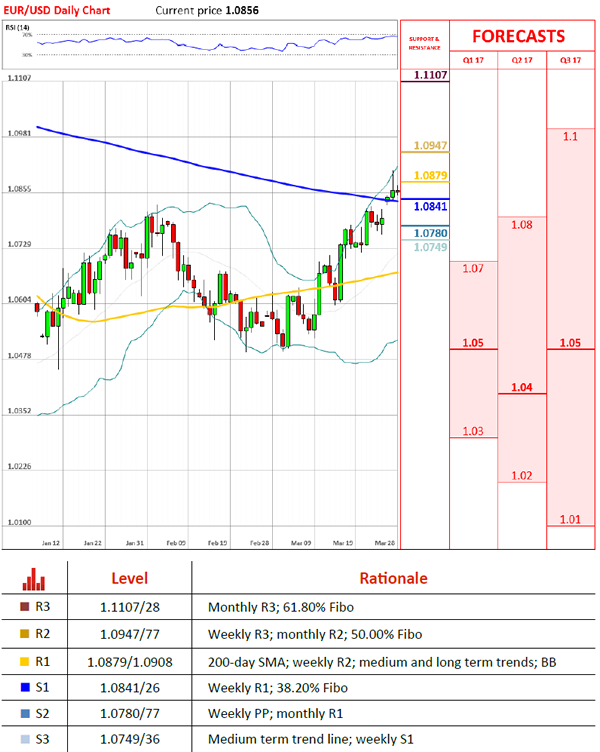
On Tuesday morning the common European currency was in a retreat against the Greenback, as the currency exchange rate fluctuated near the 1.0850 mark. Previously, during Monday's trading the rate surged and touched the 1.0905 level, and with it a long term ascending channel's upper trend line was confirmed, as the pair bounce off of it. It is most likely that the currency pair will get squeezed in during today's trading session, as the 200-day SMA is moving in from the upside while the weekly R1 and the 38.20% Fibonacci retracement level are providing support, respectively, at 1.0841 and 1.0826 levels.
Traders' Sentiment
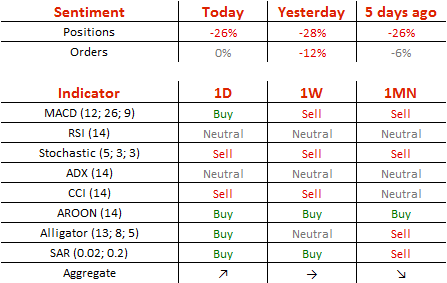
SWFX traders remain bearish, as 63% of open positions are short. Meanwhile, trader set up orders are neutral.
GBP/USD Takes Another Shot At Reclaiming 1.26
'According to our long-term fair value model G10 VALFex, the USD already looks quite overvalued vs SEK, EUR, JPY and GBP and that should limit any future gains.' – Credit Agricole (based on PoundSterlingLive)
Pair's Outlook
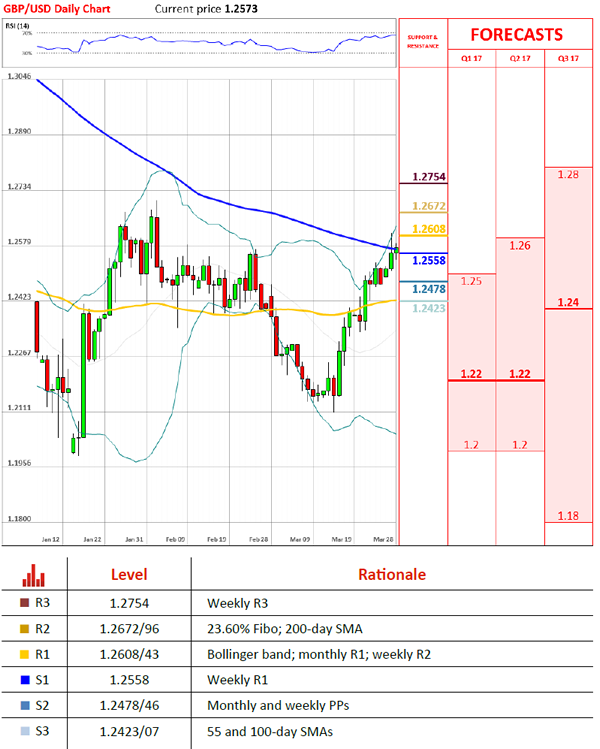
The Cable mostly behaved in accordance with expectations on Monday, with the only exception being that the pair was able to reach beyond the 1.26 major level. Nevertheless, trade closed with British currency appreciating 64 pips against the Buck, thus, reaching its four-week high. The bullish trend remains intact, with the Pound expected to outperform the US Dollar once more. Technical indicators are also giving bullish signals, confirming the possibility of the positive outcome today. However, due to lack of strong market movers, the upside development is likely to be very limited, with the immediate resistance cluster around 1.2630 preventing the Sterling from edging higher.
Traders' Sentiment
Today 63% of traders are bulls (previously 60%), while 53% of all pending orders are to sell the British currency (down from 55%).
USD/JPY Attempts To Make Another U-Turn
'The Trump reflation trade could still reverse course in a more meaningful way, resulting in dollar weakness.' – MUFG (based on Business Recorder)
Pair's Outlook
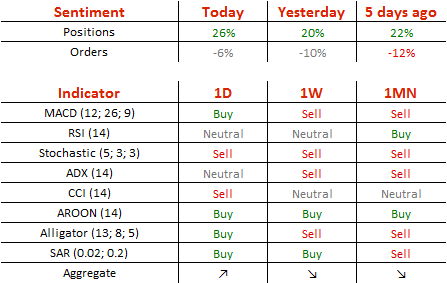
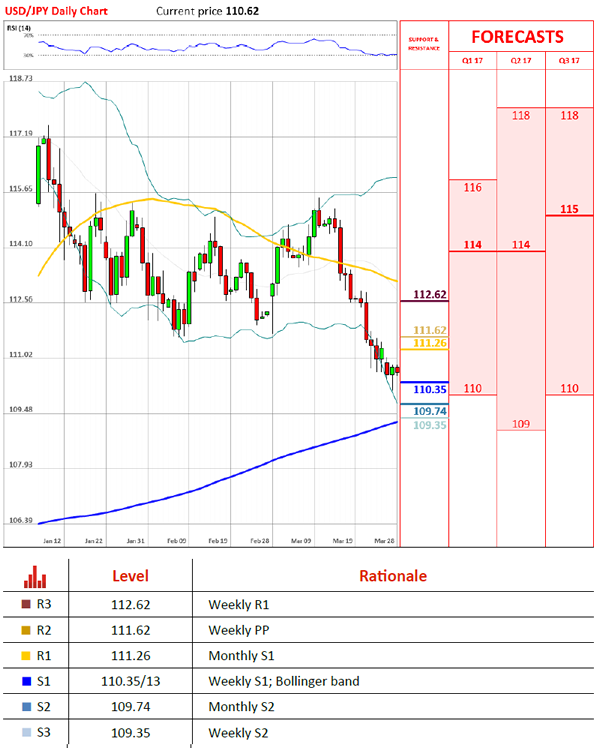
Fortunately for the US Dollar, it managed to avoid substantial losses against the Japanese Yen yesterday. Nonetheless, a new four-month low was reached, but with the USD/JPY pair once again remaining above the 110.60 level, which appears to be providing strong psychological support. As a result, the Greenback has the opportunity to post gains today, as another leg down would cause a breach of this support. Moreover, the weekly S1 and the Bollinger band are somewhat bolstering the psychological demand area, even though technical studies are unable to confirm the possibility of a recovery.
Traders' Sentiment
Market sentiment remains bullish, as 71% of all open positions are long, compared to 72% yesterday. At the same time, the portion of orders to acquire the Buck inched up from 65 to 66%.
Gold Trades Lower After Touching 1,260 Mark
'We're likely to see gold prices relatively steady for now until there is a little bit more clarity on Trump's other policies, particularly over the tax bill.' – Daniel Hynes, ANZ (based on Reuters)
Pair's Outlook
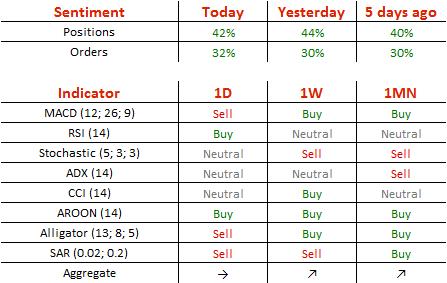
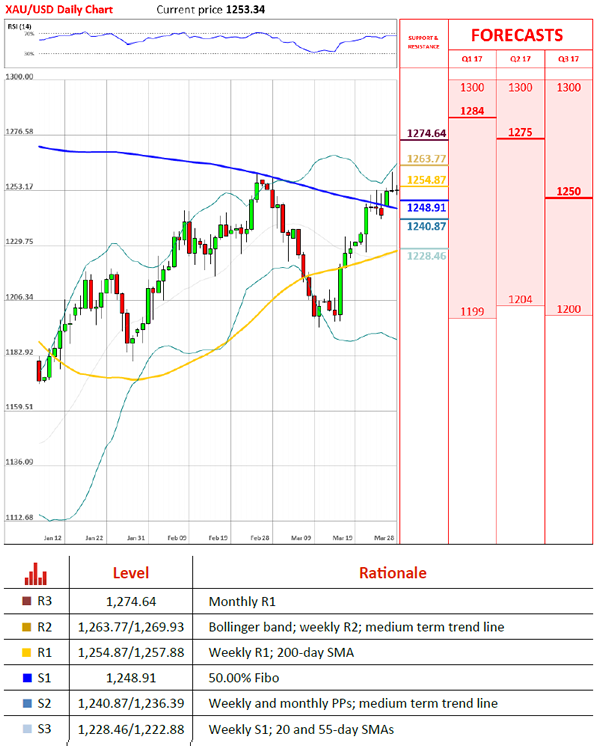
During the early hours of Tuesday's trading session the yellow metal's price declined, as it traded just above the 1,250 mark. Previously, during Monday's trading session the bullion managed to surge and even reach above the 1,260 mark. During that move, the price passed the 200-day SMA, and it was expected that the metal will continue the surge. However, it seems that as the US political fundamental events calmed down, the buck regained its strength. Although, the hypothesis of a surge remains in force, as the medium term ascending channel remains unbroken.
Traders' Sentiment
Traders are neutral bearish, as 51% of open positions are short on Tuesday. However, 67% of set up orders are to buy the metal.
USDJPY – Consolidation Above 110.00 To Precede Fresh Bears, Weekly Cloud Top Caps
The pair shows hesitation at psychological 110.00 support, reinforced by daily Kijun-sen line (yesterday's low was at 110.09), as subsequent bounce left long-tailed daily candle.
Monday's close below weekly cloud top (111.36) is maintaining negative tone, as recovery attempts so far did not show stronger upside action.
However, reversal of slow stochastic on daily chart suggests extended consolidation, which should be capped under weekly cloud top, before bears resume.
Final break below 110.00 handle would expose supports at 109.50/00 and could extend towards 200SMA (108.25) on stronger bearish acceleration.
Daily MA's in firm bearish setup support the notion.
Alternative scenario requires close above weekly cloud top to signal extended correction, with upper breakpoint at 112.15 (Fibo 38.2% of 115.49/110.09).
Res: 110.81, 111.00, 111.36, 111.60
Sup: 110.50, 110.00, 109.50, 109.00
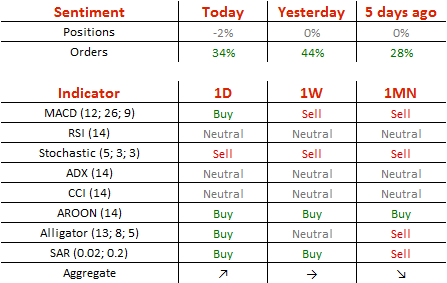
USD/CHF Candlesticks and Ichimoku Analysis
Weekly
• Last Candlesticks pattern: Doji
• Time of formation: 26 Sep 2016
• Trend bias: Sideways
Daily
• Last Candlesticks pattern: Shooting star
• Time of formation: 25 Oct 2016
• Trend bias: Near term up
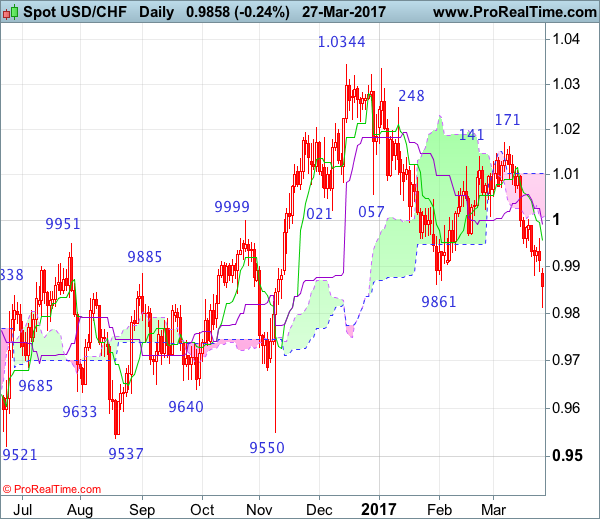
USD/CHF – 0.9861
The greenback only recovered to 1.0003 early last week (we recommended to sell dollar at 1.0010 and missed our short entry) before renewed selling interest emerging and price dropped again from there to as low as 0.9813 yesterday, the breach of previous support at 0.9861 adds credence to our view that recent erratic decline from 1.0344 top has resumed and downside bias remains for this fall to extend weakness to 0.9735-40 (76.4% retracement of 0.9550-1.0344) and later towards 0.9700 but near term oversold condition should limit downside to 0.9650-60, bring rebound later.
On the upside, whilst initial recovery to 0.9900-10 cannot be ruled out, price should falter below resistance at 0.9960 and bring another decline later. Only break of said resistance at 1.0003 would abort and suggest low is formed instead, risk a stronger rebound to 1.0060 (previous support turned resistance) but still reckon upside would be limited to 1.0109 and price should falter well below resistance at 1.0171, bring another selloff.
Recommendation: Sell at 0.9910 for 0.9710 with stop above 1.0010.
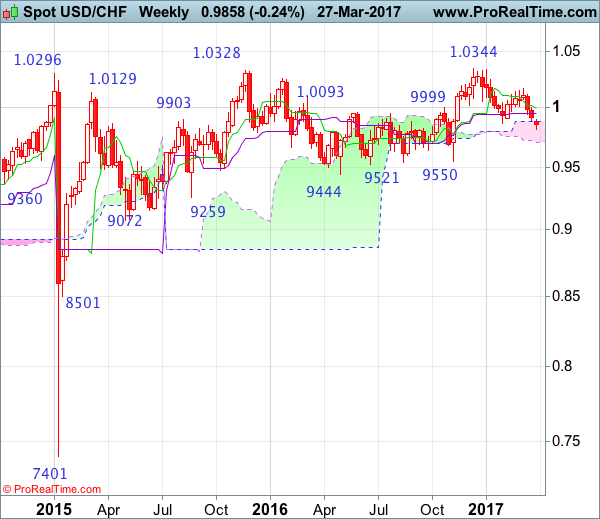
On the weekly chart, the greenback met renewed selling interest at 1.0003 early last week and dropped again, another black candlestick was formed, price finally broke below previous support at 0.9861, adding credence to our view that the fall from 1.0344 top has resumed and bearishness remains for this move to bring retracement of early upmove to 0.9735-40, then towards the lower Kumo (now at 0.9706) but reckon downside would be limited to 0.9640-50 and price should stay well above support at 0.9550.
On the upside, expect recovery to the Kijun-Sen (now at 0.9947) and resistance at 0.9960 should hold, bring another decline. Above the Tenkan-Sen (now at 0.9992) would risk test of said resistance at 1.0003 but a weekly close above there is needed to signal low is formed instead, bring a stronger rebound to 1.0060, having said that, only break of said resistance at 1.0171 would shift risk back to upside and suggest the fall from 1.0344 has ended, bring further gain to key resistance at 1.0248. A sustained breach above this level would signal the retreat from 1.0344 has ended, bring further gain to 1.0335-44 resistance area but break there is needed to signal early upmove has resumed for headway to 1.0400-10 and later 1.0500.
USD Decline Slows, But Short-Term Picture Remains Fragile
Sunrise Market Commentary
- Rates: Risk sentiment improves, but key support US 10-yr yield remains nearby
The improvement of risk sentiment in the US suggests that the first hesitation in the reflation trade was overdone. That could remove some of the upward pressure on bonds, though we wouldn't call off the risks. A test of 2.3% support (US 10yr yield) in the coming days remains likely. We don't think that eco data and central bank talk will impact dealings today. - Currencies: USD decline slows, but short-term picture remains fragile.
Yesterday, the correction on the reflation trade slowed and so did the decline of the dollar. However, the USD picture remains fragile as it still trades within reach of the recent lows. Today, the US eco data probably won't be strong enough to put a solid floor for dollar. The ECB debate on reducing policy stimulation is an implicit supportive factor for the euro
The Sunrise Headlines
- US equities markets recovered on Monday from an early-day slide to end mixed between -0.2% and +0.2%. Overnight, Asian markets eked out gains on the back of the improved risk sentiment on WS with China underperforming.
- Germany's two representatives on the ECB's main policy-making body called for it to prepare to wind down its aggressive stimulus policy as soon as economic conditions allow it. The ECB could discuss and decide on its next step after June.
- President Trump's son-in-law, Kushner, has been asked to discuss his contact with the head of a state-run Russian bank that is on a US sanctions list with a Senate committee probing Russia's alleged interference in the elections.
- Chicago Fed Evans said there may only be one more rate increase this year, though he could support two if the data warranted. Dallas Fed Kaplan said that he would support further interest rate hikes if the US economy takes more steps toward reaching the Fed's goals of full employment and 2% inflation.
- German Chancellor Merkel has adopted a tough position on issues such as the UK's exit bill and the sequencing of negotiations, partly in response to increasing expectations that Britain is seeking a hard Brexit.
- The worst cyclone in six years smashed into the coast of Queensland, forcing thousands of Australians to evacuate or seek emergency shelter and prompting some of the world's biggest miners to halt coal operations.
- Today's eco calendar contains US trade balance, S&P CS housing data, consumer confidence and Richmond Fed manufacturing index. Several ECB & Fed governors speak and the US & Germany supply markets
Currencies: USD Decline Slows, But Short-Term Picture Remains Fragile
USD holds near recent lows, but decline slows
The correction on the reflation trade initially continued yesterday as investors were uncertain about the impact of the failure to pass a new US healthcare bill. Equities and the dollar were sold. Later in the US session, the risk-off trade eased and so did the decline of US/core bond yields and of the dollar. Still the US currency remained relatively close to the recent lows against other majors. EUR/USD finished the session at 1.0864 (from 1.0798 on Friday). USD/JPY closed the session at 110.66.
Overnight, Asian equities join yesterday's intraday rebound in the US. However, the gains outside Japan and Australia are modest. This is also the case for the comeback of the dollar. USD/JPY rebounded temporary to the 110.80 area, but returned soon to the mid 110 area. EUR/USD hovers in the 1.0865 area. So, yesterday's top just north of 1.09 is still within reach. On the EU side of the story, the euro is probably supported by comments of German ECB members Weidmann and Lautenschlaeger. They kept the debate alive that the ECB should consider scaling back policy stimulation in a not-that-distant future.
Today, there are no EMU eco data. In the US, the advance trade balance, consumer confidence (conference board) and the Richmond Fed manufacturing index will be published. Consumer confidence has probably most market moving potential. The consensus expects a small setback from 114.8 to 114. Recent indicators of consumer confidence were strong, but a slight setback given the very high level is possible. From a market/USD point of view, the question is whether the US data will be strong enough to reverse recent market doubts on the US reflation trade and on the dollar. A good figure might help, but more USD positive news is needed to restore confidence in the dollar. There is also again a long list of Fed and ECB speakers. ECB comments might be at least as important as Fed speakers. Yesterday, the intra-ECB division became again apparent with the German ECB members advocating scaling back policy stimulation. At the same time ECB Chief economist Peter Praet defended the current soft ECB approach
EUR/USD: extensive test of 1.0829/74 resistance both on USD weakness and euro strength
However, it is too early to conclude that the correction has already run its course. A similar reasoning applies for EUR/USD. Sentiment on the dollar was fragile. At the same time, the internal ECB debate on whether or not scaling back policy stimulation continues. This puts a floor for the euro, at least short-term. A new downleg in EUR/USD probably has to come from better news from the US, halting the decline in the US/Euro (German) interest rate differential. We are not at this point yet. So, EUR/USD might hold near the recent highs and even (slight) further upticks are still possible even as we don't expect a sharp break higher.
From a technical point of view, the picture of USD/JPY remains fragile as it clearly dropped below the 111.60/36 support. Next support kicks in at 108.84 (50% retracement of the MT up-move). EUR/USD is extensively testing the 1.0829/1.0874resistance. A break beyond this level would deteriorate the MT picture for the dollar. Chances on a break of this level are growing. However, we don't expect a real protracted rally of the euro against the dollar already now. The absolute interest rate differential between the US and Germany/Europe makes EUR/USD longs costly. At the same time, we also don't see the euro as the perfect safe haven.
EUR/USD: extensive test of 1.0829/74 resistance both on USD weakness and euro strength
EUR/GBP
Sterling rebound slows ahead of article 50 triggering
On Monday, there were no important UK data. The BoE published a framework for the 2017 banking stress test that included a test against a big economic setback and a sharp depreciation of sterling. This scenario isn't formally linked to the risks of Brexit, but the case is straight forward. The upcoming new phase in the Brexit saga (triggering article 50 on Wednesday) didn't negatively impact sterling for now. USD weakness was the most important driver for sterling trading. Cable ‘enjoyed' quite a powerful short squeeze. The pair traded temporary above 1.26, but closed the session at 1.2559. EUR/GBP initially declined, but finally closed the session in the mid 0.86 area.
Today, there are again no important eco data in the UK. So, global factors and investors looking forward to the formal triggering of Article 50 (tomorrow) will set the tone for sterling trading. With no high profile news on the agenda, some further consolidation on the recent sterling rebound might be on the cards. Two weeks ago, sterling found a better bid after the early March decline. Some time ago, EUR/GBP cleared 0.8592 resistance, improving the MT technical picture. However, (substantially) higher than expected UK inflation probably put a decent floor for sterling short-term. We changed our short-term bias on EUR/GBP from positive to neutral. Further consolidation in the 0.85/0.88 area might be on the cards. Longer term, Brexit-complications remain a potential negative for sterling, but this issue isn't in the spotlights right now. We are not convinced that the BoE will raise rates anytime soon, even not after this months' higher inflation data
EUR/GBP: sterling rebound to show tentative signs of slowing?
Brexit Flight: A Hard Or Soft Landing?
UK Prime Minister Theresa May will trigger Article 50 of the Lisbon treaty on Wednesday March 29, starting the 2-year Brexit negotiation process with the EU. The EU leaders will hold a summit on April 29 to adopt Brexit guidelines.
There are three possible situations for the negotiation process: soft Brexit, hard Brexit, or failing to achieve any agreements. In the third situation, trade between the UK and the EU must be carried out per the World Trade Organisation (WTO) clauses.
The EU is unlikely to make it easy for the UK to leave, in order to prevent other EU member states from leaving the EU following Brexit. Downward pressure is still on GBP and GBP crosses until the outline of the final Brexit deal draft is clear. Thousands of protesters in the UK marched, on March 25, against Brexit.
The UK government have a list of issues that need to be negotiated with the EU such as; a new post-Brexit trade agreement, tariff, transportation, financial services, fishing waters, and reducing the number of EU immigrants entering the UK etc.
The EU is the UK's biggest trade partner with the two economies being highly interdependent over the past decades. The EU and the UK must manage to minimize the Brexit impact and reach balance between their own interests.
Theresa May aims to get the best Brexit deal with access to the single market and a new trade agreement with minimised trade barriers. The EU economy is highly tied up with UK financial services it is therefore also crucial for the EU to maintain its access to London's financial sector.
After the UK leaves the EU, the UK will be able to retrieve the control of its borders, jurisdiction, and diplomacy. The UK will be free to sign trade agreements and develop a tighter relationship with other economies such as the US and China. In addition, the UK will get rid of the financial burden of the EU annual membership fee.
The Scottish parliament will vote on whether to hold a second Scottish independence referendum today, which is only one day ahead the triggering of the Brexit process. If the result is to hold a referendum, the proposal will be delivered to the UK parliament for voting. In this situation, it will pose more political uncertainties on the UK's economic prospects and the value of GBP.
GBP/USD hit a 7-week high of 1.2615 on Monday, mainly because of the slump of USD, be aware that the GBP crosses will likely to be volatile with the proceeding of Brexit.