
Sample Category Title
EURGBP Likely To Retrace To Top Of Current Range
Key Points:
- Price action trading within a constricting wedge.
- RSI oscillator trending higher.
- EURGBP likely to retrace to top of current range.
The Euro-Pound pair has been trappedby a tightening wedge over the past few weeks as it has largely traded between 0.8395 and 0.8800. However, the past few days has seen the pair steadily breaking above the current cloud formation which suggests that we are about to see a breakout in the coming days.
A cursory review of the technical indicators also seems to support the view that there is likely to be a bullish move coming in the short term. In particular, the stochastic oscillator (daily time frame) has recently returned to trending higher, after a consolidative pullback, and still remains within neutral territory which means that there is plenty of room to move on the upside. In addition, price action has now moved above the 20, 60, and 100 day EMA’s as price has converged towards the top of the wedge pattern. Subsequently, there is plenty of scope for a retracement given the building pressure within the various indicators, as well as from the increasing wedge.
From a fundamental perspective, there are also some key economic events which are coming in the remainder of the week with the UK finally about to trigger the Article 50 provisions. This is likely to bring about a change to the pair’s equilibrium price following a bout of sharp volatility. Regardless, the current constricting wedge pattern, and requisite price level, is unlikely to hold given the current economic uncertainty around the Brexit. However, it’s not all bad news for the Pound given that some economic analysts are now predicting that an exit from the Eurozone is likely to bring about some gains for the UK economy as EU regulation falls away.
Ultimately, given the technical and fundamental indicators, with a particular focus of the risk of a Brexit, the Euro is probable to rally against the Pound within the current range structure. However, before considering any long entry, look for a strong bullish candle to pierce some key support at the top of the wedge around the 0.8785 mark.In addition, consider your Euro exposure on Friday (09:00 GMT) given that the EU Flash CPI Estimate figures are due out. Given the focus on interest rates lately, this is likely to be a key fundamental driver of the near term trend
GBP/USD Daily Outlook
Daily Pivots: (S1) 1.2395; (P) 1.2496; (R1) 1.2551; More...
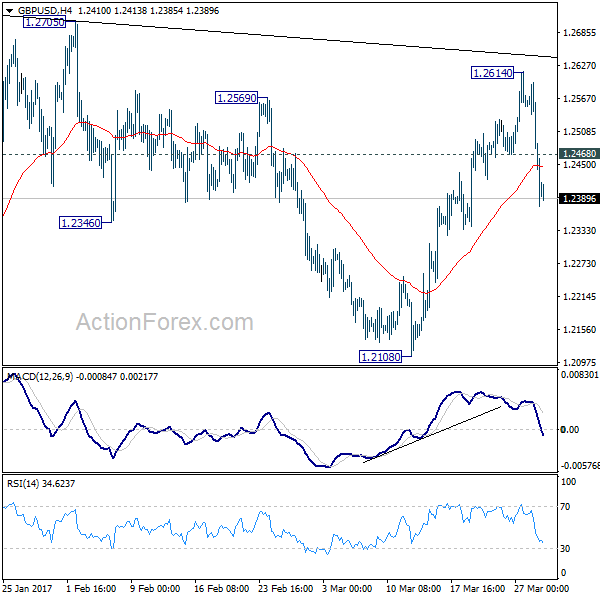
GBP/USD's sharp decline and strong break of 1.2468 minor support suggests that rebound from 1.2108 is completed at 1.2614 already. Intraday bias is turned back to the downside for 1.2108 support next. Overall, price actions from 1.1946 are viewed as a consolidation pattern pattern. Break of 1.2108 support will be the first sign of larger down trend resumption and would target 1.1946 low for confirmation. On the upside, above 1.2614 will bring another rise. In that case, we'd expect upside to be limited by 1.2705/2774 to bring down trend resumption eventually.
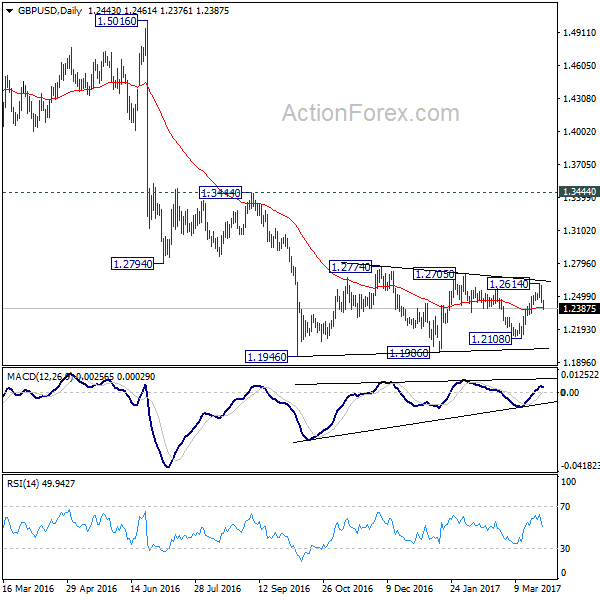
In the bigger picture, fall from 1.7190 is seen as part of the down trend from 2.1161. There is no sign of medium term reversal yet. Sustained trading below 61.8% projection of 2.1161 to 1.3503 from 1.7190 at 1.2457 will target 100% projection at 0.9532. Overall, break of 1.3444 resistance is needed to confirm medium term bottoming. Otherwise, outlook will remain bearish.
Stocks Technical Rebound Took Dollar Higher, Sterling Sold off on Brexit Day
DJIA rebounded strongly overnight by closing up 150.52 pts or 0.73% at 20701.50. S&P also rebounded by gaining 16.98 pts or 0.73% to close at 2358.57. Some attributed the rebound to strong economic data. Conference Board consumer confidence jumped to 125.6 in March, hitting the highest level since December 2000. But from our point of view, the rebound in stocks were mainly technical driven. Strong support was seen in both DJIA and S&P 500 from 55 day EMA. Meanwhile, the rebound in stocks was also accompanied by yields and Dollar index. The development suggests that reversal Trump trade has at least passed the first climax even though there is no sign of it being completed yet. The focus is turned to Sterling selling as Brexit day finally arrives.
Fed Fischer: Two more hikes seems about right
Fed Vice Chair Stanley Fischer sounded hawkish in his interview by CNBC. He said that two more rate hikes "seems about right" for this year. He noted that it is "the sensible thing to do" to watch and wait White House's fiscal policies which jumping the gun on the results. US President Donald Trump's failure on health care act changed Fischer's "internal calculus" but the the overall economic outlook. Separately, Fed Governor Jerome Powell said Fed is "getting closer" to achieving maximum employment. Inflation is "still a bit short, but not terribly short" of target. He reiterated that "it's appropriate if we stay on this path for us to gradually raise interest rates."
BoC Poloz: Costs of protectionism are steep
In Canada, BoC Governor Stephen Poloz emphasized that the "correlation between economic progress and openness" is "striking". And, "when trade barriers are falling, when people are coming to our shores and when investment is rising, Canadians prosper." In response to the current protectionist approach of US Trump, Poloz warned that "protectionism does not promote growth and its costs are steep." Regarding immigration, Poloz said that Canada would have to rely entirely on immigration in less than 30 years to maintain population growth. And, "take away the force of international migration since Confederation, and Canada would be around 10 million people, not 36 million as we are today."
Sterling weakness could be temporary
Sterling is sold off deeper as the Brexit Day finally comes. UK Prime Minister is schedule to trigger Article 50 today, nine months after the historical Brexit referendum last year. And, UK will officially end the 44 year old membership with EU. As the negotiation starts, there are three main focuses, immigration, trade relationship and the cost of the "divorce". It's generally expected that EU leaders will take a tough stance considering the rise in euroskeptism, nationalism and populism in Europe in general. However, at the moment, there is no fresh news regarding Brexit and all should already be priced in the markets. Hence, while the pound stays bearish against Dollar, there is no fresh evidence of bearishness against the others yet.
Take GBP/AUD as an example, it's the worst performing pair for the week so far. The pull back from 1.6568 is deep and steep. But at this point, there no change in the overall outlook. The choppy fall from 1.7204 is seen as a corrective move and could be finished at 1.5905 already. Another rise is in favor to extend the pattern from 1.5665 low. And above 1.6568 will target 1.7204 and possibly further to 38.2% retracement of 2.0534 to 1.5665 at 1.7525. This will remain the preferred case as long as 1.5905 support holds.
Elsewhere...
Japan retail sales rose 0.1% yoy in February, below expectation of 0.7% yoy. German import price rose 0.7% mom in February versus expectation of 0.4% mom. Swiss UBS consumption indicator rose to 1.5 in February. UK will release mortgage approvals and M4 money supply. US will release pending home sales later today.
GBP/USD Daily Outlook
Daily Pivots: (S1) 1.2395; (P) 1.2496; (R1) 1.2551; More...
GBP/USD's sharp decline and strong break of 1.2468 minor support suggests that rebound from 1.2108 is completed at 1.2614 already. Intraday bias is turned back to the downside for 1.2108 support next. Overall, price actions from 1.1946 are viewed as a consolidation pattern pattern. Break of 1.2108 support will be the first sign of larger down trend resumption and would target 1.1946 low for confirmation. On the upside, above 1.2614 will bring another rise. In that case, we'd expect upside to be limited by 1.2705/2774 to bring down trend resumption eventually.
In the bigger picture, fall from 1.7190 is seen as part of the down trend from 2.1161. There is no sign of medium term reversal yet. Sustained trading below 61.8% projection of 2.1161 to 1.3503 from 1.7190 at 1.2457 will target 100% projection at 0.9532. Overall, break of 1.3444 resistance is needed to confirm medium term bottoming. Otherwise, outlook will remain bearish.
Economic Indicators Update
| GMT | Ccy | Events | Actual | Forecast | Previous | Revised |
|---|---|---|---|---|---|---|
| 23:50 | JPY | Retail Trade Y/Y Feb | 0.10% | 0.70% | 1.00% | |
| 6:00 | EUR | German Import Price Index M/M Feb | 0.40% | 0.90% | ||
| 6:00 | CHF | UBS Consumption Indicator Feb | 1.43 | |||
| 8:30 | GBP | Mortgage Approvals Feb | 69.5k | 69.9k | ||
| 8:30 | GBP | M4 Money Supply M/M Feb | 0.50% | 0.90% | ||
| 14:00 | USD | Pending Home Sales M/M Feb | 2.00% | -2.80% | ||
| 14:30 | USD | Crude Oil Inventories | 5.0M |
Brexit Fears And Technical Weakness Could Spell Losses For The EUR
Key Points:
- The descending trend line should see the long-term downtrend resume.
- Corrective ABC looks to have been completed.
- Brexit fears should begin to weigh on the EUR.
The Euro's recent upswing seems to be coming to an end which could go some way in explaining yesterday's rather torrid reaction to the broader market trend. Indeed, fundamentals aside, the EUR's technical bias alone seems to indicate that downside risks are opening up as we move ahead which could mean the long-term downtrend is ready to get back underway.
First and foremost, we can't ignore the presence of that long-term trend line that has proven a difficult adversary for the bulls many times over the past months. As a result of this descending line, it maybe won't come as a total surprise that selling pressure spiked significantly yesterday. Additionally, the rather overbought stochastic reading provided even explanation for why bearishness prevailed in the prior session.
However, that was yesterday and the question is now whether this was simply a near-term slip or the beginning of a medium to long-term change in momentum for the EUR? Well, firstly, we can look to the corrective ABC wave which now seems to have run its course to give us a clue as to what is next on the agenda. Given the pattern is now looking complete, the pair's overall bearish trend should resume until another correction is needed.
Secondly, we can examine the Parabolic SAR reading which is on the cusp of inverting from its current bullish bias to bearish instead. Typically, this would mean we are due for at least a modest period of losses even if the EMA bias is rather bullish. Speaking of which, don't entirely ignore these moving averages as the 100 day EMA should prove to be a solid near-term support which may mean we have a local bottom around the 50.0% Fibonacci level at the 1.0695 mark.
From a fundamental perspective, uncertainty is on the rise within the Eurozone which will lend a hand to the bears and drag the pair lower moving ahead. It goes without saying, these uncertainties will largely be stemming from Brexit risks which are now at the forefront of the public conciseness. Further, the revelation that Theresa May has now written and signed the article 50 letter to be deliver to the EU will see this negative sentiment surge which will go a long way in supporting the current technical forecast.
Ultimately, given both the technicals and fundamental discussed above, it seems fairly safe to assume downside risk will be increasing for the EUR. Moreover, even concerns over the Trump administration may fall by the wayside in the wake of Brexit. As a result the resumption of the long-term down trend could be on its way this week and December's lows may be back in the crosshairs for the bears over the coming weeks and months
Asia Markets Do Not Appear To Be Have Been Hit By Brexit Fears Yet
Market movers today
The main event of the day is the Article 50 triggering by the UK and the EU's Brexit guidelines, which should be published within 48 hours of Article 50 being triggered.
In the US, there are a number of Fed governors set to speak publicly. These may provide further impetus to the future of US monetary policy stance amid renewed uncertainty about US fiscal policies.
The data calendar is otherwise rather thin.
Selected market news
The biggest focus for the markets today will be the UK government's triggering of Article 50 and the response by the EU. We lay out today's likely timetable in our Brexit monitor, due out later this morning. The UK is expected to send a Brexit letter to the EU following a cabinet meeting at 9:00 CET, followed by a response from Donald Tusk on the EU side once he receives the letter. This will mark the start of a negotiation period of up to two years, which may get off to a difficult start as there appear to be differences of views between the UK and EU about the focus of the discussions from the outset. One of the likely casualties of the ‘divorce' talks will in our view be the GBP, which is indeed trading weak this morning, but the wider UK economy has also recently showed signs of ‘Brexit stress', with consumers turning more pessimistic.
In Asia, the markets do not appear to be have been hit by Brexit fears yet as they are generally trading on a positive note this morning. One of the driving forces for the positive risk sentiment is probably the very strong US consumer sentiment number, which was released yesterday. The number showed that the US consumer is the most upbeat in more than sixteen years. The strong consumer survey goes well with our view that private consumption is still the main driver of US growth. The combination of positive risk sentiment and the strong US consumer survey number sent oil prices higher.
Following Fed governor Charles Evans' speech two days ago, Stanley Fischer said yesterday that two additional rate hikes this year ‘seem about right' given the outlook for the US economy. This is in line with our view, seeing additional rate hikes being undertaken in July and December. Financial markets are pricing in a rate hike with about a 53% probability for June already.
Euro Area Research: Euro Area Reflation Story Ending
The rise in inflation to the ECB's 2.0% target for the first time since 2013 implies that market expectations have turned in favour of expecting a more hawkish stance from the ECB (a 50% probability of a 10bp deposit rate hike from the ECB is priced in for the end of this year). However, the rise in inflation has so far been driven by volatile energy and unprocessed food price inflation, while the underlying price pressure reflected in core inflation remains subdued. Consistent with weak underlying price pressure, the market is pricing in lower inflation in coming months (down at 0.8% in January 2018), which in our view is in sharp contrast with the expectations of a policy rate hike this year.
In this research piece, we take a close look at what to expect from inflation, with special focus on core inflation as it reveals the underlying price pressure. Based on the communication from ECB members, the latter is highly important for the future monetary policy stance. We expect the ECB to decide on whether to start tapering its QE purchases at the meeting on 7 September. Hence, we consider the inflation figures released ahead of this meeting.
Our conclusion is that the rise in inflation is not a sustained adjustment towards the 2% target, as core inflation is set to print below 1.0% for the next six months, except for one month where it will be lifted by the timing of Easter. The most important reason why core inflation should stay modest is our expectation of subdued wage pressure due to slack in the labour market particularly in the periphery countries but also continued modest wage growth in Germany.
Based on this, we still expect the ECB to announce a third QE extension in September and most likely continue buying assets of EUR60bn per month, as its focus will remain on the underlying price pressure. However, the ECB might continue to remove some of its dovish communications from the introductory statement prior to this but, in our view, this does not mean it will start hiking policy rates or tapering QE towards zero.
Euro area inflation for the next six months
Inflation in March (released 31 March): we estimate headline inflation took a dip from 2.0% in February to 1.6% in March, driven partly by a drop in core inflation from 0.9% down to 0.7%. If this core inflation figure is correct, it will be the lowest since April 2016. However, our estimate of a decline is due mainly to the early timing of Easter in 2016, causing low inflation in the volatile package holiday prices in March this year. Added to the lower core inflation, the latest decline in the oil price together with less support from base effects in energy prices will also have driven headline inflation lower, although energy price inflation should still have a considerable positive contribution to inflation. Finally, food price inflation has surprised on the upside recently, due mainly to cold weather in the winter months. However, this is unlikely to have continued and we look for a lower contribution.
Inflation in April (released 28 April): headline inflation should go up to 1.8% but only for this month. Core inflation will also rise and for the first time in a year print at 1.0%, but the rise in core inflation is again related to the early timing of Easter last year. This implies the higher figure should not be too encouraging for the ECB as it does not reflect higher underlying price pressure but a temporary rise in prices on package holidays. (In April, package holidays should add 0.1pp more to core inflation than the historical average). We expect the contribution from energy price inflation to be the same as in March based on a fairly stable oil price development. On the other hand, food price inflation should continue lower still, correcting from the strong figures in the cold winter months.
Inflation in May (released 31 May): both headline and core inflation should go lower to 1.4% and 0.8%, respectively. The lower core inflation is reflecting a normalisation following the Easter effect and following this temporary volatility, service price inflation (around 60% of core inflation) should be back around its level in the beginning of this year. Non-energy industrial goods price inflation (the remaining roughly 40% of core inflation) should still be around 0.2-0.3% as there is less tailwind from the EUR weakening and as the indirect support from the higher oil price usually kicks-in with a lag of around 12 months. The lower headline inflation should also follow as the contribution from energy price inflation should go down by 0.2pp compared with April due to less support from base effects. Food price inflation is also set to continue lower in May and print at the lowest level since December.
Inflation in June (released 30 June): we expect headline inflation to decline a bit further to 1.3%, reflecting energy price base effect continues to fade, bringing the contribution to inflation down by another 0.2pp. On the other hand, core inflation should increase slightly to 0.9% as we expect non-energy industrial goods price inflation to go a bit higher as an indirect impact of the higher oil price starting to lift it slowly. Service price inflation is also supported by an indirect impact of the higher oil price, but as the sector is highly dependent on the labour input, the overall figure should remain modest as long as wage growth is subdued. We expect food price inflation to go slightly higher.
Inflation in July (released 31 July): headline inflation is set to go 0.1pp higher to 1.4% but core inflation should remain unchanged at 0.9%, still reflecting the lack of expected upward pressure from wages. The higher headline inflation is instead supported by an increase in energy price inflation as there is a temporary support from base effects during the summer months. Food price inflation should be a bit lower again in July although modestly so.
Inflation in August (released 31 Aug): headline inflation should again go a bit higher to 1.5% but again we expect core inflation to remain unchanged at 0.9%, implying the only month that we expect core inflation to print at 1.0% is in April, where it is lifted by the early timing of Easter last year. In line with the higher headline inflation in July, it is again lifted by a higher support from energy price inflation while food price inflation is modestly lower
Variation in inflation driven mainly by commodity prices
The recent rise in headline inflation is driven by a lift in energy price inflation. Historically, energy price inflation has explained around 50% of variation in inflation despite its low weight.
The strong positive contribution from energy price inflation is set to fade as the positive base effects of the very low oil price in early 2016 will not continue to be supportive
Food price inflation has been lifted recently by unprocessed food prices, due mainly to cold weather. This should correct itself in the spring as indicated by 5% lower commodity food prices
Core inflation drivers
Core inflation is affected by a number of factors but most important is wage growth, as it affects the labour-intensive service prices, which account for around 60% of core inflation.
Service price inflation is highly dependent on wage growth but slack in the labour market – particularly in the periphery countries – should result in a long period of subdued wage pressure
The correlation between the output gap and core inflation is not seen in all countries. Irish core inflation is being kept low by non-energy industrial goods despite a positive output gap.
Core inflation drivers (continued)
Core inflation is affected indirectly by commodity prices and the higher oil price has started to lift service inflation, but non-energy industrial goods inflation is affected with a 12-month lag.
The EUR weakening in 2014-15 supported core inflation and was the main reason why core inflation printed above 1.0% in 2015. The tailwind has since faded and should remain modest
Service price inflation expectations have diverged strongly from the actual inflation figures. Therefore, we do not use these measures as important indicators of core inflation
Service price inflation components
Overall service price inflation is determined mainly by the wage pressure but it can be disaggregated into six sub-components where one of them is indirectly related to the oil price
The ongoing recovery is also set to support service price inflation at the end of this year. Likewise, higher house prices and the cost of borrowing are supportive for service inflation.
Service price inflation in communication has again turned negative and should remain negative. Prices related to package holidays should add volatility particularly around the Easter months
Non-energy industrial goods price inflation components
Non-energy industrial goods price inflation is affected by commodity prices, exchange rate developments and the economic situation, as it affects inflation of clothing and garment prices.
Non-energy industrial goods price inflation is affected indirectly by changes in the oil price but there is a lag. Changes in the effective EUR also affect the core inflation component
The third component of non-energy industrial goods price inflation (semi-durable) depends mainly on clothing and garments prices and is very volatile. The trend follows durable goods
Daily Technical Analysis
EURUSD
The EURUSD retreated lower yesterday bottomed at 1.0798. The “shooting star” formation on daily chart I showed you yesterday gave us a valid bearish pullback warning. The bias is bearish in nearest term testing the H1 EMA 200 and the trend line support (see my H1 chart below)located around 1.0785. A clear break below that area would expose 1.0725/00 region. Immediate resistance is seen around 1.0850. A clear break above that area could lead price to neutral zone in nearest term but only a clear break above 1.0905 would cancel the “shooting star” bearish reversal scenario targeting 1.1000 or higher. Overall I remain neutral.
GBPUSD
The GBPUSD had a strong bearish momentum yesterday bottomed at 1.2441 and hit 1.2375 earlier today in Asian session. As you can see on my H1 chart below, price broke below the bullish channel and H1 EMA 200 suggests a bearish view. The bias is bearish in nearest term testing 1.2300 area. Immediate resistance is seen around 1.2450. A clear break back above that area could lead price to neutral zone in nearest term testing 1.2500/30 region. Overall I remain neutral.
USDJPY
The USDJPY attempted to push lower yesterday bottomed at 110.17 but whipsawed to the upside and closed higher at 111.13. The “hammer” formation I showed you yesterday gave us a valid warning of a bullish pullback. The bias is bullish in nearest term especially if price able to make a clear break above 111.30 testing 112.00 or higher. On the downside, key support remains at 110.10. A clear break below that area would cancel the “hammer” bullish reversal scenario.
USDCHF
The USDCHF had a bullish momentum yesterday topped at 0.9935. Overall price is still in a bearish phase but the bias is bullish in nearest term testing 1.0000 resistance area which is a good place to sell with a tight stop loss. Immediate support is seen around 0.9900 – 0.9885 area. A clear break below that area could lead price to neutral zone in nearest term testing 0.9800 region. Overall I remain neutral.
Market Morning Briefing
STOCKS
Signs of tightening liquidity is visible as the central bank of China refrained from injection short-term funds into the banking system. This could have led to a fall in stock prices yesterday. Shanghai (3245.91, -0.22%) came off slightly yesterday but is testing important support on the daily charts. A bounce back towards 3275 and higher could be expected in the near term.
Strong US Consumer confidence data seem to have boosted a rise in Dow (20701.50, +0.73%) which rose from levels near 20520 yesterday. A rise back towards 21000 may be expected in the next couple of sessions.
Dax (12149.42, +1.28%) looks bullish for the near term. There is scope of rising towards 12220-12300 levels in the medium term.
Nikkei (19197.35, -0.03%) could move up towards 19400 and higher in the near term. Cues from the US-Japan yield spread indicate some up move in the near term. But on a medium term, Nikkei remain consolidative within 19600-18600 region.
Nifty (9100.80, +0.61%) is holding well above immediate support near 9000. A couple of sessions could be spent in the 9000-9200 region before a fresh rally is seen. Below 9000, supports are seen near 8990 and 8960 respectively. Overall near term looks bullish.
COMMODITIES
Gold (1248) is trading below 1264, which is the upper band of its recent trading range of 1213-1266. A close below 1239 could open up lower supports at 1213 and 1200 respectively.
Silver (18.07) is also trading within the range of 17.81-18.35.In case of any fresh buying momentum in copper above 2.70 could restrict the downside in the near term for silver. The trend is neutral in the near to medium term time frame for bullion thus sideways consolidation could be seen.
We would like to repeat our forecast dated 23rd March-17 on Copper (2.66). “Copper (2.62) found support at 2.57 levels. While 2.57 hold, a bounce to the interim resistance 2.68-70 can be seen. Only above 2.70, higher resistances of 2.80 can come into consideration. In the medium term 2.55-57 are going to be a strong support now and the chances of a close above 2.70 have increased.”
Both Brent (51.45) and WTI(48.54) have found support and trading within the range of 50-52.80 and 47-50.30 respectively. This bounce was expected and it may continue for a few sessions more. We will remain bearish while Brent and WTI are trading below of their resistances of 52.8 and 50.30 respectively. Market will remain volatile today as U.S. weekly crude oil inventory data will be published at 8:00 p.m IST.
FOREX
The US consumer confidence in March has surged to a 16-year high, pointing to fresh momentum in the economy and boosting Dollar. Pound is hurt by the UK PM signing the letter to trigger Brexit formally.
In line with expectations, Dollar Index (99.72) has bounced after making a low at 99.85, right in our support zone of 99.00-98.50 and a break above 99.90 may extend the bounce to 100.70-101.00.
Euro (1.0818) has reversed from 1.09, a bit short from our target of 1.10 as both the German-US 2Yr & 10Yr have turned down (Check Interest Rates section). A break below the immediate support 1.08 can confirm a near term reversal to the downside and open up lower targets of 1.07. The price action now at 1.08 may be the decider for the week.
Dollar-Yen (111.23) has bounced from 110.00 on the back of worse than expected Japan retail sales data and the general Dollar strength in the last session. It remains to be seen if the immediate resistance at 111.50-60 can be overcome to open up 113.00 to the higher side. A failure near 11.50-60 can resume the major downtrend and trigger the lower targets of 109.40 and 108.50 again.
Pound (1.2411) has crashed from 1.2600, a bit short of our target/resistance of 1.2650-1.2700 and now the support 1.2370-60 is being tested. Most of the possible damage from the Brexit has been discounted by the price but a break below 1.2360 may drag the currency much lower.
Aussie (0.7646), after a brief foray below the support of 0.76, has bounced back on firmer base metal prices (Check Commodities section). The sideways consolidation in the range of 0.7600-0.7750 is not expected to change immediately.
Dollar Rupee (65.04) has opened up lower target/support of 64.80-60 with a closing below 65.20. Immediate resistance comes at 65.20 now.
INTEREST RATES
The US yieldshave moved up slightly and could continue to move higher for some more sessions before re-testing important resistances. 3.20%, 2.6% and 2.1% are the respective resistances on the 30Yr (3.0350, 10Yr (2.43%) and the 5yr (1.98%) which could be tested in the coming sessions before again falling off from there.
The US 10-5Yr (0.45%) is testing support near current levels and could bounce back over the next couple of sessions to rise again towards 0.475%. this could indicate a sharper rise in the 10yr yield compared to the 5yr.
The German-US 2YR (-2.01%) has faced some rejection just below the resistance near -1.95%. While this holds, the upside for euro could be limited just now and we could see a small corrective dip in both Euro and the yield spread.
The German-US 10YR (-2.04%) is holding well for now and this could push the yield spread towards -2.10% in the coming sessions.
The US-Japan 10YR (2.36%) has bounced from levels near 2.30% and could move higher towards 2.4% in the near term. This could possibly pull up Nikkei and Dollar-yen in the coming sessions.
Pound Lower As UK And EU Divorce Begins
UK PM Will Deliver Letter Triggering Brexit
The Prime Minister of the United Kingdom, Theresa May, will invoke article 50 of the Lisbon treaty on Wednesday, March 29 at 7:00 am EDT (11:00 GMT) by telling the British parliament that she has submitted the signed letter to the European Union. This symbolic exchange will trigger a two-year process that will result in the UK withdrawal from the EU. The PM will face questions from the Commons at that time with a statement expected at 7:30 am EDT (11:30 am GMT). Within 48 hours the EU will circulate a draft of negotiating guidelines to be discussed in late April.
The Brexit referendum on June 23, 2016 kicked off a tidal wave of political instability as British citizens voted to break a long-standing economic and social pact. Opinion polls badly missed the mark, leaving markets in high state of volatility as investors reacted to the shocking result. The pound has depreciated more than 15 percent since the vote as the Bank of England and other institutions have warned of the risks of ending the relationship without a fall back option.
The market has already priced in the first wave of Brexit after the referendum but the length of the process and the different stances (hard vs. soft exit) and the particular timing (French and German elections this year) complicates the valuation of the true impact to the UK economy of the decision to leave the Union. Investors need to follow the developments out the London and the reaction in Europe as this two-year divorce gets under way.
The GBP/USD lost 0.851 percent in the last 24 hours. The pound is trading at 1.2463 ahead of Theresa May invoking article 50 of the Lisbon treaty and effectively triggering the two year Brexit process. The currency is lower as investor anxiety rises despite tomorrow’s proceeding being mostly bureaucratic with little room for surprises.
Former UK PM David Cameron resigned on the aftermath of the Brexit referendum leaving it up to Theresa May to steer the UK into uncertain waters. The European Union has made it clear that they will be tough negotiators with Germany the most vocal with Finance Minister Schauble saying : “We have no interest in punishing the UK, but we also have no interest in putting European integration in danger over the UK,”
The main contributor to volatility in the pound trade will be the negotiations as the Brexit Leave camp made bold promises that are almost impossible to get the EU to agree to. The upcoming French and German elections complicate matters for the UK Brexit negotiating team as the results could reshape the EU into one pushing a tougher endgame for the UK.
The UK100 has risen 0.667 percent in the last 24 hours. The FTSE closed at 7,343.42 recovering from a 0.6 percent fall the previous trading session. The fall of the currency has boosted the British stock market as it can result in higher sales for UK companies. The stock market had recorded losses on Monday due to the lack of confidence in the US President Donald Trump affecting global stock markets. Equities were sold given the problems the US administration faced when pushing through the healthcare bill to repeal Obamacare. The UK financial sector could end up being one of the biggest losers if London loses relevance as global banks abandon the city in an effort to keep doing business in Europe.
A worrying trend for the UK appears to be the softening of May’s tone on seeking a hard Brexit taking in contrast to Germany’s tougher stance. The fact that the 27 members have to agree on a deal will further complicate things specially as member elections and fear of more anti-union movements within the EU could end up with a worse deal for the UK with a limited set of options.
Market events to watch this week:
Wednesday, March 22
7:00 am UK Government Triggers Article 50
10:30 am USD Crude Oil Inventories
4:00 pm NZD Official Cash Rate
4:00 pm NZD RBNZ Rate Statement
Thursday, March 23
5:30am GBP Retail Sales m/m
8:00am USD Fed Chair Yellen Speaks
8:30am USD Unemployment Claims
Friday, March 24
8:30am CAD CPI m/m
8:30am USD Core Durable Goods Orders m/m
Dollar Darts Ahead, Article 50 Next
Bull markets rarely end in collapse and the US dollar proved that on Tuesday as it roared back to life. The Australian dollar was the top performer while the pound lagged. Japanese retail sales are up next but the big story in the day ahead will be Article 50. After closing both EURCAD and EURAUD trades at a profit, one of pairs will be re-opened later ahead of the Asia Wednesday session. More on the charts rationale in the Premium video below.
We wrote yesterday about how the US dollar was at a crossroads. On Monday, it tumbled early but instead of continuing to wilt, it bounced and that underscored the indecision in the market.
Today, strong economic data and more signs of renewed political resolve gave the dollar a lift. As the gains mounted, the US dollar erased all of Monday's losses to leave it virtually flat on the week.
What had looked like a breakout in EUR/USD is now a trade wracked with questions.
What's clear is that the US dollar won't seriously stumble so long as economic data is improving. On Tuesday, US consumer confidence jumped to 125.6 compared to 114.0 expected; that's the best in 17 years. The Richmond Fed also hit the best since 2010.
The Fed's Fischer made an appearance but offered little we didn't know. He said two more hikes this year was his baseline and that the risks were balanced.
Two things will keep markets off balance in the days ahead. The first is looming quarter end and Japanese fiscal year end. The second is the UK announcement due on Wednesday.
In theory, the announcement is 100% expected and it should be fully priced in. May will likely make the announcement in parliament at noon and the letter will be delivered to Donald Tusk 30 minutes later.
The danger is that GBP flows accelerate after the announcement. In particular, the net cable position is at the most-short on record and that leaves the pair vulnerable to a squeeze.
Before May takes the spotlight, the economic data to watch in Asia-Pacific trading comes at 2350GMT when Japanese retail is released. The BOJ is showing no signs of easing off the gas pedal but a reading better than the +0.3% m/m expected would be a small step in that direction (albeit still not a JPY mover).