
Sample Category Title
US: ISM Services Index Tumbles to Lowest Print Since June, But Still Points to Growth
The ISM Services index fell 3.9 points to 52.1 in November, well short of the 55.7 consensus expectations. Fourteen industries out of eighteen reported growth, the same as in October.
Broad based weakness across component sub-indexes weighed on the headline measure. Business activity and new orders both suggested ongoing growth (53.7) despite falling 3.5 and 3.7 percentage points, respectively.
The employment sub-index suggested a slower expansion of payrolls, falling 1.5 points to 51.5. November marks the fifth month this year that services sector employers reported growing headcounts.
The prices paid sub-component was virtually unchanged (58.2 vs 58.1 in October), while supplier deliveries times rapidly shrank, tumbling 6.9 points to 49.5, signaling faster delivery times for the first time since August.
Key Implications
On the face of it, this month's ISM services print is a bit of a surprise, but the details still show robust growth across components. In particular, the employment indicator, which had spent much of the year below the 50 mark, held in expansion territory despite the pullback in activity and new orders growth.
This report was softer than expected, but with the details still pointing to expansion, and 14 of 18 industries reporting growth, the services sector looks to be in good shape. If anything, the strong underlying data gives a sense that the November slip-up could be reversed shortly, much the same way that last December's weak print was quickly reversed in January.
Sunset Market Commentary
Markets
Bank of England governor Bailey, ECB president Lagarde and Fed chair Powell today all grab(bed) their final occasion to guide market expectations going into final policy meetings of the year, which for the ECB and the Fed include updated growth and inflation forecasts. BoE Bailey spoke at the Financial Times’ Global Boardroom conference. Headlines suggested that he expects four UK rate cuts next year as inflation eases. In a detailed reading, we think this guidance is more nuanced with Bailey referring to market expectations in the November economic forecast: “We always condition what we publish in terms of the projection on market rates, and so as you rightly say, that was effectively the view the market had.” At that November meeting, the BoE worked with three scenario’s. Apart from the central one, they used one with a faster disinflationary process and one with a less encouraging inflation outlook. Bailey did acknowledge that even in the central view, the BoE would have to lean in a bit harder to keep inflation on a sustainable path towards the 2% target. UK assets initially reacted on the “misleading” headlines, pushing UK yields and GBP lower. The move didn’t last and even rapidly ran on a counter. UK gilts slightly underperform US Treasuries and German Bunds. UK yields currently add around 5 bps across the curve with UK money markets discounting a rate cut skip at the December meeting and a 25 bps rate cut in February. EUR/GBP is again exploring the recent lows near 0.8275 with geopolitics adding a tad of euro weakness after the crew of a Russian ship in the Baltic Sea shot signal ammunition at a German military helicopter.
ECB president Lagarde appeared before a Committee on Economic and Monetary Affairs at the European Parliament. She sounded worried on the short term economic outlook, but expects the recovery to gather some steam further on. Inflation is temporary higher in Q4 but should hit the 2% target in the course of next year. While the target is in sight, it hasn’t been fully reached she added. She didn’t comment on the outcome of the December meeting, but she definitely didn’t push to speed up the policy normalization. We stick to the view that 25 bps rate cuts remain the way forward, in contrasts to EMU money markets discounting at least one 50 bps rate cut at one of the next three ECB meetings. In a broader context, Lagarde endorses ECB chief economist Lane’s recent proposal to base decision making again with a forward looking view rather than sticking with the backward looking data dependency which prompted the surprise October rate cut. Finally, Lagarde confirmed that it’s premature to start discussing the optimal size of the balance sheet, implying that the current run-off could easily continue for at least another 12 months.
Fed Chair Powell only addresses media after today’s European close. Our base scenario is a 25 bps rate cut in December with a potential pause in January on the back of better eco data and awaiting Trump’s agenda. In the meantime, EUR/USD continues drifting south and back below 1.05. November ADP employment growth was near consensus at 146k, but came with a significant downward revision of the October number, from 233k to 184k. The US non-manufacturing ISM is also still scheduled for release in between finishing this report and Powell’s speech.
News & Views
The OECD expects the global economy to grow at 3.3% next year. That’s slightly faster than the 3.2% projected for this year, which was also penciled in for 2025 in earlier estimates. The upgrade came on the account of the US, which the Paris-based organization anticipates to expand a lofty 2.4% vs 1.6% in May. OECD’s Pereira warned, however, that these forecasts assume no change in trade policies, adding that risks to the outlook are increasing from trade tensions and protectionism. French and German growth was cut to 0.9% and 0.7% respectively as political uncertainty lingers and fiscal pressure mounts while the EMU’s figure was lowered to 1.3%. Widening budget deficits are among the key worries for the OECD. It expects that all but the most indebted members of the G7 (Italy and Japan) will continue to increase borrowing as a percentage of GDP. For the OECD as whole, debt to GDP would rise to 117% by end 2026%. Pereira urges governments to “seize this opportune moment” to fix public finances. It warned the UK on the matter, saying that its fiscal stance is unsustainable without additional tax increases. Its large government deficits will keep pushing up debt to 106.2% of GDP in 2026. UK growth is forecasted to come in at 1.7%, up from a previous 1.2% estimate. The institution cautioned central banks to go tread carefully with rate cuts, citing persistent services inflation. The ECB rate should bottom around 2% end 2025 & the Fed’s around 3.25-3.5% in early 2026.
US ISM services drops sharply to 52.1 in Nov, signals slower growth
US ISM Services PMI slipped significantly to 52.1 in November, down from October’s robust 56.0 and missing market expectations of 55.5. This marks a sharp deceleration in the service sector, which has been a key driver of economic resilience.
Key components of the report painted a picture of slower activity across the board. Business activity/production fell from 57.2 to 53.7, while new orders mirrored this decline, dropping to 53.7 from 57.4. Employment growth also softened, with the employment index easing from 53.0 to 51.5, indicating reduced hiring momentum. Prices index ticked up slightly, rising to 58.2 from 58.1, suggesting persistent cost pressures within the sector.
According to ISM, the current PMI reading corresponds to an estimated 1% annualized increase in real GDP. This suggests that while the services sector remains in expansion territory, its contribution to broader economic growth has slowed markedly.
EUR/USD Hugs 1.0500 Ahead of French No-Confidence Vote, Breakout Incoming?
- EUR/USD hovers near 1.0500 as traders await the outcome of the French no-confidence vote.
- ECB policymakers suggest a 25 bps rate cut is likely in December.
- Technical analysis indicates key support and resistance levels for EUR/USD.
The 1.0500 continues to serve as a magnet for EUR/USD with the pair moving higher or lower for brief periods before finding its way back to the psychological level. It appears market participants are waiting on a catalyst of some sort. Will the ‘French No-Confidence vote’ prove to be the catalyst?
France No-Confidence Vote
The French Government has faced its fair share of woes in 2024 while going through an election that surprised many. The current ‘kingmakers’ appear to be the so called right leaning National Rally headed by Marine Le Pen who some claim has never held more power in France than she does at present.
The vote of no-confidence stemmed from budget disagreements and spending on social issues and pensions. This came at a time when the French Government has been dealing with ongoing discontent from the agriculture community as well.
The fragile coalition assembled by PM Barnier following the election looks to be in jeopardy with the Euro facing downside risks as a result. If Barnier is removed, it could worsen the political crisis in the euro zone’s second-biggest economy. Add this to struggles by the euro zone’s most industrialized economy, Germany and the Euro may be at risk of parity against the US Dollar in 2025.
ECB Policymaker Comments
There was debate around the ECB this month regarding a 25 or 50 bps cut. A lot of the noise appeared to die down following an uptick in German inflation and better than expected consumer confidence data last week.
A 50 bps cut now looks unlikely with ECB policymakers this week reiterating such a stance. This morning we heard from ECB Policymaker Ollie Rehn who said he sees more grounds for December rate cut and more policy easing ahead. Fellow Policymaker Boris Vujcic stated that small steps are better given the uncertainties present.
This leads me to believe that a 25 bps cut is the most likely outcome and could explain why the EUR/USD selloff has struggled to gain momentum below the 1.0500 handle.
ECB Rate Probabilities – December 2025
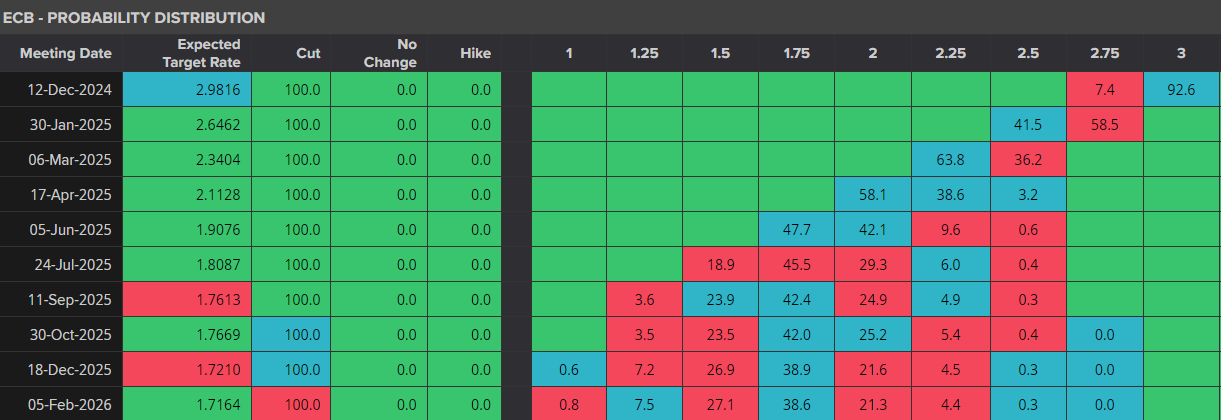
Source: LSEG (click to enlarge)
ECB President Lagarde speaks later in the day as well as policymaker Makhlouf. On the calendar front we have a few US data releases which could stoke some volatility but are unlikely to inspire a lasting break of the recent trading range.

Technical Analysis
From a technical standpoint, EUR/USD has been using a 1.0500 handle like a magnet over the since a recovery on November 25 from lows around the 1.0350 handle.
The lack of acceptance above or below the 1.0500 handle has frustrated market participants but is understandable given the host of variables at play. The longer term view does favor further downside, however the immediate future of the pair is more of a mixed bag.
There are growing signs that a breakout is imminent with my belief that a short-term bounce may be on the cards before a break of the recent lows at 1.0350 comes to fruition. I could be wrong and US data this week could tank that idea. However, given that i expect labor data to come in as expected and not throw up any surprises, the data has proven less than trustworthy in recent months.
For now though, immediate resistance above 1.0500 rests at the 1.0600 and 1.0700 handles respectively.
Looking at the potential for a break lower and immediate support rests at 1.0460 before the 1.0400 and 1.0330 handles respectively.
EUR/USD Daily Chart, November 4, 2024

Source:TradingView.com
Support
- 1.0460
- 1.0400
- 1.0330
Resistance
- 1.0600
- 1.0700
- 1.0755
GBP/USD Mid-Day Outlook
Daily Pivots: (S1) 1.2639; (P) 1.2670; (R1) 1.2702; More...
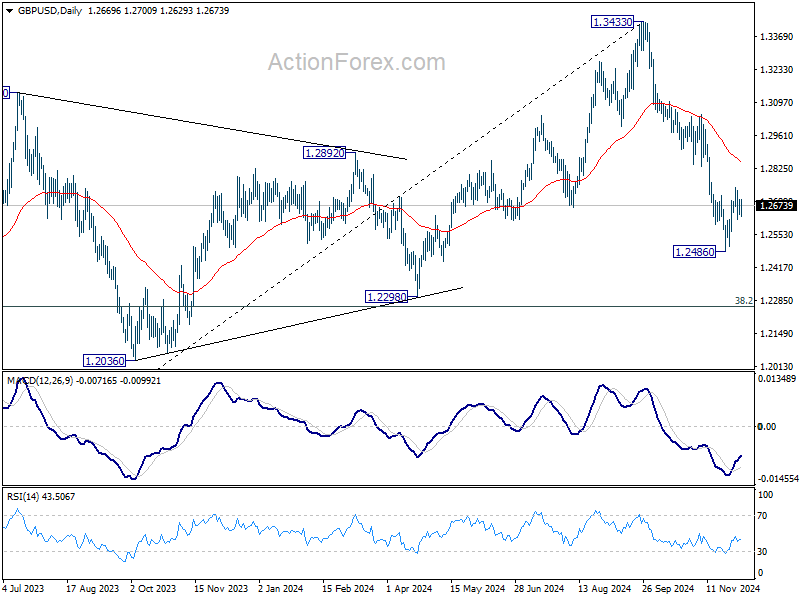
Range trading continues in GBP/USD and intraday bias stays neutral. While another rise cannot be ruled out, outlook will stay bearish as long as 55 D EMA (now at 1.2858) holds. Below 1.2615 minor support will turn intraday bias back to the downside for retesting 1.2486. Break there will resume whole fall from 1.3433.
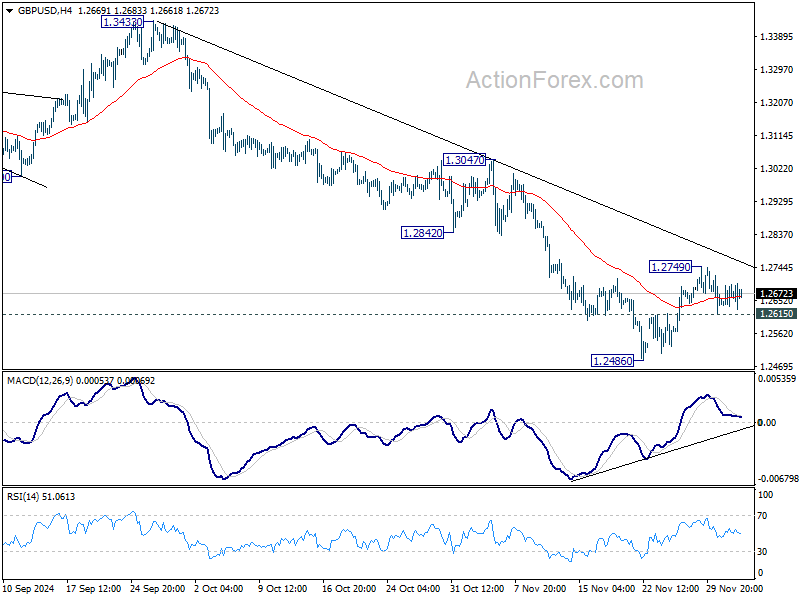
In the bigger picture, a medium term top should be in place at 1.3433, and price actions from there are correcting whole up trend from 1.0351 (2022 low). Deeper decline is now expected as long as 55 D EMA (now at 1.2867) holds, to 38.2% retracement of 1.0351 to 1.3433 at 1.2256, which is close to 1.2298 structural support. Strong support should be seen there to bring rebound.
EUR/USD Mid-Day Outlook
Daily Pivots: (S1) 1.0482; (P) 1.0508; (R1) 1.0536; More...
No change in EUR/USD's outlook as range trading continues. Intraday bias remains neutral and further decline is expected with 1.0609 resistance intact. On the downside, break of 1.0330 will resume the fall from 1.1213. Also, sustained trading below 1.0404 key fibonacci level will carry larger bearish implication. Nevertheless, firm break of 1.0609 will turn bias back to the upside for 1.0760 support turned resistance first.

In the bigger picture, immediate focus is now on 50% retracement of 0.9534 (2022 low) to 1.1274 at 1.0404. Strong rebound from this level will keep price actions from 1.1273 (2023 high) as a medium term consolidation pattern only. However, sustained break of 1.0404 will raise the chance that whole up trend from 0.9534 has reversed. That would pave the way to 61.8% retracement at 1.0199 first. Firm break there will target 0.9534 low again.

USD/CHF Mid-Day Outlook
Daily Pivots: (S1) 0.8833; (P) 0.8861; (R1) 0.8892; More…
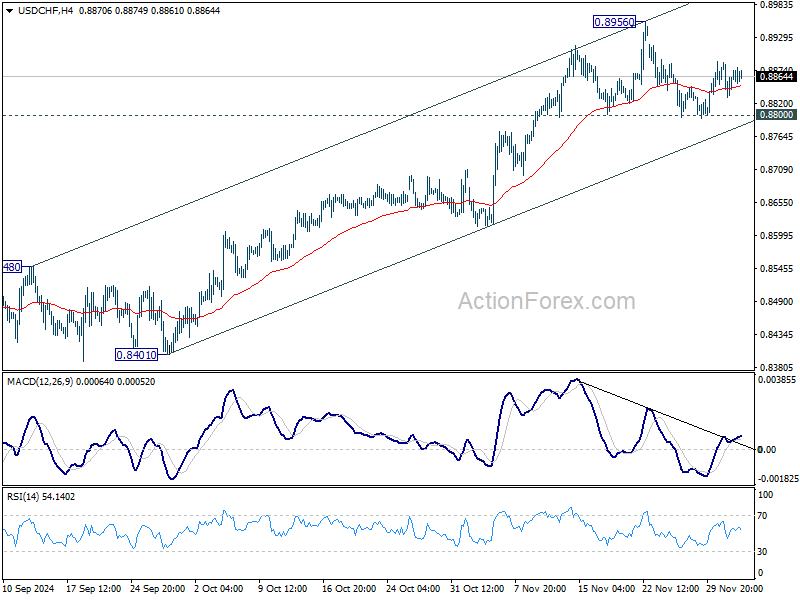
No change in USD/CHF's outlook as range trading continues. Intraday bias remains neutral and further rise is expected with 0.8800 support intact. On the upside, break of 0.8956 will resume the rally from 0.8374, and target 0.9223 key resistance next. However, firm break of 0.8800 will confirm short term topping and turn bias back to the downside for 55 D EMA (now at 0.8736).
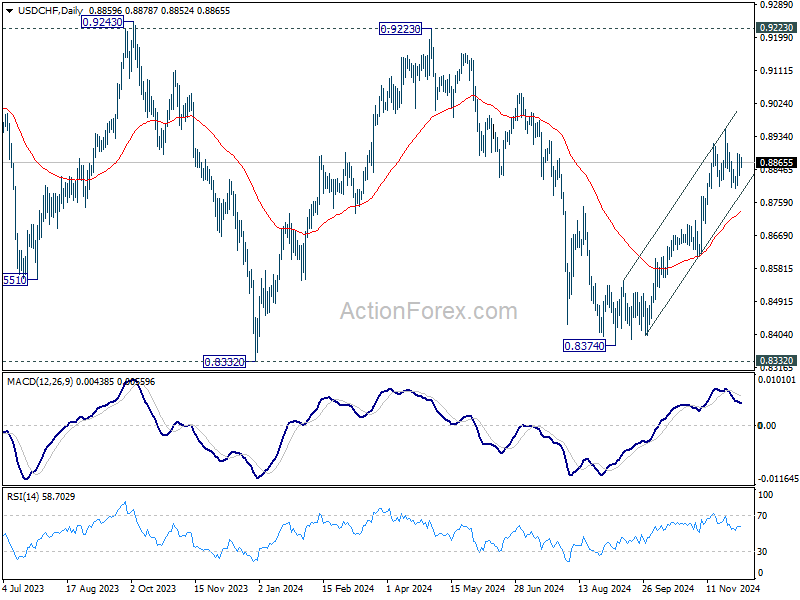
In the bigger picture, price actions from 0.8332 (2023 low) are currently seen as a medium term corrective pattern. Rise from 0.8374 is seen as the third leg. Overall outlook will continue to stay bearish as long as 0.9223 resistance holds. Break of 0.8332 low is in favor at a later stage when the consolidation completes.
USD/JPY Mid-Day Outlook
Daily Pivots: (S1) 148.75; (P) 149.49; (R1) 150.34; More...
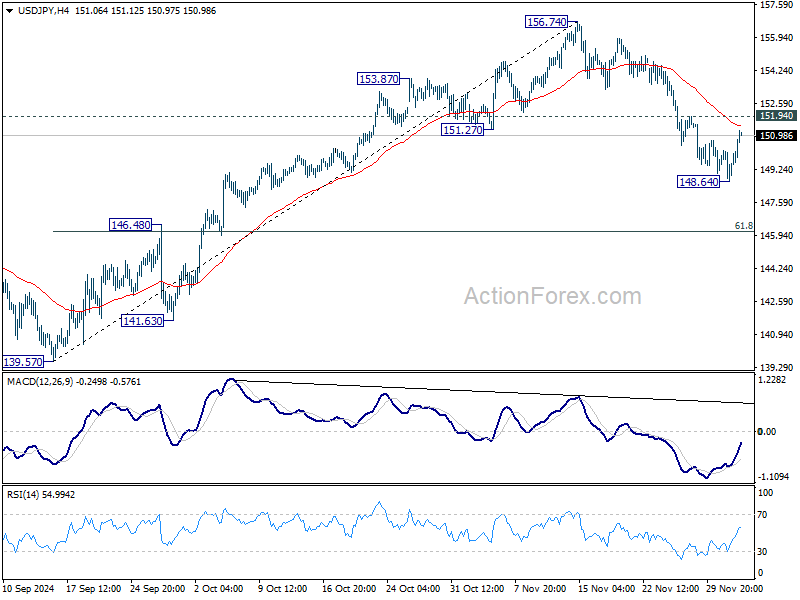
Intraday bias in USD/JPY remains neutral for the moment. On the downside, break of 148.64 temporary low will strength the case that rise from 139.57 has already completed at 156.754. Deeper fall should then be seen to 61.8% retracement of 139.57 to 156.74 at 146.12 next. Nevertheless, firm break of 151.94 resistance will revive near term bullishness and bring retest of 156.74 high.
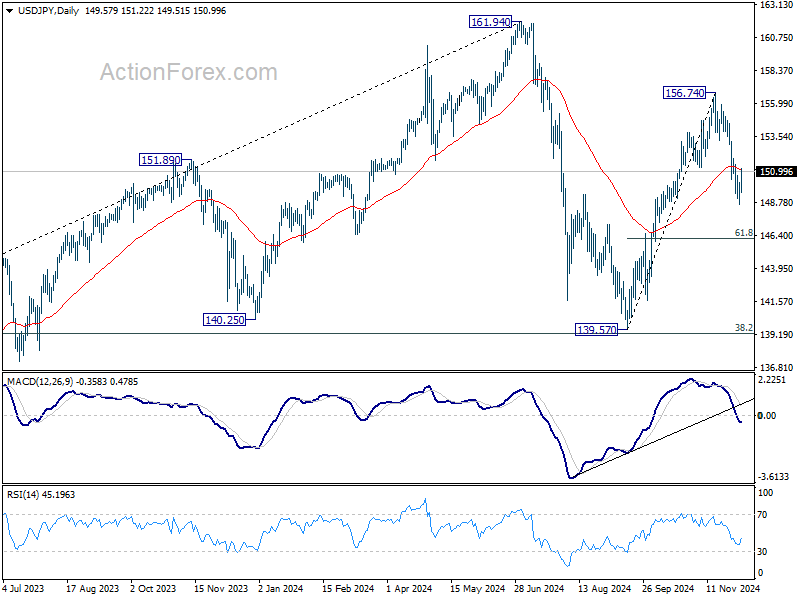
In the bigger picture, price actions from 161.94 are seen as a corrective pattern to rise from 102.58 (2021 low). The range of medium term consolidation should be set between 38.2% retracement of 102.58 to 161.94 at 139.26 and 161.94. Nevertheless, sustained break of 139.26 would open up deeper medium term decline to 61.8% retracement at 125.25.
Dollar Shrugs Slight ADP Miss, Sterling Rises on BoE’s Gradualist Easing
Dollar is mixed as markets enter into US session, with traders digesting the slightly weaker-than-expected ADP private employment report. The re-accelerating pay growth as shown in the report might prompt some concerns among hawkish members of Fed. But the focus remains on Friday’s non-farm payroll data, the definitive input for assessing labor market health. Fed fund futures currently suggest a 76% probability of a 25bps rate cut at the December meeting, but this is not set in stone.
Sterling is outperforming peers today, buoyed partly by upward revision in UK PMI and supportive remarks from BoE Governor Andrew Bailey. Bailey reiterated a "gradual approach" to monetary easing. The indirect hint of four rate cuts next year aligned well with market expectations. His comments reflect the dual challenges facing the BoE: managing the domestic impact of the Autumn Budget and navigating international risks, particularly trade disruptions from US tariff policies under the new administration.
Meanwhile, Aussie extends its post-GDP decline, making it the weakest performer of the day. Yen also lags, as US and European benchmark yields rebound, while Kiwi follows as third worst. Loonie leads gains, with Dollar and Sterling following, while Euro and Swiss Franc sit in the middle of the pack.
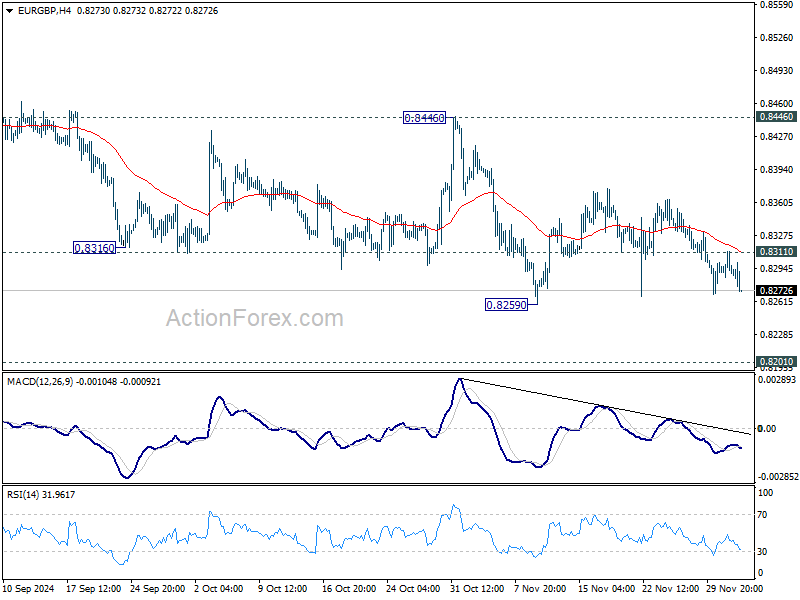
Technically. EUR/GBP might be heading to retest 0.8259 support and break through there finally to resume the larger up trend. But then, the key is whether important structural support at 0.8201 (2022 low) could provide enough support to bring sustainable rebound. Meanwhile, break of 0.8311 minor resistance will delay the near term bearish case, and bring more sideway trading.
In Europe, at the time of writing, FTSE is down -0.25%. DAX is up 0.86%. CAC is up 0.60%. UK 10-year yield is up 0.0454 at 4.297. Germany 10-year yield is up 0.035 at 2.095. Earlier in Asia, Nikkei rose 0.07%. Hong Kong HSI fell -0.02%. China Shanghai SSE fell -0.42%. Singapore Strait Times rose 0.36%. Japan 10-year JGB yield fell -0.0279 to 1.053.
US ADP employment rises 146k in Nov, pay gains accelerate slightly
US ADP report showed private employment increasing by 146k in November, missing market expectations of 165k. The growth was concentrated in service-providing sectors, which added 140k jobs, while goods-producing sectors saw a modest rise of 6k.
By establishment size, large companies led the way with 120k new jobs, while medium-sized firms added 42k. Small businesses, however, reported a loss of -17k jobs.
Pay gains saw an uptick for the first time in over two years. Job-stayers’ pay growth edged up to 4.8% yoy, while job-changers experienced a more robust 7.2% yoy increase.
ADP’s Chief Economist, Nela Richardson, highlighted the mixed industry performance, stating, “Manufacturing was the weakest we've seen since spring. Financial services and leisure and hospitality were also soft.” The data underscores a healthy but uneven labor market, with certain sectors and business sizes faring better than others.
BoE's Bailey reiterates gradual approach to rate cuts
In an interview with the Financial Times, BoE Governor Andrew Bailey acknowledged that while inflation had recently dropped to target levels, there remains “a distance to travel” in managing price stability. He noted that inflation might temporarily exceed target levels again ahead.
Bailey addressed market expectations for four rate cuts next year, emphasizing that BoE's projections are "conditioned on market rates" and highlighting the word "gradual" in their approach.
On the impact of Donald Trump’s return to the White House and the associated rise in tariffs, Bailey described the effects as "not straightforward at all."
He explained that such policies could move traded prices but are also contingent on reactions from other countries and exchange rate adjustments, adding further uncertainty to the inflation outlook.
UK PMI services finalized at 50.8, growth stalls amid rising costs and gloomy outlook
UK services sector showed signs of slowing in November, with final PMI Services reading dropping to 50.8 from October’s 52.0, marking the weakest level in 13 months. Composite PMI similarly declined to 50.5 from 51.8, barely holding above the threshold for expansion.
Tim Moore, Economics Director at S&P Global Market Intelligence, remarked that service providers saw activity "close to stalling". Businesses faced weaker sales pipelines, postponed projects, and heightened caution among clients, all of which curtailed growth.
Additionally, the anticipation of higher employer National Insurance contributions weighed on hiring decisions, with workforce numbers shrinking for the second consecutive month. Many firms cited margin pressures as a reason for not replacing departing staff.
Inflationary pressures intensified, with salary costs driving input price increases at the fastest pace since April. This, coupled with worries about policies outlined in the Autumn Budget, led to a "considerable reduction" in business optimism.
ECB's Lagarde highlights Eurozone growth risks and trade vulnerabilities
Speaking at the European Parliament's Committee on Economic and Monetary Affairs, ECB President Christine Lagarde flagged "weaker" short-term growth prospects for the Eurozone, citing slowdown in services and persistent contraction in manufacturing. Despite this, she projected a gradual recovery in consumer spending and investment as monetary tightening effects fade and real incomes improve.
Lagarde cautioned, however, that the medium-term economic outlook remains fraught with uncertainties, particularly due to elevated "geopolitical risks" and potential "trade barriers." She emphasized that Eurozone's deep integration into global supply chains leaves it "vulnerable to foreign shocks," posing challenges to manufacturing and investment.
On inflation, Lagarde noted an expected temporary rise in Q4 as earlier declines in energy prices fade from annual comparisons. Beyond that, inflation is anticipated to decline toward ECB's target next year.
Reiterating ECB's data-driven approach, Lagarde stated, "We will review our stance again next week, following our data-dependent and meeting-by-meeting approach. We are therefore not pre-committing to a particular rate path."
Eurozone PPI rises 0.4% mom in Oct led by rising energy costs
Eurozone PPI increased by 0.4% mom in October, aligning with market expectations. On an annual basis, PPI fell by -3.2% yoy, the anticipated -3.3% decline, reflecting mixed dynamics across sectors.
In Eurozone, Energy prices surged by 1.4% mom, driving the monthly increase, while intermediate goods prices slipped by -0.1% mom. Capital goods prices were unchanged, while durable consumer goods rose by 0.3% mom and non-durable consumer goods by 0.2% mom.
Across the EU, PPI also rose by 0.4% mom, while the annual figure showed a decline of -3.0% yoy. Among Member States, Estonia and Italy led the monthly increases with a 1.0% rise, followed by France (+0.9%) and Sweden (+0.8%). Conversely, Bulgaria experienced the sharpest decline at -2.9%, followed by Slovakia (-2.0%) and Romania (-1.5%).
Eurozone PMI composite finalized at 10-month low as stagflation concerns loom
Eurozone’s final PMI Services reading fell to 49.5 from October’s 51.6, marking a 10-month low. Composite PMI followed suit, dipping to 48.3 from 50.0, also the lowest in 10 months, indicating that the region’s private sector is contracting.
Among major economies, Ireland stood out as a bright spot with its Composite PMI hitting a 30-month high at 55.2. Conversely, Germany and France—the bloc's economic heavyweights—reported Composite PMI levels of 47.2 and 45.9, respectively,.
Cyrus de la Rubia, Chief Economist at Hamburg Commercial Bank, described Eurozone’s predicament as a case of "stagflation," a challenging scenario for central bankers.
"The economy started shrinking while the PMI price components went up for the second month in a row," he noted. Inflation pressures remain high, driven largely by the services sector, and the weaker Euro adds to concerns about rising import costs in the coming months.
ECB finds itself in a precarious position ahead of its December 12 policy meeting. While the sluggish economy could benefit from monetary easing, inflationary pressures, exacerbated by substantial wage growth in Q3, limit its room to maneuver.
De la Rubia expects ECB to avoid aggressive action, likely opting for a cautious 25bps rate cut.
Australia’s Q3 GDP expands 0.3% qoq, marking continued economic slowdown
Australia’s GDP grew by 0.3% qoq in Q3, falling short of expectations for a 0.5% qoq expansion, while annual growth reached 0.8% yoy. However, GDP per capita declined by -0.3% qoq, marking the seventh consecutive quarter of contraction.
Katherine Keenan, head of national accounts at the Australian Bureau of Statistics, remarked that “the Australian economy grew for the twelfth quarter in a row, but has continued to slow since September 2023.”
Public sector spending was the key driver of growth during the quarter, with government consumption and public investment making significant contributions.
Japan’s PMI services shows renewed growth, composite activity marginally improves
Japan’s services sector returned to growth in November, with PMI Services index finalized at 50.5, up from 49.7 in October. Composite PMI, which combines manufacturing and services activity, edged up to 50.1 from 49.6, signaling a modest overall improvement in private-sector activity.
Usamah Bhatti, Economist at S&P Global Market Intelligence, noted that the services sector experienced a "renewed upswing" as improved demand and stronger client confidence supported output and sustained new business growth. The sector’s near-term outlook appears favorable, with growth in outstanding business reaching its highest level in eight months, and optimism about the 12-month outlook remaining robust.
While the services sector drove the overall stabilization, the manufacturing sector continued to lag, with a slight contraction in production. Input cost pressures persisted across industries, contributing to higher prices for goods and services. However, businesses expressed optimism that inflationary and global uncertainties would subside, paving the way for a stronger rebound in Japan’s private sector.
China's Caixin PMI services falls to 51.5, manufacturing boosts composite index to 52.3
China’s Caixin PMI Services dropped to 51.5 in November from 52.0, missing market expectations of 52.5, reflecting a slowdown in the sector’s expansion. However, PMI Composite rose to 52.3 from 51.9, supported by improvements in manufacturing.
Wang Zhe, Senior Economist at Caixin Insight Group, highlighted the challenges facing the economy. He noted that while the downturn appears to be "bottoming out," the recovery requires "further consolidation." Persistent contraction in employment underscores that the impact of economic stimulus has yet to translate into labor market gains, with businesses hesitant to expand their workforce.
Wang also stressed the importance of monitoring the "consistency and effectiveness" of additional stimulus measures. The economy continues to face "structural and cyclical pressures," compounded by the risk of "continued accumulation of external uncertainties," necessitating "sufficient policy buffers."
USD/JPY Mid-Day Outlook
Daily Pivots: (S1) 148.75; (P) 149.49; (R1) 150.34; More...
Intraday bias in USD/JPY remains neutral for the moment. On the downside, break of 148.64 temporary low will strength the case that rise from 139.57 has already completed at 156.754. Deeper fall should then be seen to 61.8% retracement of 139.57 to 156.74 at 146.12 next. Nevertheless, firm break of 151.94 resistance will revive near term bullishness and bring retest of 156.74 high.
In the bigger picture, price actions from 161.94 are seen as a corrective pattern to rise from 102.58 (2021 low). The range of medium term consolidation should be set between 38.2% retracement of 102.58 to 161.94 at 139.26 and 161.94. Nevertheless, sustained break of 139.26 would open up deeper medium term decline to 61.8% retracement at 125.25.
ECB’s Lagarde highlights Eurozone growth risks and trade vulnerabilities
Speaking at the European Parliament's Committee on Economic and Monetary Affairs, ECB President Christine Lagarde flagged "weaker" short-term growth prospects for the Eurozone, citing slowdown in services and persistent contraction in manufacturing. Despite this, she projected a gradual recovery in consumer spending and investment as monetary tightening effects fade and real incomes improve.
Lagarde cautioned, however, that the medium-term economic outlook remains fraught with uncertainties, particularly due to elevated "geopolitical risks" and potential "trade barriers." She emphasized that Eurozone's deep integration into global supply chains leaves it "vulnerable to foreign shocks," posing challenges to manufacturing and investment.
On inflation, Lagarde noted an expected temporary rise in Q4 as earlier declines in energy prices fade from annual comparisons. Beyond that, inflation is anticipated to decline toward ECB's target next year.
Reiterating ECB's data-driven approach, Lagarde stated, "We will review our stance again next week, following our data-dependent and meeting-by-meeting approach. We are therefore not pre-committing to a particular rate path."