
Sample Category Title
Fed’s Daly: No urgency as Fed calibrate policy carefully
San Francisco Fed President Mary Daly emphasized a measured approach to interest rate adjustments during a PBS News Hour interview.
She noted there’s "no sense of urgency" to lower rates quickly but highlighted the need to "carefully calibrate our policy" to align with current and expected economic conditions.
Daly added that policymakers will deliberate on the best path forward at the upcoming December 17–18 FOMC meeting.
Despite signs of economic resilience, she stressed that "there's a lot more work for us to do" to achieve the 2% inflation target while supporting durable economic growth. Inflation remains the top challenge for many Americans.
Gold Stabilizes at $2,650: Eyes on the Next Move
Key Highlights
- Gold started a fresh increase above the $2,600 support.
- A connecting bullish trend line is forming with support at $2,630 on the 4-hour chart.
- Oil prices are struggling to recover above the $70.50 resistance.
- EUR/USD is consolidating losses near the 1.0520 level.
Gold Price Technical Analysis
Gold prices remained well-bid near the $2,600 zone against the US Dollar. The price formed a base and started a fresh increase above $2,620 and $2,640.
The 4-hour chart of XAU/USD indicates that the price struggled to clear the $2,665 level and corrected some gains. The price declined below the 50% Fib retracement level of the upward move from the $2,536 swing low to the $2,721 high.
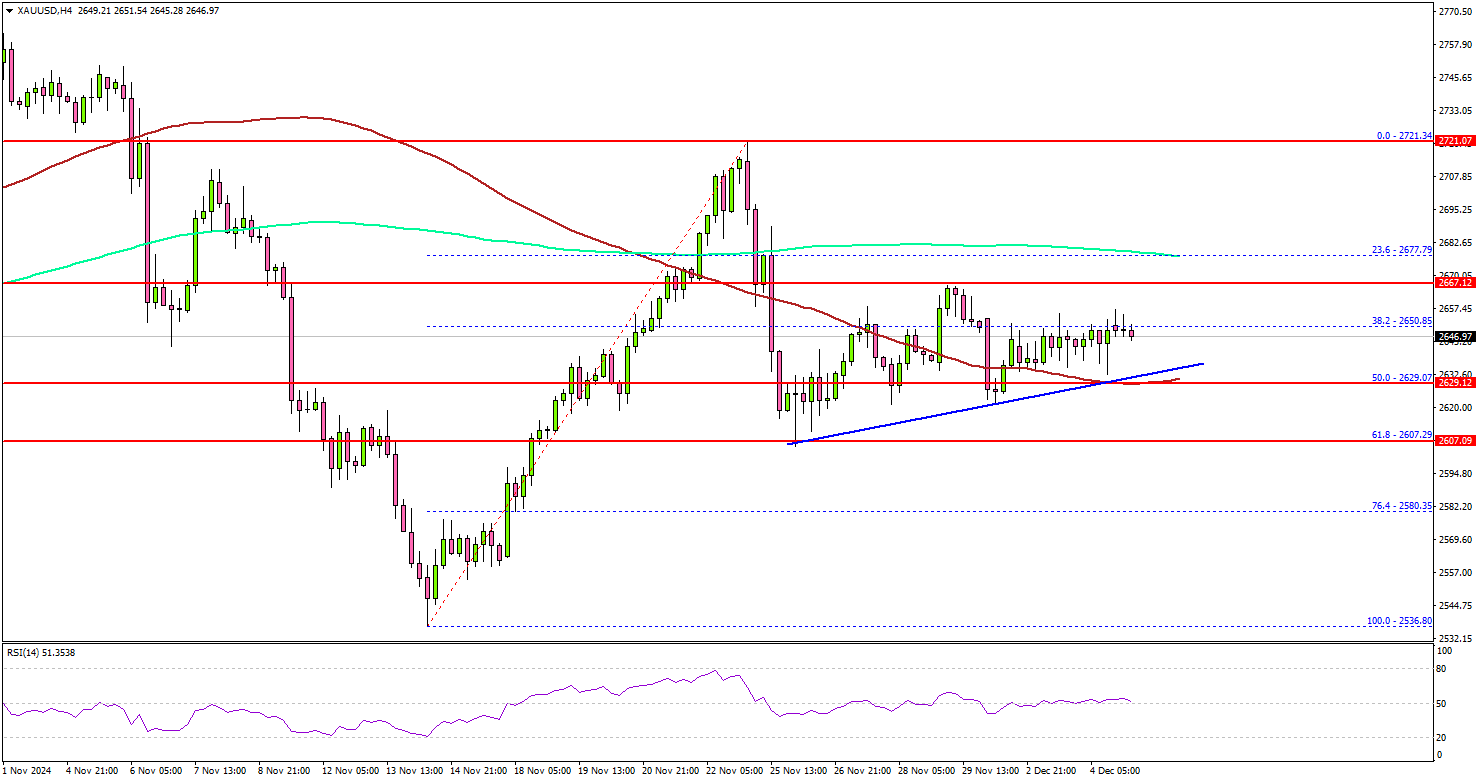
The price is now trading above the 100 Simple Moving Average (red, 4 hours), but is below the 200 Simple Moving Average (green, 4 hours).
On the upside, immediate resistance is near the $2,665 level. The first major resistance sits near the $2,680 level. A clear move above the $2,680 resistance could open the doors for more upsides.
The next major resistance could be $2,700, above which the price could rally toward the $2,720 level. On the downside, initial support is near the $2,635. The first major support is near the $2,630 level. There is also a connecting bullish trend line forming with support at $2,630.
The main support is now $2,605. A downside break below the $2,605 support might call for more downsides. The next major support is near the $2,565 level.
Looking at EUR/USD, the pair started a short-term recovery wave above the 1.0480 level but upsides might be limited above 1.0550.
Economic Releases to Watch Today
- US Initial Jobless Claims - Forecast 215K, versus 213K previous.
Elliott Wave View in Silver (XAGUSD) Favors the Metal Going Higher
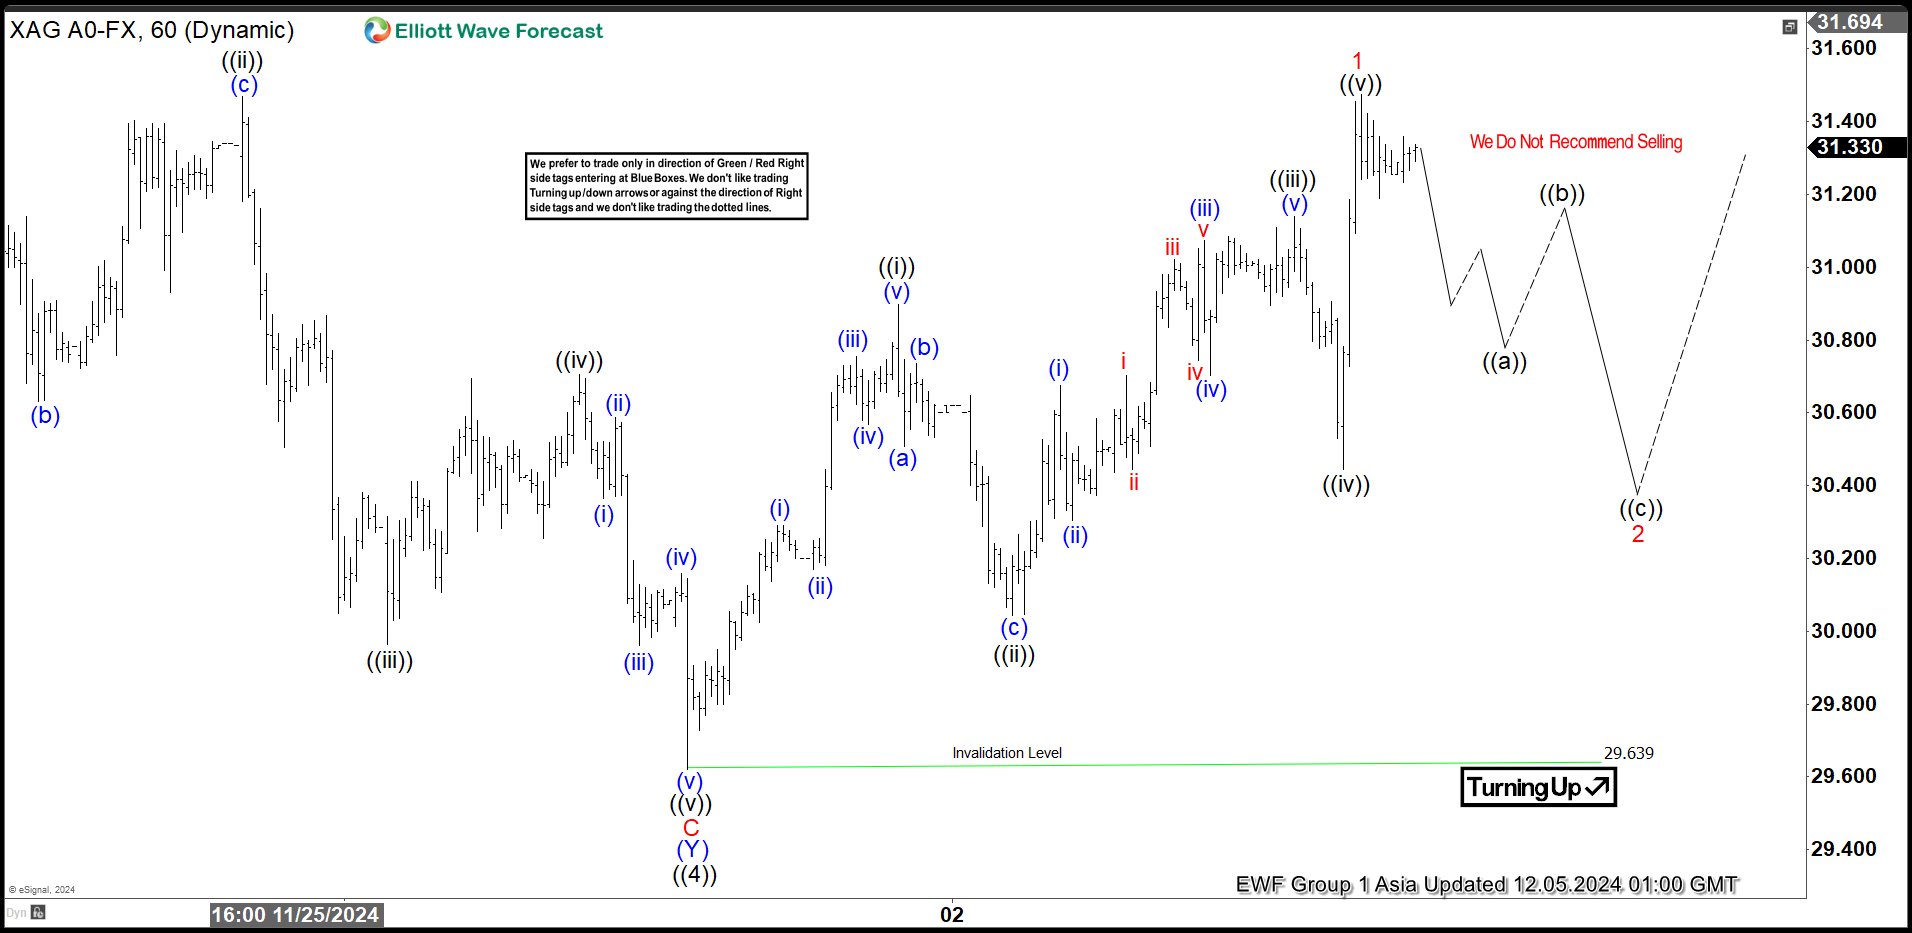
Short Term Elliott Wave in Silver (XAGUSD) shows that the metal ended wave ((4)) at 29.63. The metal has turned higher in wave ((5)). The structure of the rally is unfolding as a 5 waves Elliott Wave impulse structure. Up from wave ((4)) low on 11.28.2024, wave (i) ended at 30.29 and wave (ii) dips ended at 30.17. Wave (iii) higher ended at 30.75 and pullback in wave (iv) ended at 30.56. Final leg wave (v) higher ended at 30.89. This completed wave ((i)) in higher degree. Pullback in wave ((ii)) ended at 30.04 with internal subdivision as a zigzag. Down from wave ((i)), wave (a) ended at 30.5 and wave (b) ended at 30.73. Wave (c) lower ended at 30.04 which completed wave ((ii)).
The metal has resumed higher in wave ((iii)). Up from wave ((ii)), wave (i) ended at 30.67 and wave (ii) pullback ended at 30.3. Wave (iii) higher ended at 31.07 and pullback in wave (iv) ended at 30.7. Final leg wave (v) ended at 31.13 which completed wave ((iii)). Pullback in wave ((iv)) ended at 30.44 and final wave ((v)) higher ended at 31.47. This should complete wave 1 in higher degree. Pullback in wave 2 is now in progress to correct cycle from 11.28.2024 low in 3, 7, 11 swing before the metal resumes higher again.
Silver (XAGUSD) 60 Minutes Elliott Wave Chart
XAGUSD Elliott Wave Video
https://www.youtube.com/watch?v=BImWT-qfkNM
S&P 500 Wave Analysis
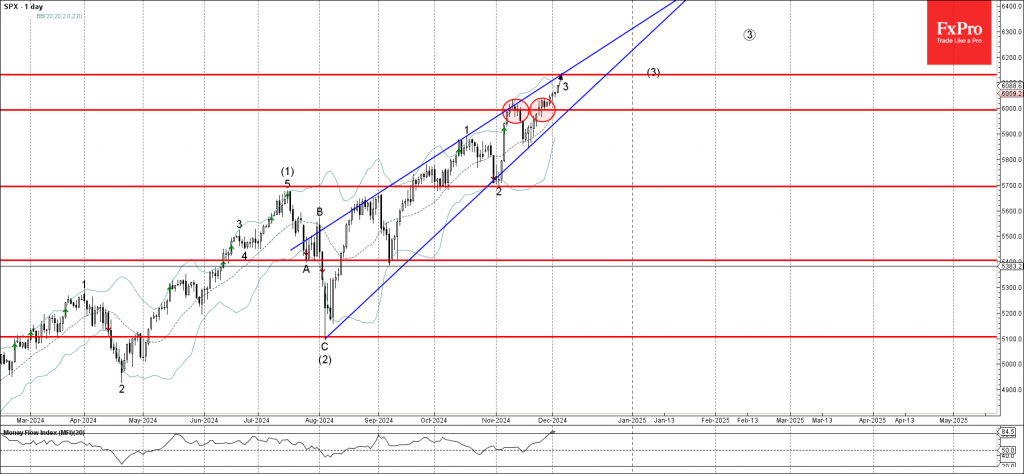
- S&P 500 broke round resistance level 6000.00
- Likely to rise to resistance level 6130.00
S&P 500 index continues to rise steadily after breaking the round resistance level 6000.00, which stopped the earlier upward impulse wave at the start of November.
The breakout of the resistance level 6000.00 accelerated the active minor impulse wave 3 of the intermediate impulse wave (3) from August.
Given the strong daily uptrend, S&P 500 index can be expected to rise in the active extended daily Wedge toward the next resistance level 6130.00, target price for the completion of the active impulse wave 3.
Silver Wave Analysis
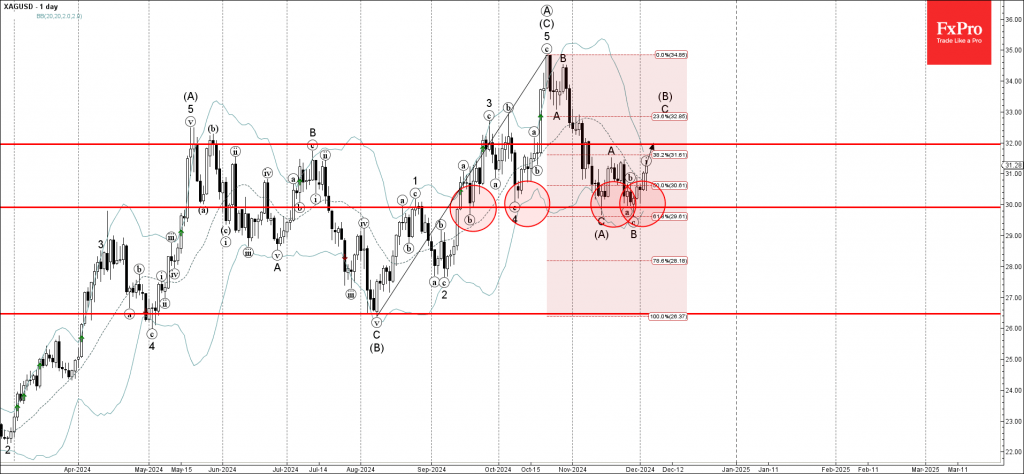
- Silver reversed from round support level 30.00
- Likely to rise to resistance level 32.00
Silver recently reversed up from the round support level 30.00, which has stopped all previous downward corrections from September.
The support level 30.00 was strengthened by the lower daily Bollinger Band and by the 61.8% Fibonacci correction of the sharp upward impulse from August.
Given the clear daily uptrend, Silver can be expected to rise further to the next resistance level 32.00, former top of the minor correction from the start of November.
Fed’s Powell: Economy stronger than expected, allows cautious rate cuts
Fed Chair Jerome Powell expressed optimism about the US economy during an event overnight, stating it is in "very good shape" with "no reason for that not to continue." He highlighted reduced downside risks in the labor market, stronger-than-expected growth, and inflation running slightly higher than previously anticipated.
Given these developments, Powell suggested the Fed could "afford to be a little more cautious" in its approach to cutting interest rates as it works toward a neutral policy stance.
Reflecting on Fed's 50bos cut in September, Powell noted it was intended as "a strong signal" of support for a potentially weakening labor market. However, subsequent data revisions revealed that the economy was "even stronger than we thought".
Fed’s Musalem signals potential pause in rate cuts
Speaking at an event today, St. Louis Fed President Alberto Musalem emphasized the importance of maintaining "policy optionality" as the central bank assesses the evolving economic environment.
He noted that the "time may be approaching to consider slowing the pace of interest rate reductions, or pausing" altogether to evaluate incoming data and the economic outlook more carefully.
BUT, Musalem refrained from committing to a specific timeline, saying, “It might be December, it might be January. Could be later.”
He highlighted the significance of upcoming economic reports, including inflation, retail sales, and the crucial November jobs data due on Friday, in shaping his stance ahead of the Fed’s next policy decision.
“I’m going to wait until I see that data, until I can be assured in which way I’m leaning,” he stated.
Will Nonfarm Payrolls Determine Dollar’s Fate?
- Dollar elevated even as Fed leaning towards December cut
- Investors still see strong chance for a January pause
- Strong jobs numbers could add fuel to dollar’s engines
- The data comes out on Friday at 13:30 GMT
Investors are still expecting a Fed pause in January
The US dollar recharged this week, confirming the notion that last week’s pullback may have been the result of traders realizing some profits on their long positions ahead of the Thanksgiving break.
Although some Fed officials appeared to be favoring another rate cut in December, market participants continued to believe that the Fed may need to take the sidelines at the turn of the year, assigning a stronger chance of that happening in January. According to Fed funds futures, there is a 60% chance for a pause at the first FOMC gathering of 2025.

After threatening Canada, Mexico and China with hefty tariffs, US President-elect Donald Trump warned that he will impose 100% tariffs on BRICS nations if they were to move away from the dollar and create their own currency. Trump’s tariff pledges and his promises for massive corporate tax cuts are seen as inflationary policies, which alongside the better-than-expected data out of the US have allowed investors to continue speculating on a slow rate-cut process by the Fed. And that is the case even though several policymakers, including the usual hawk Neel Kashkari, are inclined to push the cut button in December.
Jobs growth seen rebounding strongly
This week, Friday’s employment data may attract special attention, especially following the very weak 12k jobs gain in October. Although the low print was attributed to labor strikes and hurricanes, a strong rebound may be needed for investors to remain confident on the dollar uptrend.
The forecasts suggest that the economy has gained 202k jobs in November, but the unemployment rate is expected to have increased to 4.2% from 4.1%. Nonetheless, that’s not necessarily a bad thing if it is accompanied by a rising participation rate, as it could be a sign of more unemployed people entering the labor force and being encouraged to actively start looking for a job. Average hourly earnings are expected to have slowed but only fractionally, to 3.9% y/y from 4.0%, which means that inflation could remain somewhat sticky in the months to come.
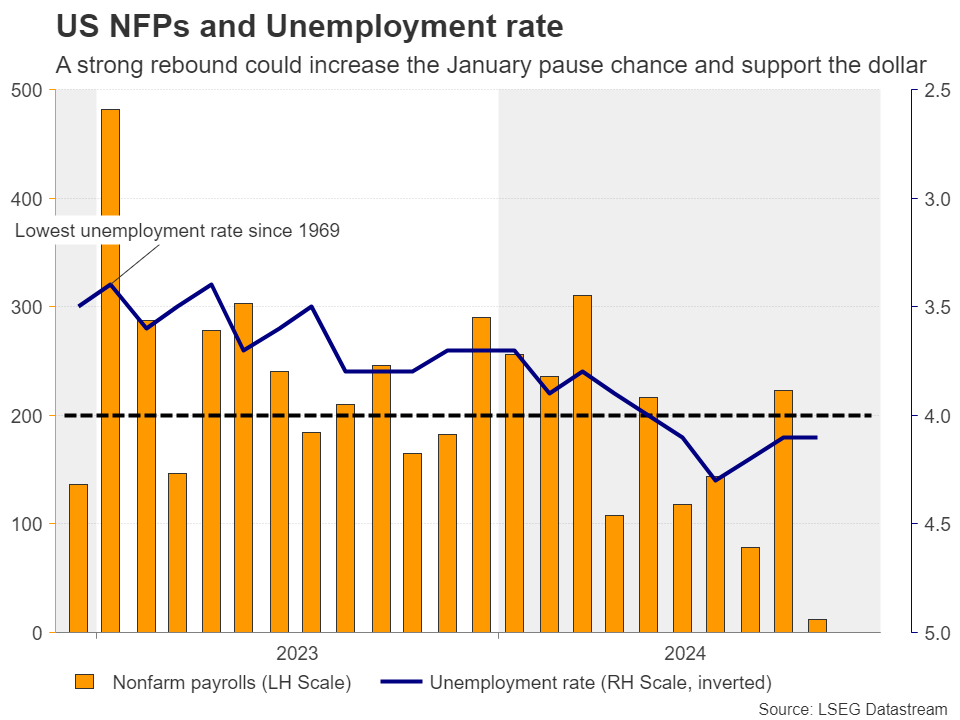
Such numbers are likely to encourage investors to add to their bets about a potential pause at the turn of the year, and even increase the probability of the Fed remaining sidelined at both the December and January gatherings. That probability currently rests at a respectful 23%.
Euro/dollar may be poised to drift further south
With the euro feeling the heat of the uncertainty surrounding French politics, euro/dollar may be vulnerable to drift further south if the US data add more fuel to the dollar’s engines.
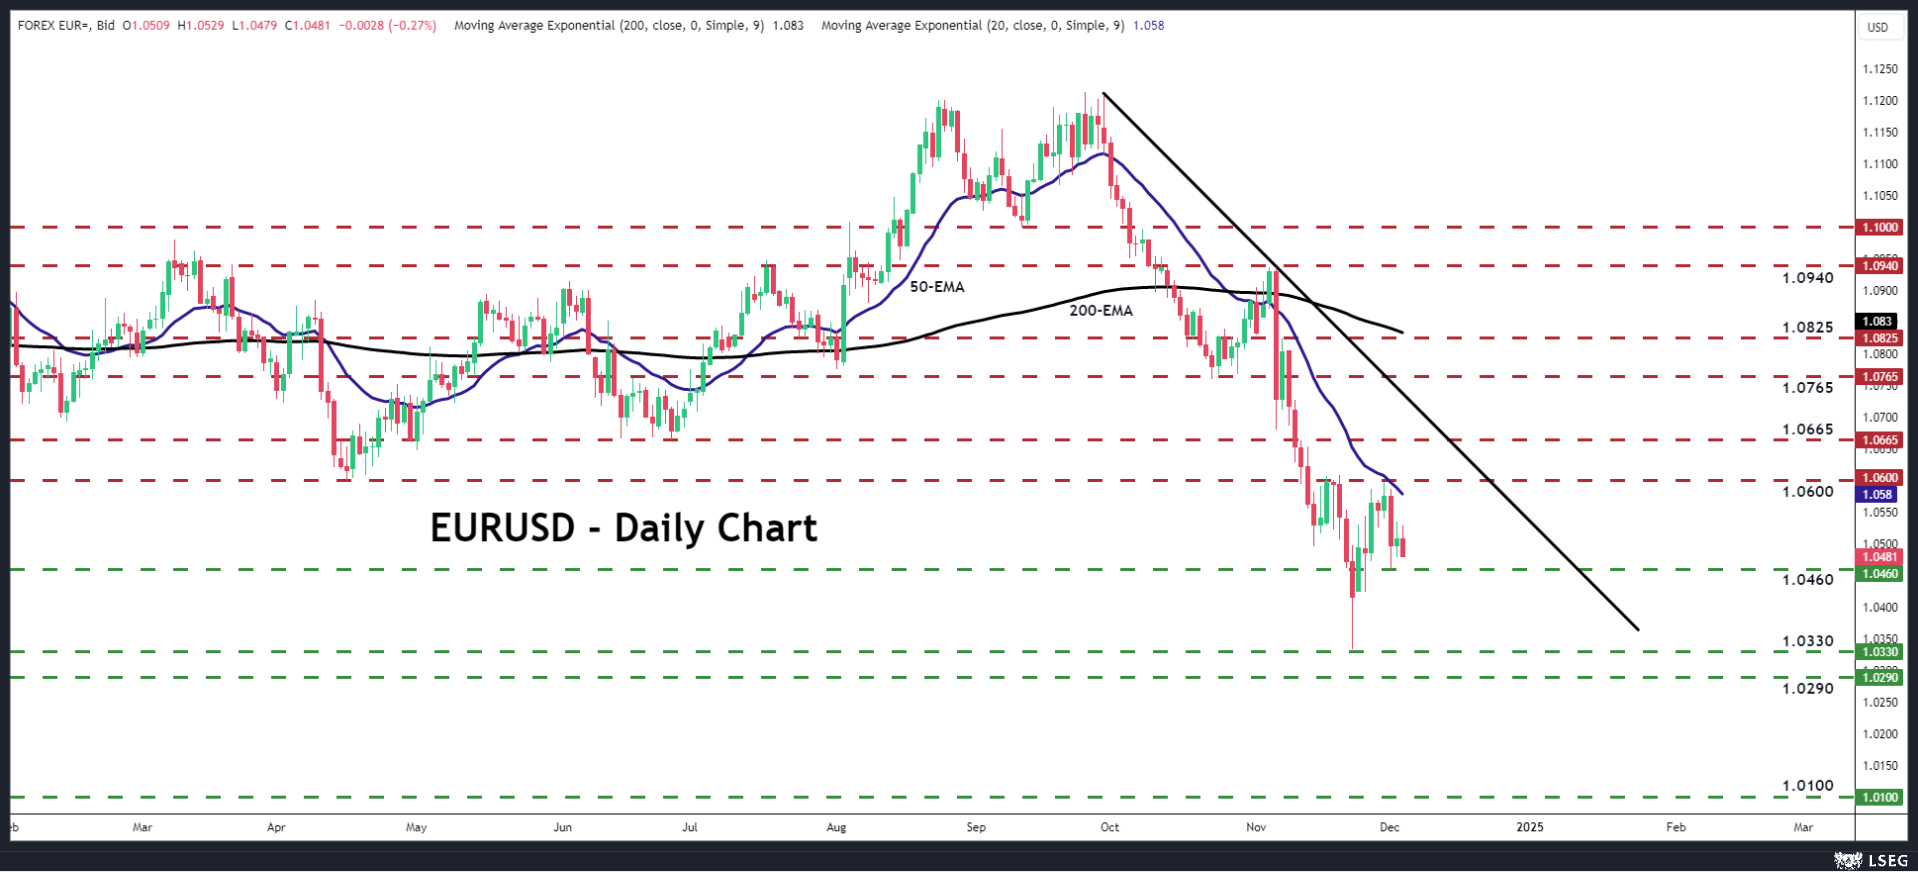
The bears may feel confident to take the action down to the low of November 22 at 1.0330, or towards the 1.0290 barrier, marked by the low of November 21, 2022. If they are not willing to stop there, a break lower could carry larger bearish implications, paving the way towards the inside swing high of November 11, 2022, at around 1.0100.
For the outlook to start looking brighter, a rebound above the key pivot area of 1.0665 may be needed. Such a move could encourage advances towards the 1.0765 zone, marked by the inside swing lows of October 23 and 29, the break of which could trigger extensions towards the high of November 7 at 1.0825.
ADP Reaffirms Picture of a Healthy US Labour Market
The most important publication in the coming weeks will be Friday’s US employment report. Ahead of that, we are turning our attention to other labour market indicators. Wednesday’s ADP private sector employment report is the closest we have to a data release, although it has given many false signals in recent months.
The data released was slightly weaker than forecast, with an increase of 146K versus the expected 152K. This level of forecast accuracy is quite rare for such statistics. These figures reflect a relatively healthy development in employment but should be taken with a degree of caution. A month earlier, employment growth was reported at 233K, but today, these figures were revised down to 184K. The official Bureau of Labor Statistics showed a decline of 28K in November. The huge discrepancy and the impressive revision downgrade in today’s release still form a positive backdrop, as the cumulative totals for the last three months (+163K/month) show an acceleration from the previous three months.
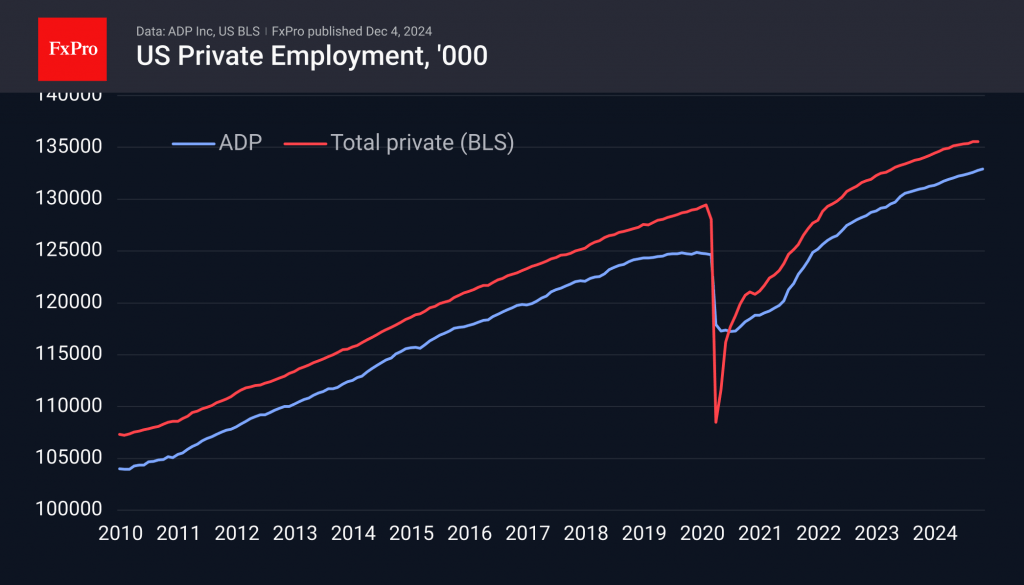
The only cause for concern is the 26K drop in industrial employment, which was the only sector to show negative momentum last month. This is in line with a similar trend in the official BLS data in recent months.
Among other data, we also look at the job vacancy rate, where the latest October data was the highest in three months. An even more important indicator was the manufacturing ISM, which rose from 46.5 to 48.4, indicating a less severe contraction than before.
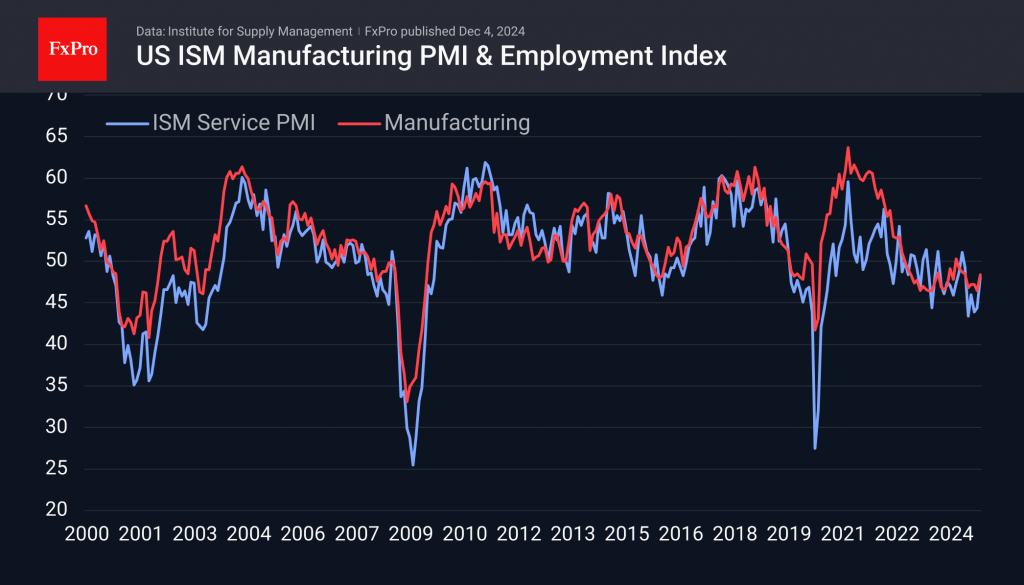
All these data support the view that the US economy remains on a growth path. They allay fears of a new wave of inflation, allowing the Fed to cut rates further without fear of overheating the market. At the same time, this is a fairly strong set of data, leaving the potential for further buying in the equity market. Of course, this all assumes that the new incoming data (Trump administration initiatives and the employment and inflation report) remain within current expectations.