Sample Category Title
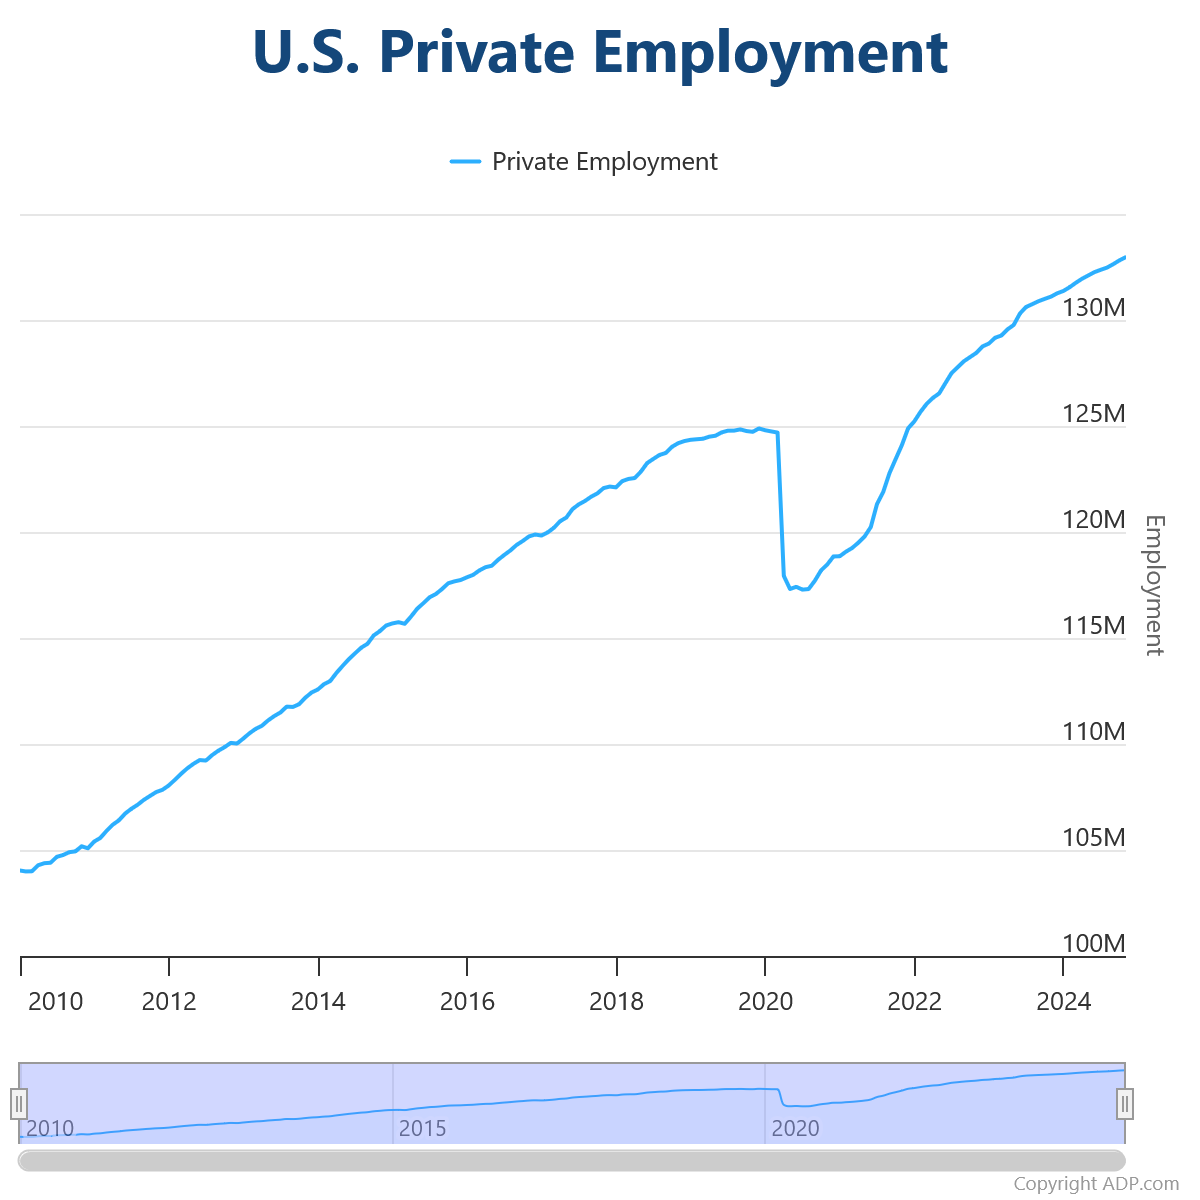
US ADP employment rises 146k in Nov, pay gains accelerate slightly
US ADP report showed private employment increasing by 146k in November, missing market expectations of 165k. The growth was concentrated in service-providing sectors, which added 140k jobs, while goods-producing sectors saw a modest rise of 6k.
By establishment size, large companies led the way with 120k new jobs, while medium-sized firms added 42k. Small businesses, however, reported a loss of -17k jobs.
Pay gains saw an uptick for the first time in over two years. Job-stayers’ pay growth edged up to 4.8% yoy, while job-changers experienced a more robust 7.2% yoy increase.
ADP’s Chief Economist, Nela Richardson, highlighted the mixed industry performance, stating, “Manufacturing was the weakest we've seen since spring. Financial services and leisure and hospitality were also soft.” The data underscores a healthy but uneven labor market, with certain sectors and business sizes faring better than others.
Euro Shrugs After Eurozone Services PMI Contracts
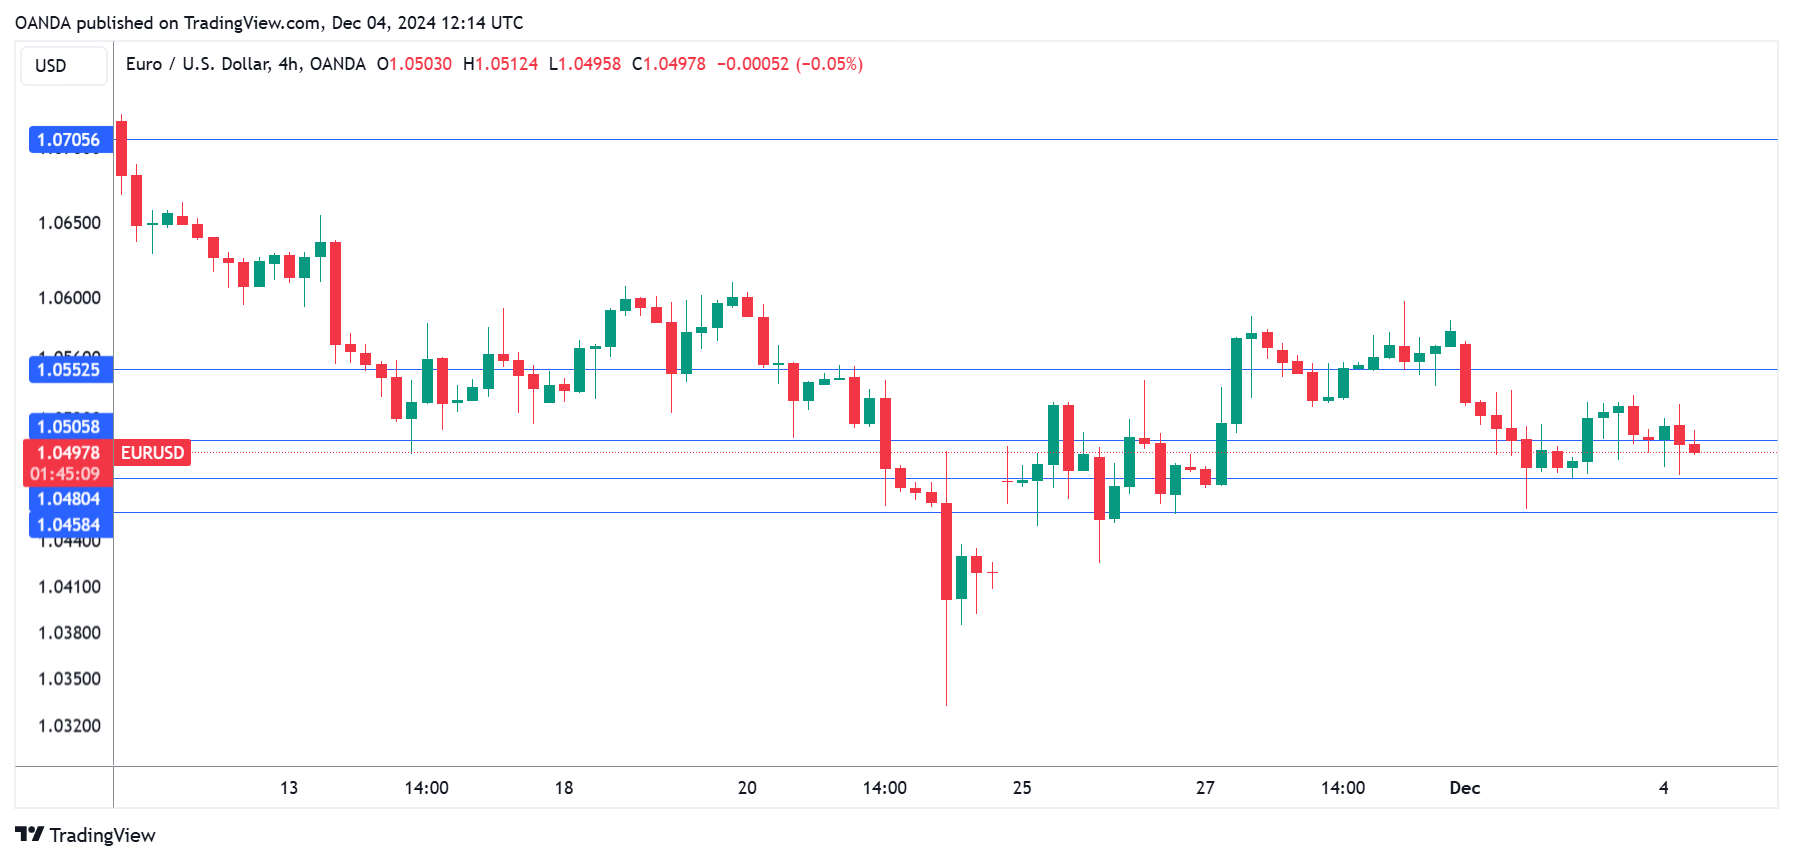
The euro is almost unchanged on Wednesday. In the European session, EUR/USD is trading at 1.0506, up 0.02% at the time of writing.
Eurozone Services PMI falls into contraction in November
The monthly eurozone Services PMI reports can be viewed as report cards for business activity and the news wasn’t good in November. The Eurozone Services PMI was revised upwards to 49.5 from 49.2 in the preliminary estimate but was lower than the October reading of 51.6. This marked the first contraction in services since January (the 50 line separates contraction from expansion). The decline in services is especially troubling since Germany, France and Italy, the three largest economies in the eurozone, all weakened in November and contracted.
The weak services PMIs came on the heels of soft manufacturing PMIs, which pointed to deep contraction in the eurozone and in the top three economies in the bloc. The economic outlook is bleak and the European Central Bank is expected to cut rates at every meeting at least through June 2025 in order to kick-start the shaky eurozone economy. ECB President Lagarde will testify before a European Parliament committee later on Wednesday and the markets will be looking for some insights on future rate policy.
The ECB meets on Dec. 12 and the market has priced in a 25-basis point cut. Could policymakers surprise the market with a jumbo 50-bp cut, as in September? An oversized cut is possible but unlikely. ECB Governing Council member Robert Holzmann said in a newspaper interview published on Wednesday that it was “conceivable” that the ECB will cut by 25 bp next week but “not more”. Holzmann added that the rate decision would be determined based on the latest data.
EUR/USD Technical
- EUR/USD has pushed above resistance lines at 1.0505 and 1.0552 and faces resistance at 1.0552
- The next support levels are 1.0480 and 1.0458
Aussie Tumbles to 4-Month Low After Soft GDP
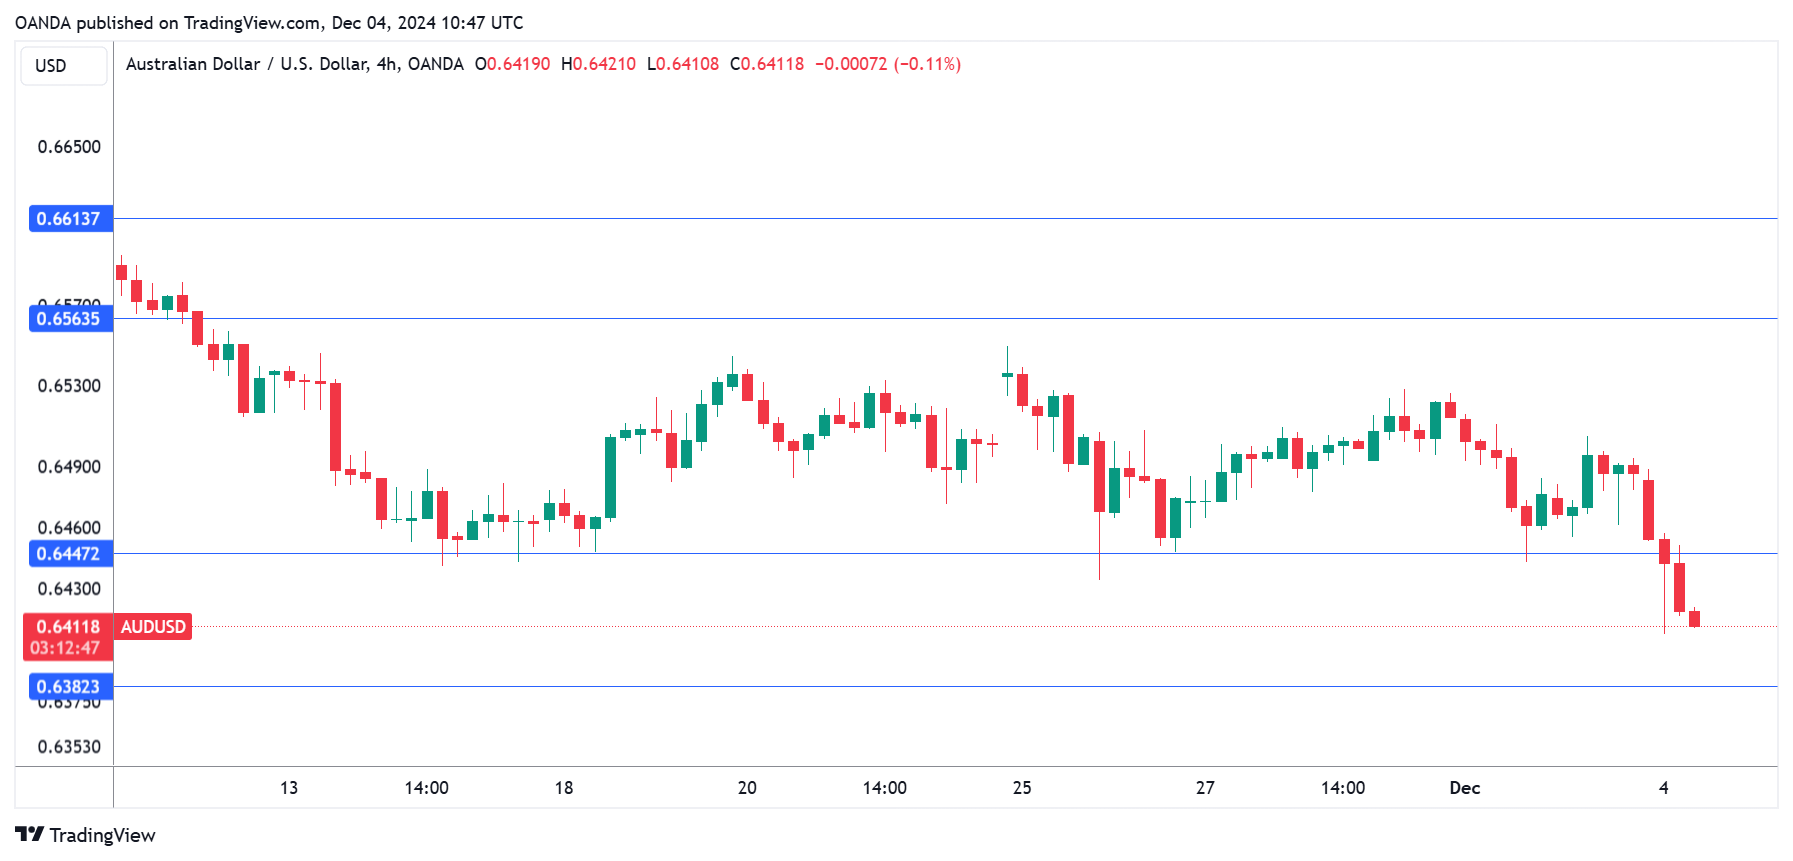
The Australian dollar has taken a tumble on Wednesday. In the European session, AUD/USD is trading at 0.6416, down 1.1% on the day at the time of writing. Earlier, the Australian dollar dropped as low as 0.6407, its lowest level since August 5.
Australia’s GDP misses expectations
Australia’s GDP report was a disappointment, falling short of expectations. GDP rose 0.3% q/q in the third quarter, following three straight quarters of 0.2% growth. This missed the market estimate of 0.5%. Annually, GDP rose 0.8%, below the Q2 gain of 1% and shy of the market estimate of 1.1%.
A key reason why GDP growth has been weak is soft household consumption. Consumers have been battered by high interest rates and stubborn inflation, and private domestic demand was negligible in the second and third quarters.
The soft GDP report was a bust with the markets and sent the Australian dollar tumbling lower. The report is unlikely to cause any changes from the Reserve Bank of Australia, which has been in a prolonged “higher for longer” stance. The RBA has managed to bring headline inflation within the target of 2%-3%, but remains concerned about underlying inflation, which rose to 3.5% in October.
The RBA makes its next rate announcement on Dec. 10 and is widely expected to maintain the cash rate at 4.35%, where it has been for over a year. The markets aren’t expecting a rate cut before May 2025, although a surprise decline in inflation in the coming months could push the central bank to lower rates in Q1 2025.
AUD/USD Technical
- AUD/USD has pushed below support at 0.6447. Below, there is support at 0.6382
- 0.6563 and 0.6613 are the next resistance lines
AUDCAD: GDP Data Influences Price
The US Dollar (USD) lost momentum on Tuesday, reversing some of Monday's gains and moving closer to key support levels around 106.00, as measured by the Dollar Index (DXY). Meanwhile, the Australian Dollar (AUD) bounced back slightly, recovering some earlier losses, although it remained below the 0.6500 mark during sideways trading.
Rising export prices for key commodities like copper and iron ore supported the Aussie's recovery despite ongoing concerns about China's struggling economy and the effectiveness of its stimulus measures. While Australia benefits from strong commodity exports, uncertainties about China's economic slowdown remain challenging, as the two economies are closely linked.
The Reserve Bank of Australia (RBA) has kept interest rates steady at 4.35%, prioritizing inflation control while being cautious about the country's slowing economic growth. RBA Governor Michele Bullock emphasized that monetary policy will stay tight until inflation consistently cools. While inflation improved in October, the RBA clarified that one good report doesn't signal a trend, and rate cuts still need to be on the horizon.
The Australian Dollar could gain if the US Federal Reserve starts cutting rates, but challenges like global inflation and a strong US Dollar persist. Despite concerns, Australia's labor market remained stable in October, with unemployment at 4.1% and 16,000 new jobs added. Experts predict the RBA might consider rate cuts in mid-2025, but only if inflation continues to decline steadily.
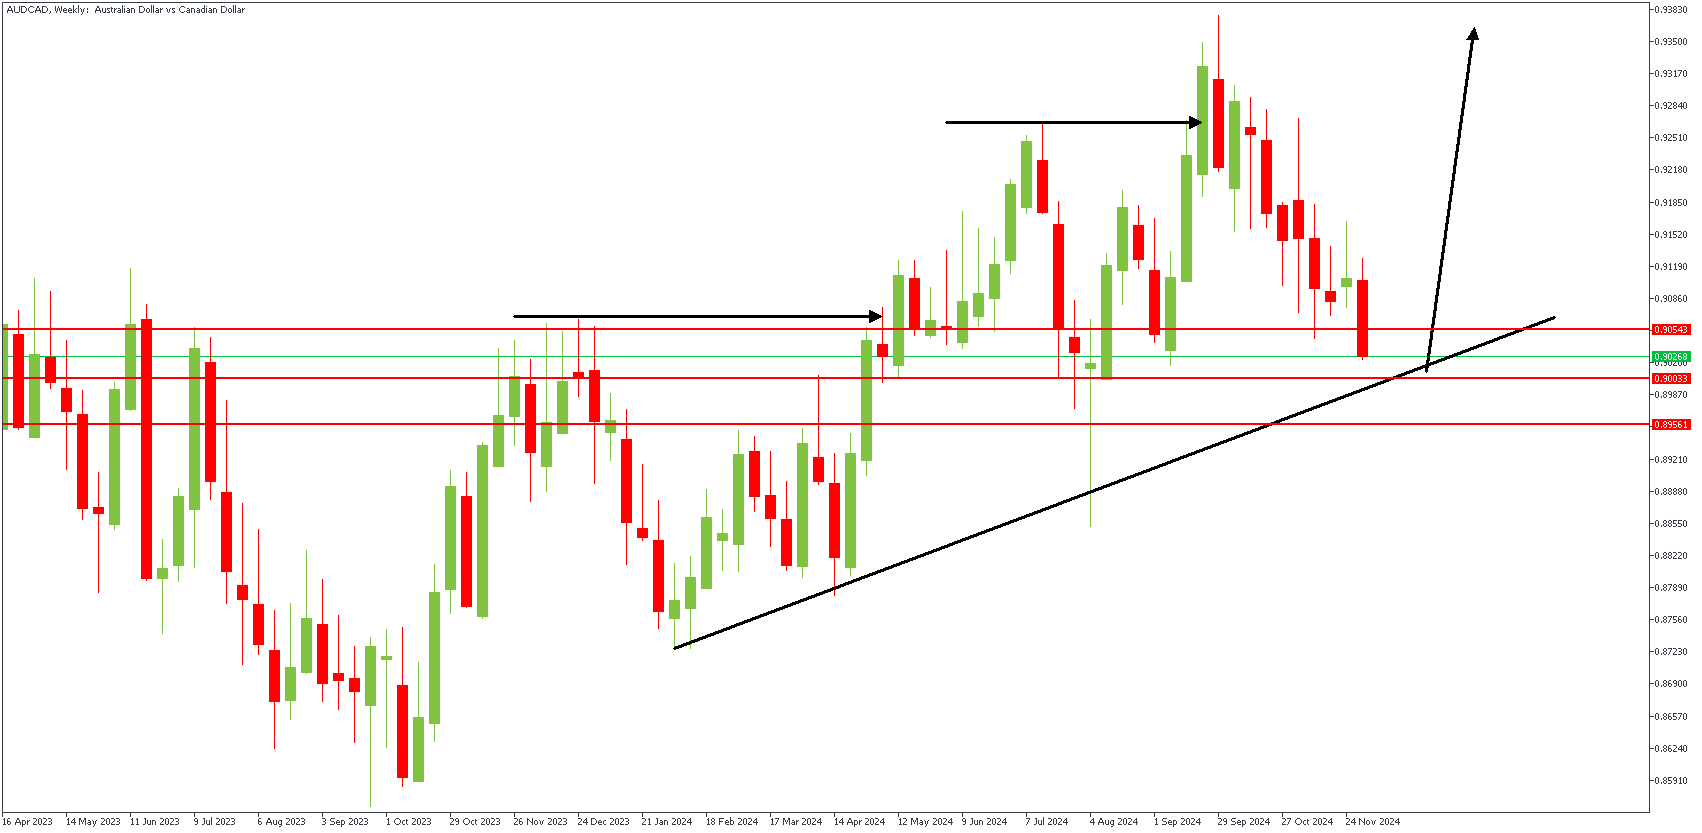
AUDCAD – W1 Timeframe
The most recent break of structure, highlighted on AUDCAD's weekly timeframe chart, is bullish. The price is currently approaching the weekly timeframe pivot region and trendline support. Now, we can check the daily timeframe for more clues.
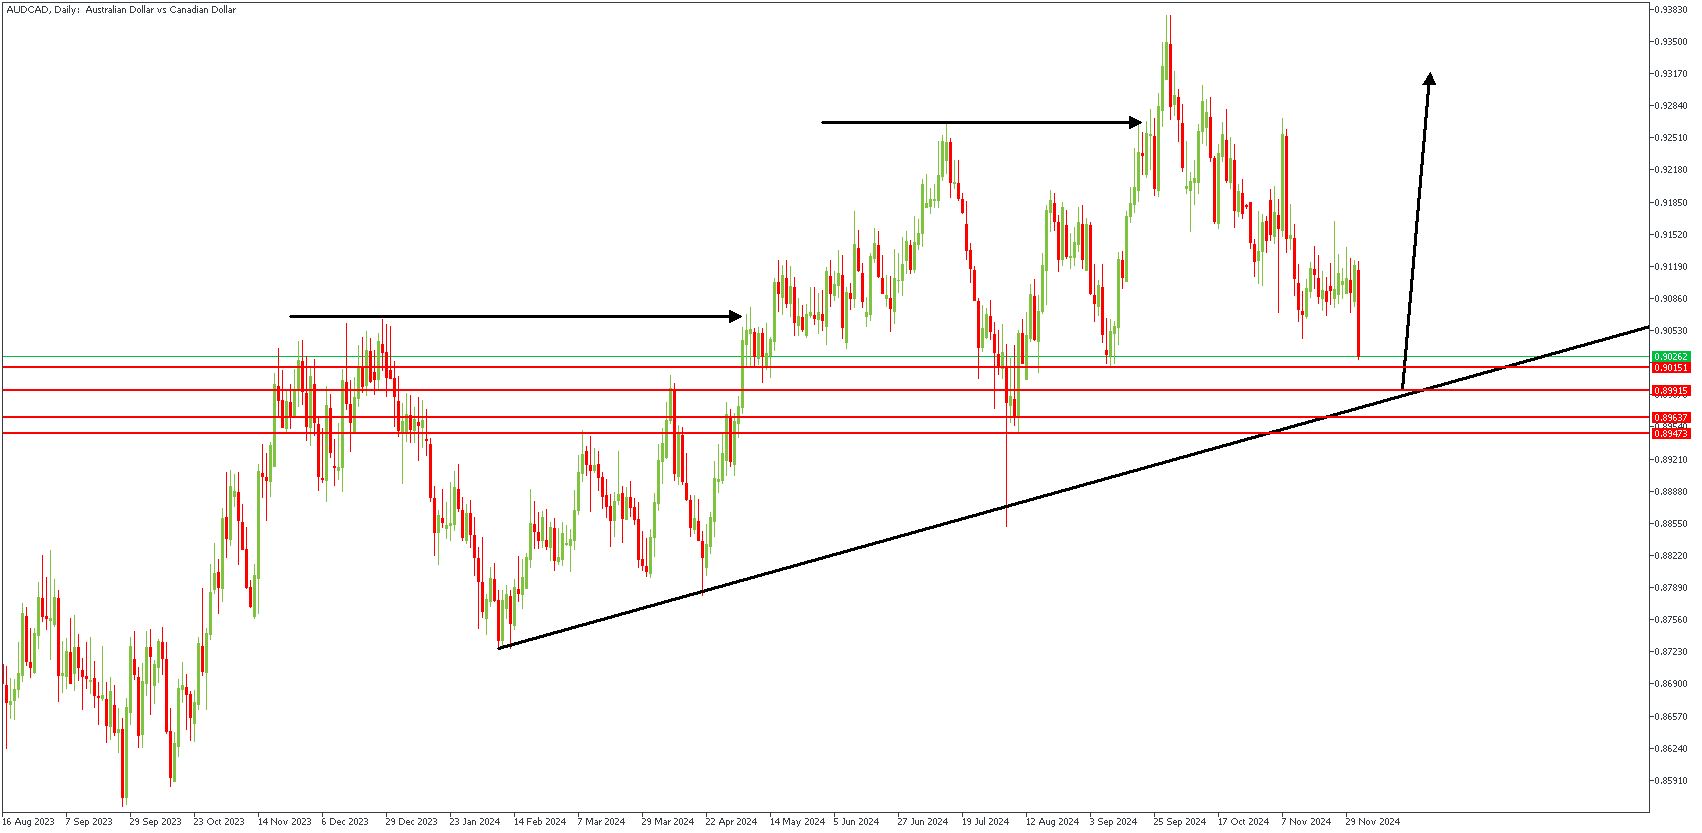
D1 Timeframe
The daily timeframe does not present much new information aside from showing the demand zone for the anticipated price reaction a bit clearer. The long-wicked pin bar candle is the demand zone, which can be further streamlined using the 88% Fibonacci retracement level as a critical reversal point.
Analyst's Expectations:
- Direction: Bullish
- Target: 0.93037
- Invalidation: 0.88682
New Altcoin Leaders Emerge as Bitcoin Stalls Below $100K
Market Picture
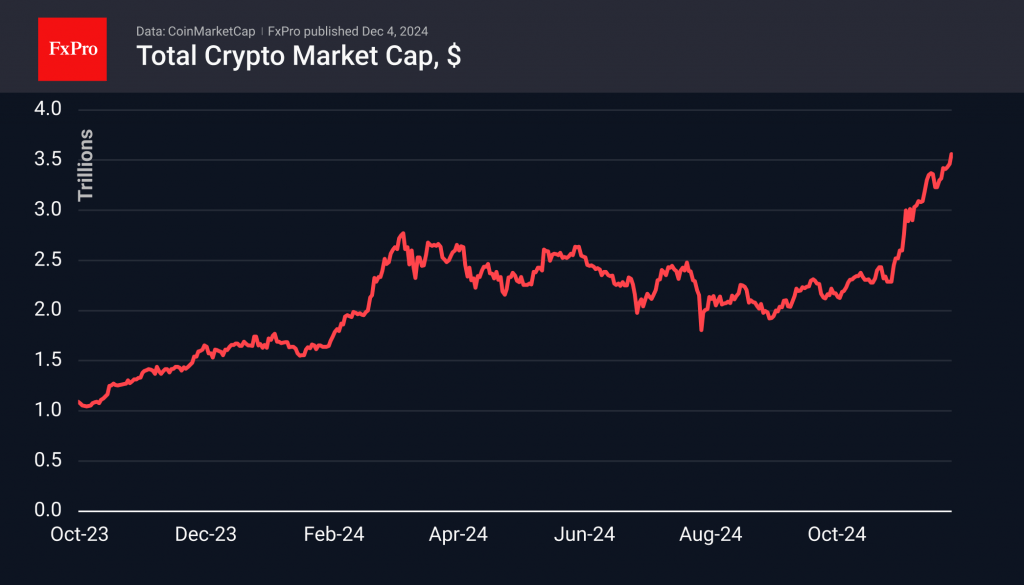
The crypto market has grown by 2.6% in the last 24 hours, reaching a new record of $3.56 trillion. Altcoins are still driving the growth, but this time, the momentum comes from different players. Among the top performers over the past day were Tron (+67%) and BNB (+18%). The Altcoin Season Index reached 89 amid a near doubling of altcoin capitalisation over the past month, four times faster than Bitcoin’s gains.
The first cryptocurrency is up 1.4% in 24 hours, hovering just below $97,000. On Tuesday, events in South Korea caused a brief dip to $93K, which attracted additional buying. Bitcoin’s rise seems like a logical trend amid political uncertainty in rich countries, including France and Germany. Technically, bitcoin remains in a consolidation mode as the price sits in the $92-100K range.
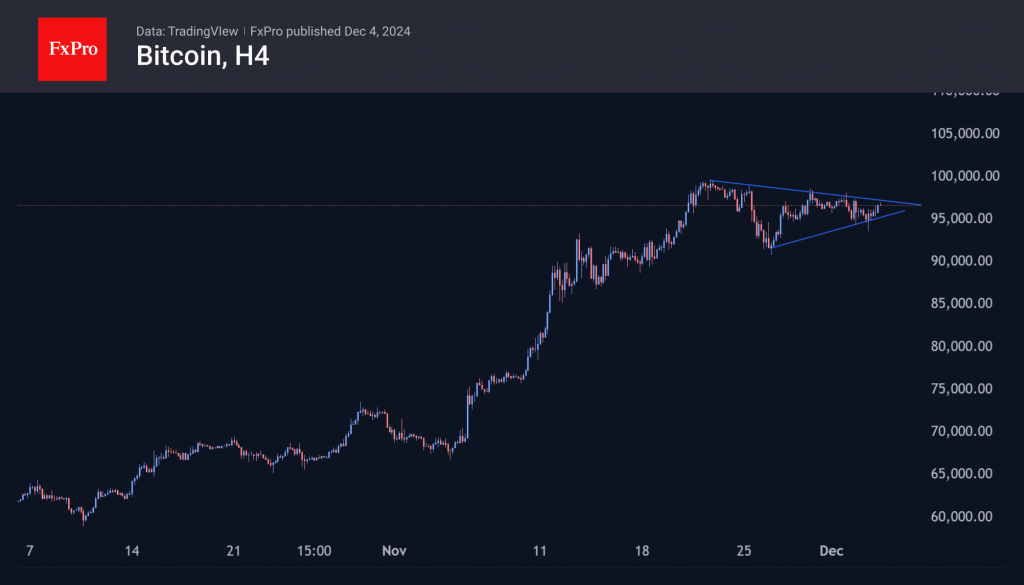
On Tuesday, Tron soared. A dramatic acceleration of growth occurred with the renewal of historical highs at $0.23. Liquidation of short positions brought the price closer to $0.45 before stabilising at $0.39. A continuation of the bull run makes $0.60 the next potential target.

News Background
Another recalculation showed that the first cryptocurrency’s mining difficulty increased by 1.59%, reaching a high of 103.9 T. The average hash rate for the period since the last value change was 832.7 EH/s.
BTC growth will be volatile due to the profit taken by holders and BTC ETF dynamics. At the end of last week, clients withdrew $457 million from Bitcoin funds, while long-term investors reduced their balances by 508,990 BTC.
According to Bitfinex, the number of coins held by speculators approached a cyclical high of 3,282,000 BTC. The number of coins held by long-term investors fell to 12.45 million BTC, the lowest since July 2022, IntoTheBlock calculated.
Arkham Intelligence noted that US authorities sent 10,000 BTC (~$963 million) related to Silk Road to Coinbase. QCP Capital attributes the current bitcoin correction to these reports.
BoE’s Bailey reiterates gradual approach to rate cuts
In an interview with the Financial Times, BoE Governor Andrew Bailey acknowledged that while inflation had recently dropped to target levels, there remains “a distance to travel” in managing price stability. He noted that inflation might temporarily exceed target levels again ahead.
Bailey addressed market expectations for four rate cuts next year, emphasizing that BoE's projections are "conditioned on market rates" and highlighting the word "gradual" in their approach.
On the impact of Donald Trump’s return to the White House and the associated rise in tariffs, Bailey described the effects as "not straightforward at all."
He explained that such policies could move traded prices but are also contingent on reactions from other countries and exchange rate adjustments, adding further uncertainty to the inflation outlook.
EURAUD Surges Higher
- EURAUD trades aggressively higher today
- The upleg has paused at two key SMAs
- Momentum indicators are mostly bullish
EURAUD is recording a sizeable upleg today following the weak Australian GDP print for the third quarter of 2024 that somewhat opened the door to an RBA cut in early 2025. The rally has paused at the 100- and 200-day simple moving averages (SMAs), with euro bulls recovering a good chunk of their recent losses in fewer than 10 sessions. The overall trend remains negative though, supported by the political shenanigans in the eurozone.
Meanwhile, the momentum indicators are mostly bullish. The RSI has climbed once again above its midpoint, and it appears eager for a move higher. More importantly, the stochastic oscillator is edging higher, towards its overbought territory, and building a good gap from its moving average. Only the Average Directional Movement Index (ADX) is ignoring the currently bullish move, as it continues to point to a trendless market.
Should the bulls remain thirsty, they could try to push EURAUD above the 100- and 200-day SMAs and towards the 23.6% Fibonacci retracement level of the August 26, 2022 – April 26, 2023 uptrend at 1.6406. If successful, the door could then be wide open to retest the August 24, 2015 high at 1.6583.
On the other hand, the bears are probably keen on retaking market control. Their first task is probably to keep EURAUD below the 1.6363-1.6375 area, and then gradually push it lower towards the 1.6256-1.6250 region. It would be a strong win for the bears if they managed to quickly erase today’s price action, giving them the opportunity to stage a new selloff towards 1.6000.
To sum up, EURAUD is trading higher today, but the bulls need to overcome some key resistance levels for the current rally to have legs.
Australian Dollar Hits Four-Month Low Amid Weak GDP Data
The Australian dollar fell to a four-month low of 0.6450 against the US dollar on Wednesday, following disappointing GDP data that heightened expectations for potential interest rate cuts by the Reserve Bank of Australia (RBA).
The latest GDP figures revealed that Australia’s economy expanded by only 0.3% quarter-over-quarter in Q3, falling short of the anticipated 0.4% growth. Year-on-year, the growth rate was just 0.8%, significantly below the expected 1.0%. These figures have raised concerns on trading floors about the possible onset of a recession.
Despite the weak GDP report, expectations for the RBA’s upcoming December meeting remain unchanged. The consensus is that the central bank will hold rates steady while continuing to assess economic conditions. However, market sentiment regarding the medium-term monetary policy has shifted slightly, with a 30% likelihood of an RBA rate cut by February. Investors are increasingly betting on the possibility of adjustments by May.
Externally, the Australian dollar is facing additional pressure from a stronger US dollar, which continues to attract investors seeking safe-haven assets amid global economic uncertainties.
Technical analysis of AUD/USD
H4 chart: the AUD/USD pair has reached the target of its recent decline at 0.6490 and is now forming a growth structure towards 0.6480. A broad consolidation range may develop around this level. If the price breaks above this range, a rise to 0.6555 is anticipated. This bullish scenario is supported by the MACD indicator, with its signal line below zero but poised for an upward movement.
H1 chart: the market has nearly reached the primary target of the decline at 0.6490 and is expected to initiate a growth structure to 0.6485. A narrow consolidation range may form, and a breakout above this range could lead to an ascent towards 0.6555, followed by a potential retracement to 0.6480. Once this level is reached, another upward wave towards 0.6700 may be possible. The Stochastic oscillator supports this analysis, with its signal line currently below 20 but expected to climb sharply towards 80, indicating potential for upward momentum.
Eurozone PPI rises 0.4% mom in Oct led by rising energy costs
Eurozone PPI increased by 0.4% mom in October, aligning with market expectations. On an annual basis, PPI fell by -3.2% yoy, the anticipated -3.3% decline, reflecting mixed dynamics across sectors.
In Eurozone, Energy prices surged by 1.4% mom, driving the monthly increase, while intermediate goods prices slipped by -0.1% mom. Capital goods prices were unchanged, while durable consumer goods rose by 0.3% mom and non-durable consumer goods by 0.2% mom.
Across the EU, PPI also rose by 0.4% mom, while the annual figure showed a decline of -3.0% yoy. Among Member States, Estonia and Italy led the monthly increases with a 1.0% rise, followed by France (+0.9%) and Sweden (+0.8%). Conversely, Bulgaria experienced the sharpest decline at -2.9%, followed by Slovakia (-2.0%) and Romania (-1.5%).
UK PMI services finalized at 50.8, growth stalls amid rising costs and gloomy outlook
UK services sector showed signs of slowing in November, with final PMI Services reading dropping to 50.8 from October’s 52.0, marking the weakest level in 13 months. Composite PMI similarly declined to 50.5 from 51.8, barely holding above the threshold for expansion.
Tim Moore, Economics Director at S&P Global Market Intelligence, remarked that service providers saw activity "close to stalling". Businesses faced weaker sales pipelines, postponed projects, and heightened caution among clients, all of which curtailed growth.
Additionally, the anticipation of higher employer National Insurance contributions weighed on hiring decisions, with workforce numbers shrinking for the second consecutive month. Many firms cited margin pressures as a reason for not replacing departing staff.
Inflationary pressures intensified, with salary costs driving input price increases at the fastest pace since April. This, coupled with worries about policies outlined in the Autumn Budget, led to a "considerable reduction" in business optimism.