
Sample Category Title
AUD/USD and NZD/USD Under Pressure, Downtrend Persists
AUD/USD declined below the 0.6500 and 0.6455 support levels. NZD/USD is also moving lower and might struggle to recover above 0.5900.
Important Takeaways for AUD/USD and NZD/USD Analysis Today
- The Aussie Dollar started a fresh decline from well above the 0.6500 level against the US Dollar.
- There is a connecting bearish trend line forming with resistance at 0.6465 on the hourly chart of AUD/USD at FXOpen.
- NZD/USD declined steadily from the 0.5930 resistance zone.
- There was a break below a short-term contracting triangle with support at 0.5865 on the hourly chart of NZD/USD at FXOpen.
AUD/USD Technical Analysis
On the hourly chart of AUD/USD at FXOpen, the pair struggled to clear the 0.6530 zone. The Aussie Dollar started a fresh decline below the 0.6500 support against the US Dollar.
The pair even settled below 0.6455 and the 50-hour simple moving average. There was a clear move below 0.6430. A low was formed at 0.6407 and the pair is now consolidating losses. On the upside, an immediate resistance is near the 0.6430 level.
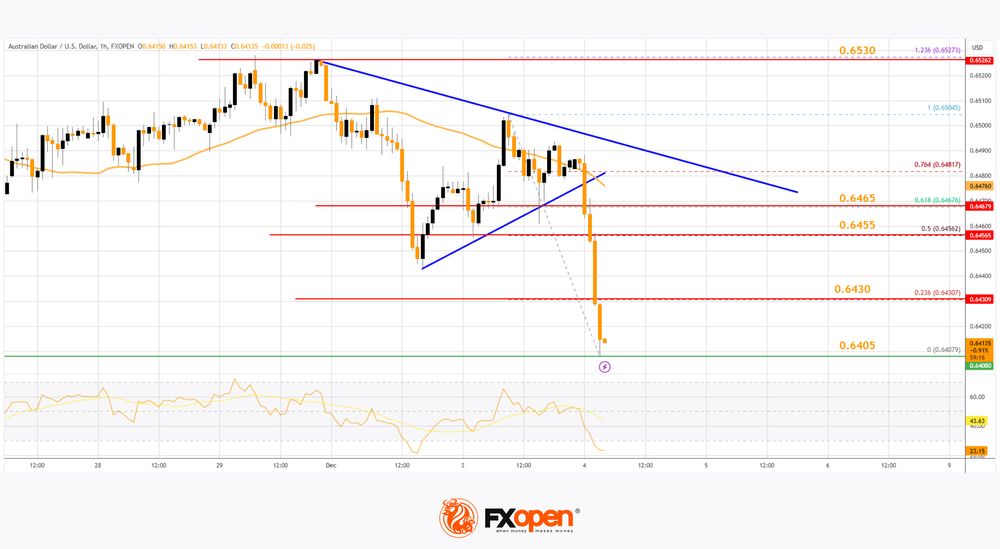
The 23.6% Fib retracement level of the downward move from the 0.6504 swing high to the 0.6407 low is also near 0.6430. The next major resistance is near a connecting bearish trend line at 0.6465.
The trend line is near the 61.8% Fib retracement level of the downward move from the 0.6504 swing high to the 0.6407 low, above which the price could rise toward 0.6500.
Any more gains might send the pair toward the 0.6530 resistance. A close above the 0.6530 level could start another steady increase in the near term. The next major resistance on the AUD/USD chart could be 0.6620.
On the downside, initial support is near the 0.6405 zone. The next support sits at 0.6380. If there is a downside break below 0.6380, the pair could extend its decline. The next support could be 0.6350. Any more losses might send the pair toward the 0.6320 support.
NZD/USD Technical Analysis
On the hourly chart of NZD/USD on FXOpen, the pair also followed a similar pattern and declined from the 0.5930 zone. The New Zealand Dollar gained bearish momentum and traded below 0.5900 against the US Dollar.
The pair settled below the 0.5880 level and the 50-hour simple moving average. Besides, there was a break below a short-term contracting triangle with support at 0.5865.
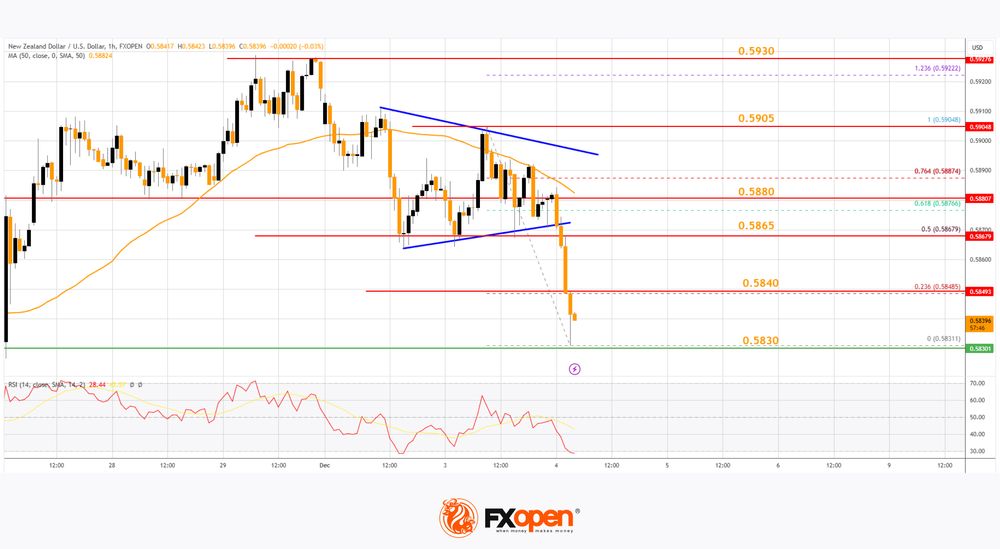
Finally, it tested the 0.5830 zone and is currently consolidating losses. Immediate resistance on the upside is near the 23.6% Fib retracement level of the downward move from the 0.5904 swing high to the 0.5831 low at 0.5840.
The next resistance is the 0.5865 level or the 50% Fib retracement level of the downward move from the 0.5904 swing high to the 0.5831 low. If there is a move above 0.5865, the pair could rise toward 0.5905.
Any more gains might open the doors for a move toward the 0.5930 resistance zone in the coming days. On the downside, immediate support on the NZD/USD chart is near the 0.5830 level.
The next major support is near the 0.5800 zone. If there is a downside break below 0.5800, the pair could extend its decline toward the 0.5765 level. The next key support is near 0.5740.
Trade over 50 forex markets 24 hours a day with FXOpen. Take advantage of low commissions, deep liquidity, and spreads from 0.0 pips. Open your FXOpen account now or learn more about trading forex with FXOpen.
This article represents the opinion of the Companies operating under the FXOpen brand only. It is not to be construed as an offer, solicitation, or recommendation with respect to products and services provided by the Companies operating under the FXOpen brand, nor is it to be considered financial advice.
EUR/USD Daily Outlook
Daily Pivots: (S1) 1.0482; (P) 1.0508; (R1) 1.0536; More...
EUR/USD is staying in sideway trading and intraday bias remains neutral. Outlook stays bearish with 1.0609 resistance intact. On the downside, break of 1.0330 will resume the fall from 1.1213. Also, sustained trading below 1.0404 key fibonacci level will carry larger bearish implication. Nevertheless, firm break of 1.0609 will turn bias back to the upside for 1.0760 support turned resistance first.

In the bigger picture, immediate focus is now on 50% retracement of 0.9534 (2022 low) to 1.1274 at 1.0404. Strong rebound from this level will keep price actions from 1.1273 (2023 high) as a medium term consolidation pattern only. However, sustained break of 1.0404 will raise the chance that whole up trend from 0.9534 has reversed. That would pave the way to 61.8% retracement at 1.0199 first. Firm break there will target 0.9534 low again.

USD/CHF Daily Outlook
Daily Pivots: (S1) 0.8833; (P) 0.8861; (R1) 0.8892; More…
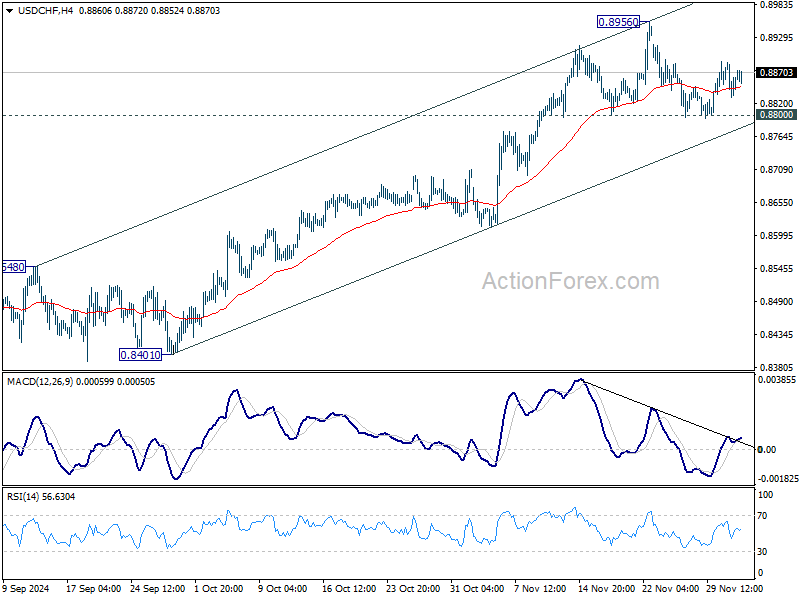
USD/CHF is still bounded in sideway trading and intraday bias remains neutral. With 0.8800 support intact, further rally is still in favor. On the upside, break of 0.8956 will resume the rally from 0.8374, and target 0.9223 key resistance next. However, firm break of 0.8800 will confirm short term topping and turn bias back to the downside for 55 D EMA (now at 0.8736).
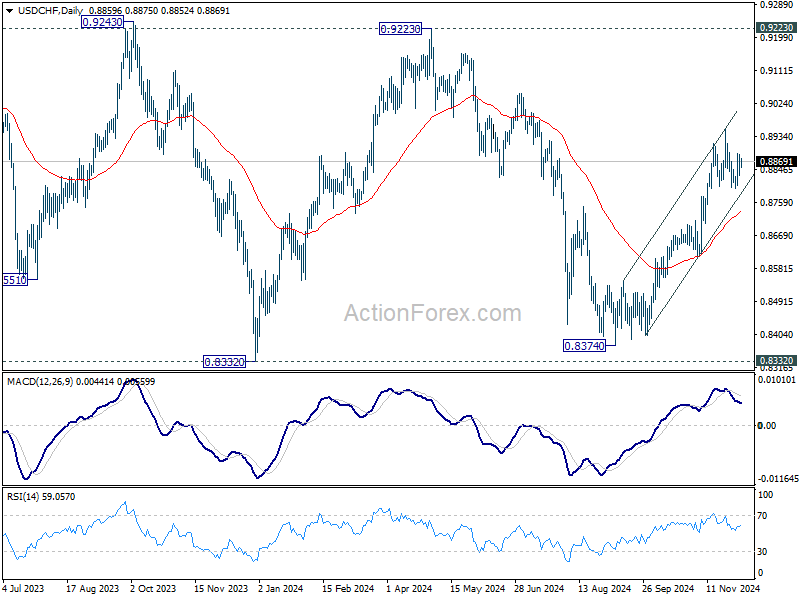
In the bigger picture, price actions from 0.8332 (2023 low) are currently seen as a medium term corrective pattern. Rise from 0.8374 is seen as the third leg. Overall outlook will continue to stay bearish as long as 0.9223 resistance holds. Break of 0.8332 low is in favor at a later stage when the consolidation completes.
GBP/USD Daily Outlook
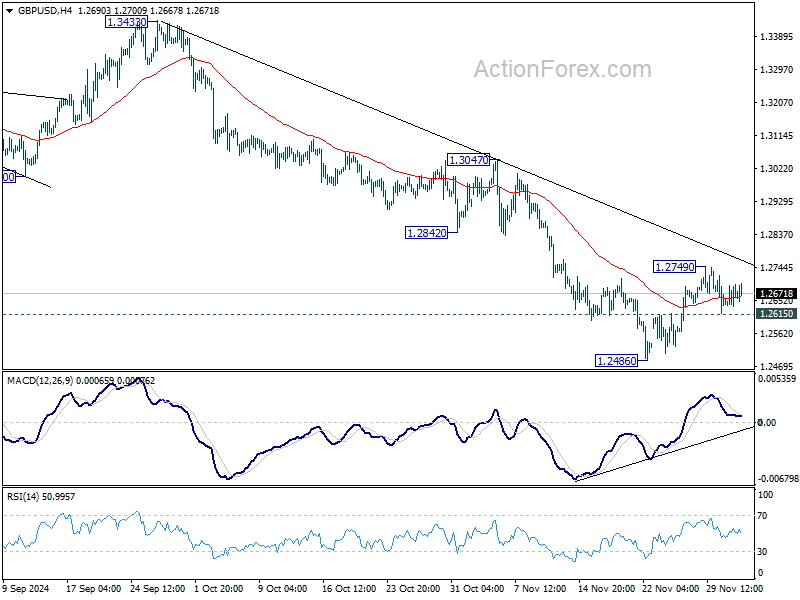
Daily Pivots: (S1) 1.2639; (P) 1.2670; (R1) 1.2702; More...
No change in GBP/USD's outlook and intraday bias stays neutral. While another rise cannot be ruled out, outlook will stay bearish as long as 55 D EMA (now at 1.2858) holds. Below 1.2615 minor support will turn intraday bias back to the downside for retesting 1.2486. Break there will resume whole fall from 1.3433.
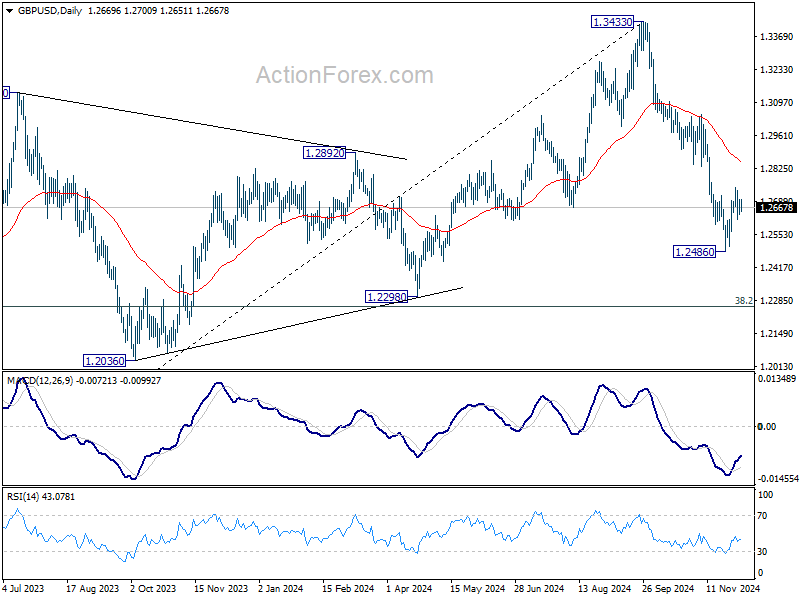
In the bigger picture, a medium term top should be in place at 1.3433, and price actions from there are correcting whole up trend from 1.0351 (2022 low). Deeper decline is now expected as long as 55 D EMA (now at 1.2867) holds, to 38.2% retracement of 1.0351 to 1.3433 at 1.2256, which is close to 1.2298 structural support. Strong support should be seen there to bring rebound.
USD/JPY Daily Outlook
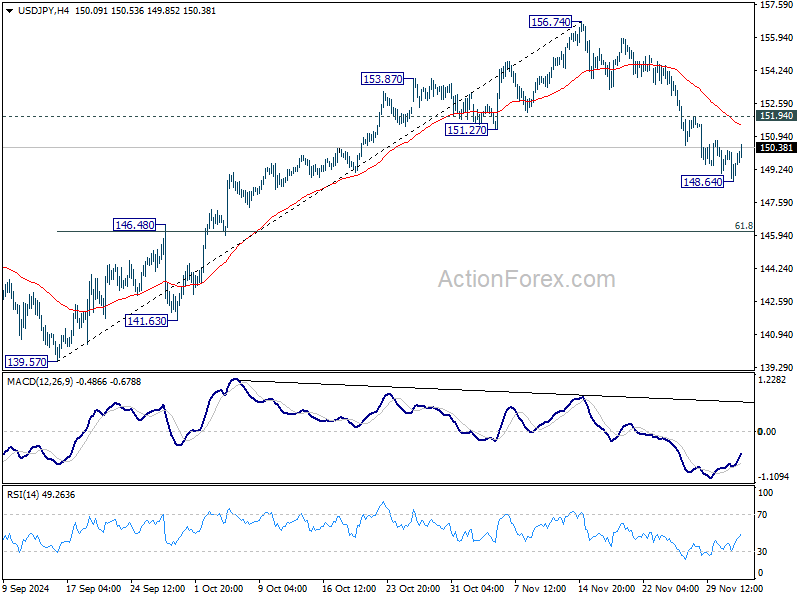
Daily Pivots: (S1) 148.75; (P) 149.49; (R1) 150.34; More...
USD/JPY recovered after brief dip to 148.64 and intraday bias is turned neutral first. Further decline is expected as long as 151.94 resistance holds. Current development suggests that whole rise from 139.57 could have finished at 156.74 already. Below 148.64 will target 61.8% retracement of 139.57 to 156.74 at 146.12 next. Nevertheless, firm break of 151.94 will revive near term bullishness and bring retest of 156.74 high.
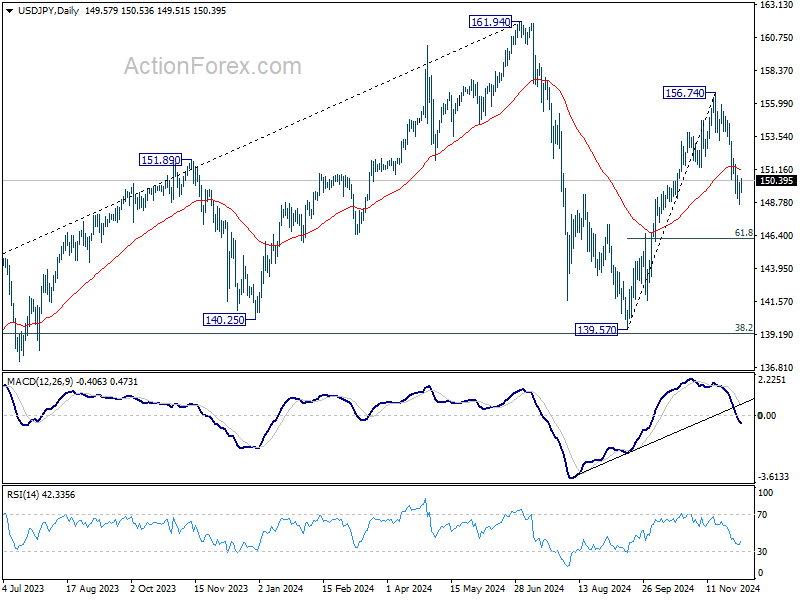
In the bigger picture, price actions from 161.94 are seen as a corrective pattern to rise from 102.58 (2021 low). The range of medium term consolidation should be set between 38.2% retracement of 102.58 to 161.94 at 139.26 and 161.94. Nevertheless, sustained break of 139.26 would open up deeper medium term decline to 61.8% retracement at 125.25.
AUD/USD Daily Report
Daily Pivots: (S1) 0.6459; (P) 0.6482; (R1) 0.6509; More...
AUD/USD's fall from 0.6941 resumed by breaking through 0.6433 support today. Intraday bias is back on the downside for 0.6348 support. Break there will target 0.6269 low next. On the upside, above 0.6503 minor resistance will turn intraday bias neutral again first.
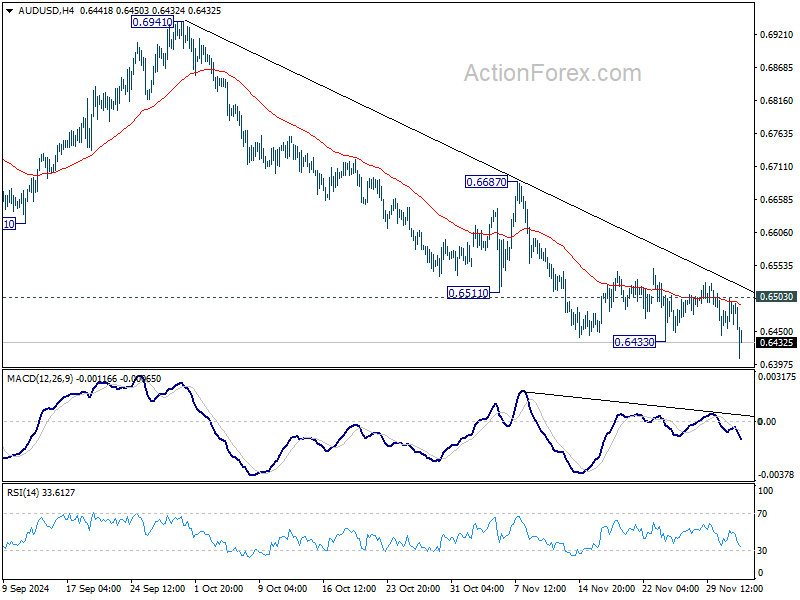
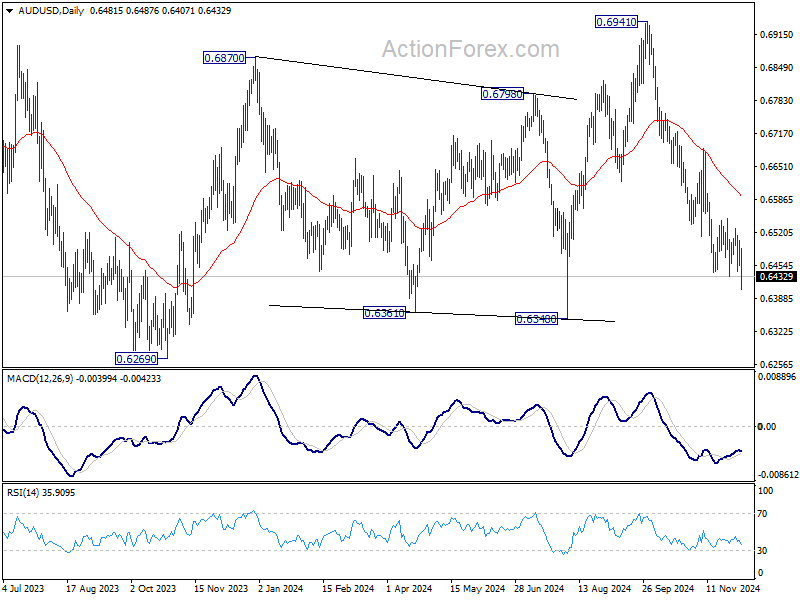
In the bigger picture, rise from 0.6269 (2023 low) should have completed with three waves up to 0.6941. Corrective pattern from 0.6169 (2022 low) is now extending with another falling leg. Deeper decline would be seen back to 0.6269 as sideway trading extends.
USD/CAD Daily Outlook
Daily Pivots: (S1) 1.4027; (P) 1.4052; (R1) 1.4094; More...
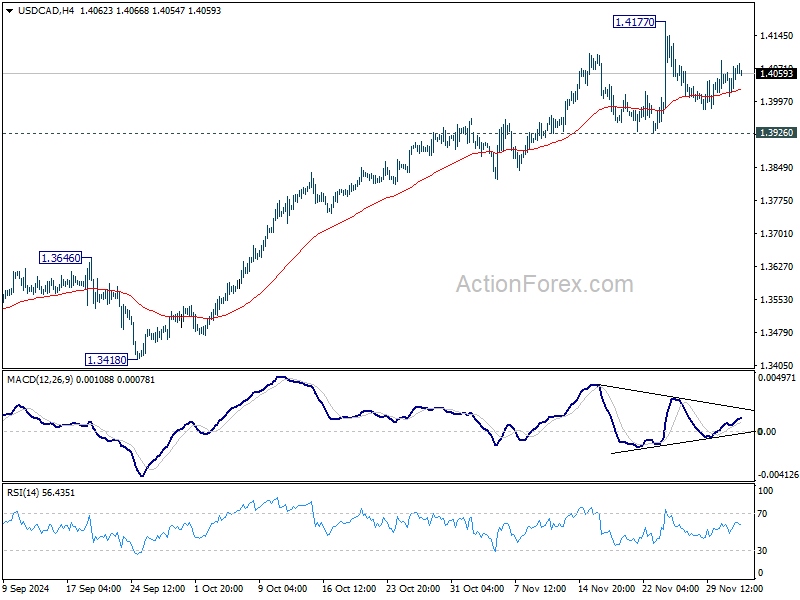
USD/CAD is extending sideway trading below 1.4177 and intraday bias stays neutral at this point. Further rally is expected with 1.3930 support intact. On the upside, firm break of 1.4177 will resume larger up trend towards 1.4391 projection level. However, break of 1.3926 will turn bias to the downside for deeper pullback to 55 D EMA (now at 1.3864).
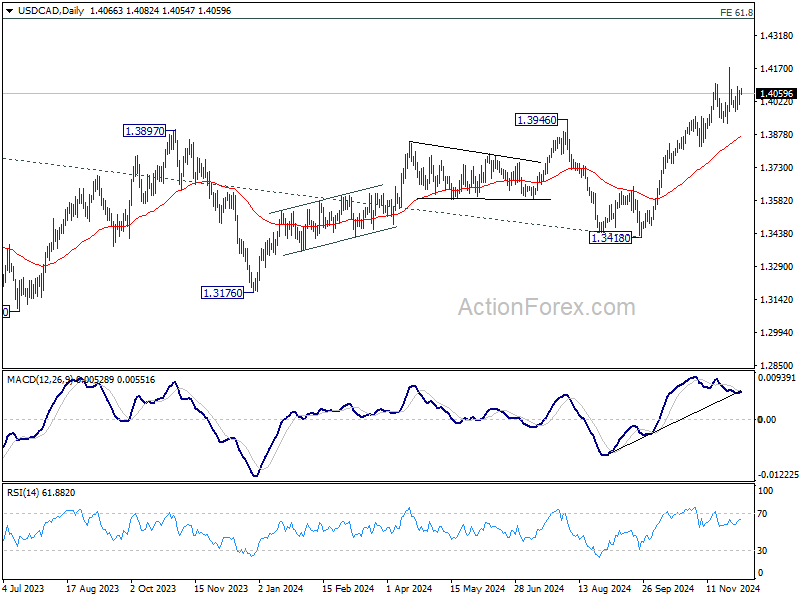
In the bigger picture, up trend from 1.2005 (2021) is resuming with break of 1.3976 key resistance (2022 high). Next target is 61.8% projection of 1.2401 to 1.3976 from 1.3418 at 1.4391. Now, medium term outlook will remain bullish as long as 1.3418 support holds, even in case of deep pullback.
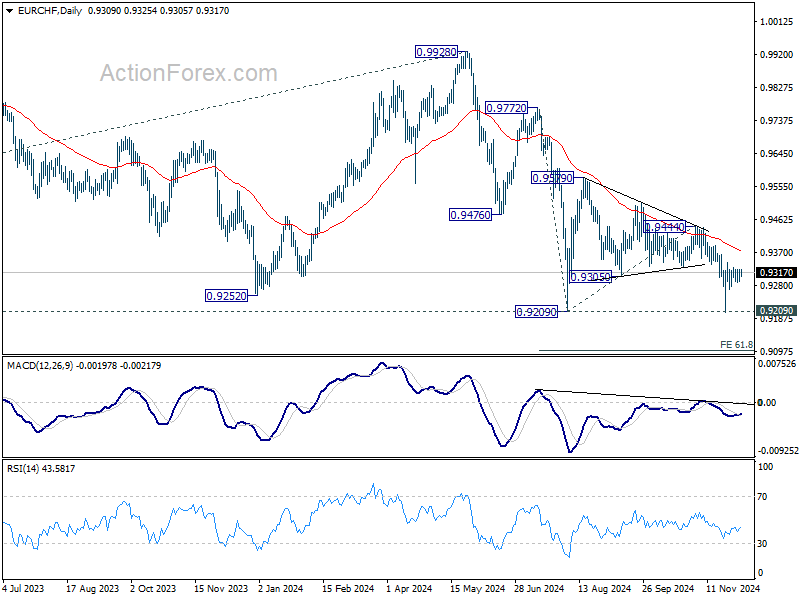
EUR/CHF Daily Outlook
Daily Pivots: (S1) 0.9295; (P) 0.9310; (R1) 0.9331; More....
Range trading continues in EUR/CHF and intraday bias remains neutral. Further decline is in favor with 0.9343 resistance intact. On the downside, below 0.9269 minor support will bring retest of 0.9204/9 support zone. Decisive break there will confirm larger down trend resumption. Nevertheless, firm break of 0.9343 will now be a sign of near term bullish reversal, and target 0.9444 resistance for confirmation.
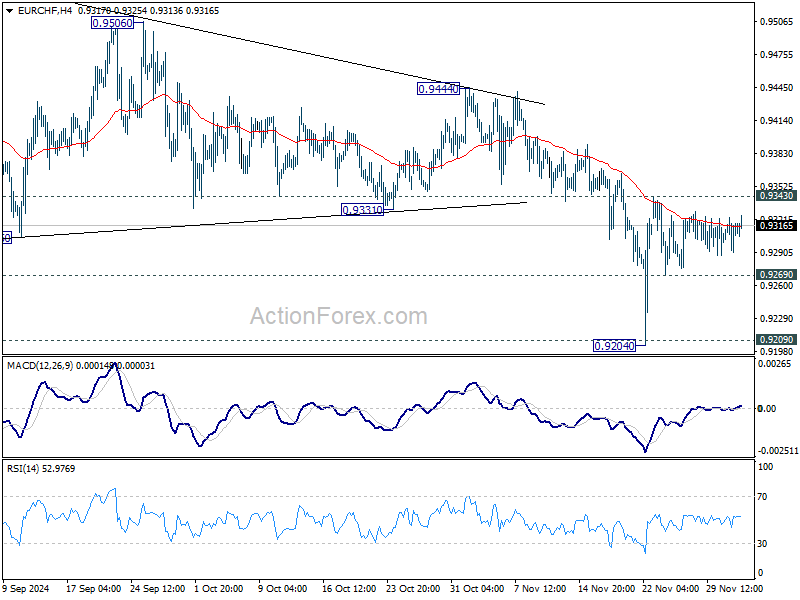
In the bigger picture, outlook will now stay bearish as long as 0.9444 resistance holds. Decisive break of 0.9209 low will resumed long term down trend to 61.8% projection of 0.9772 to 0.9209 from 0.9444 at 0.9096 next.
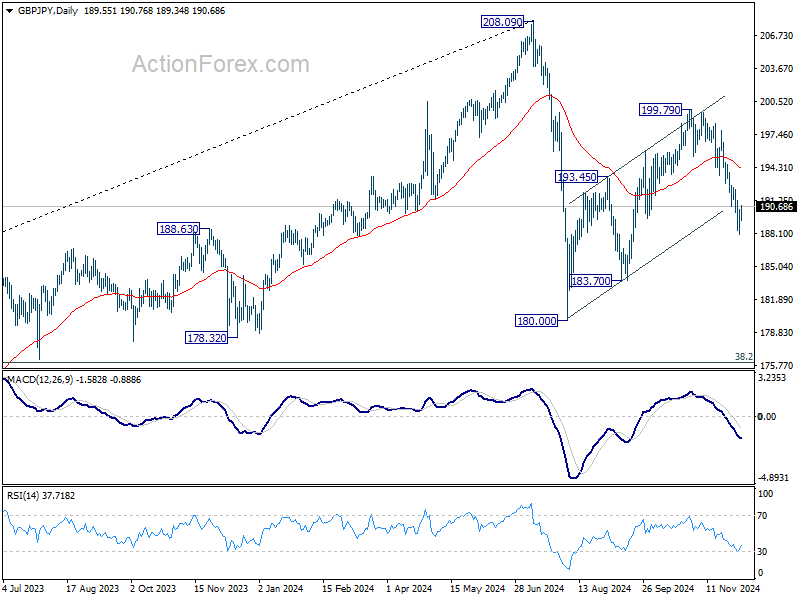
GBP/JPY Daily Outlook
Daily Pivots: (S1) 188.30; (P) 189.35; (R1) 190.60; More...
Intraday bias in GBP/JPY is turned neutral with current recovery and some consolidations would be seen first. Further decline is expected as long as 55 D EMA (now at 194.36) holds. On the downside, below 188.07 temporary low will resume the fall from 199.79 to 183.70 support. Firm break there will argue that whole decline from 208.09 is resuming, and target a test on 180.00 low next.
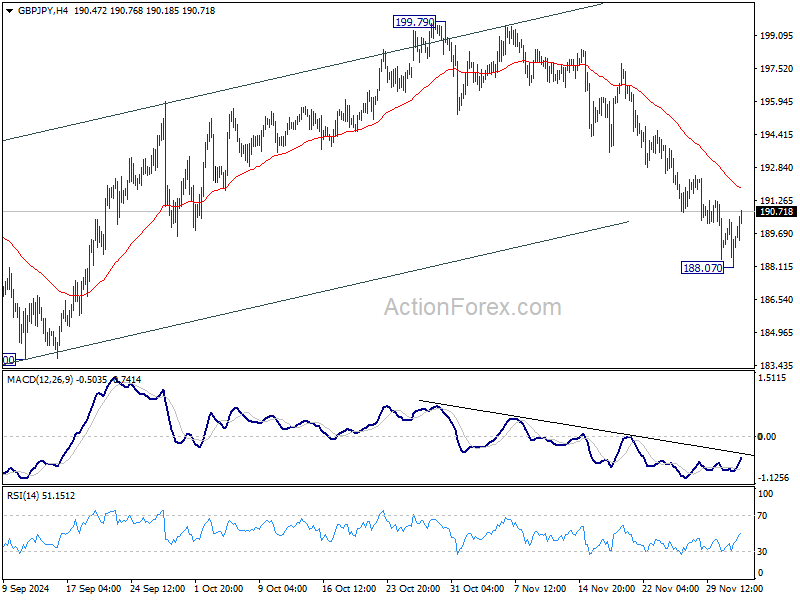
In the bigger picture, price actions from 208.09 are seen as a correction to whole rally from 123.94 (2020 low). The range of consolidation should be set between 38.2% retracement of 123.94 to 208.09 at 175.94 and 208.09. However, decisive break of 175.94 will argue that deeper correction is underway.
EUR/JPY Daily Outlook
Daily Pivots: (S1) 156.26; (P) 157.12; (R1) 158.07; More....
Intraday bias in EUR/JPY is turned neutral first with current recovery, and some consolidations would be seen. Further decline is expected as long as 55 D EMA (now at 162.38) holds. On the downside, below 156.16 temporary low will resume the fall from 166.67 to 155.14 support first. Firm break there will raise the chance that whole decline from 175.41 is resuming, and target 154.40 low next.
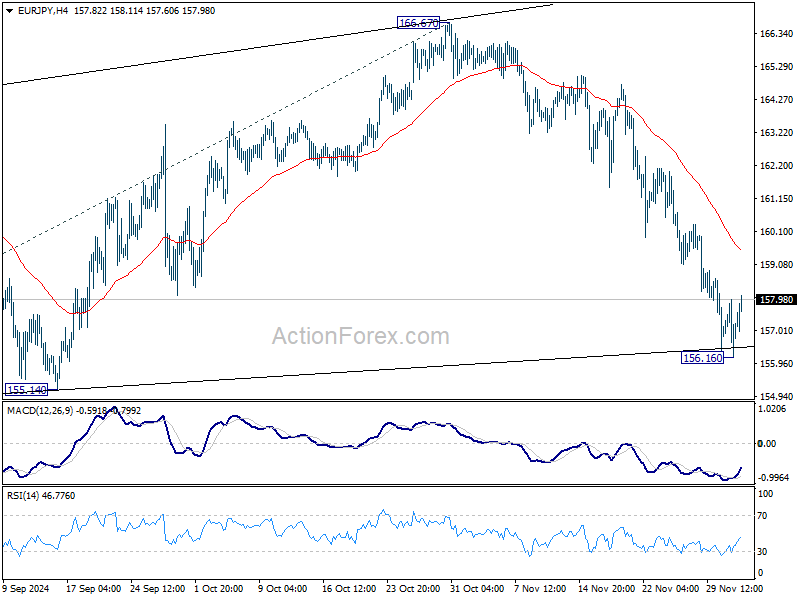
In the bigger picture, price actions from 175.41 are seen as correction to rally from 114.42 (2020 low). The range of consolidation should have been set between 38.2% retracement of 114.42 to 175.41 at 152.11 and 175.41 high. However, decisive break of 152.11 would argue that deeper correction is underway.
