
Sample Category Title
USD/CHF Mid-Day Outlook
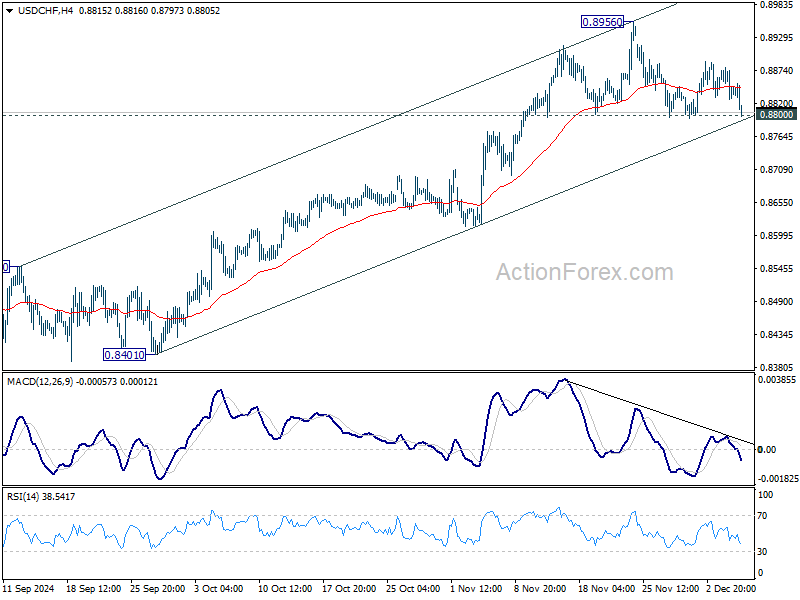
Daily Pivots: (S1) 0.8821; (P) 0.8851; (R1) 0.8874; More…
Immediate focus is now on 0.8800 support in USD/CHF with today's decline. Decisive break there will confirm short term topping at 08956. Intraday bias will be turned back to the downside for 55 D EMA (now at 0.8736). On the upside, break of 0.8956 will resume the rally from 0.8374, and target 0.9223 key resistance next.
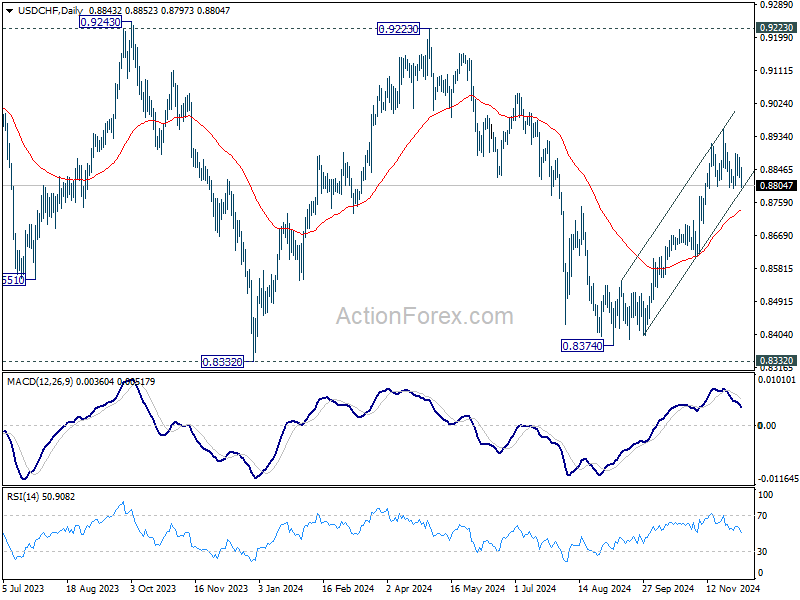
In the bigger picture, price actions from 0.8332 (2023 low) are currently seen as a medium term corrective pattern. Rise from 0.8374 is seen as the third leg. Overall outlook will continue to stay bearish as long as 0.9223 resistance holds. Break of 0.8332 low is in favor at a later stage when the consolidation completes.
EUR/USD Mid-Day Outlook
Daily Pivots: (S1) 1.0474; (P) 1.0509; (R1) 1.0546; More...
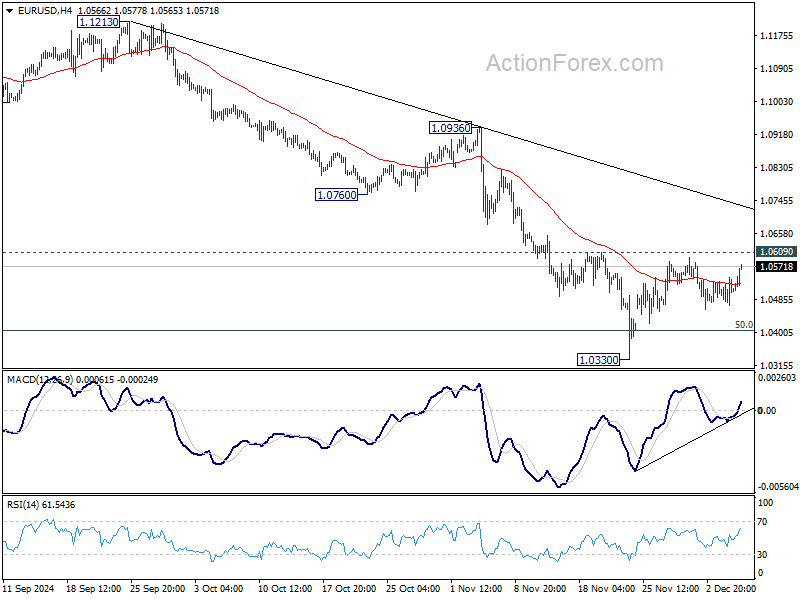
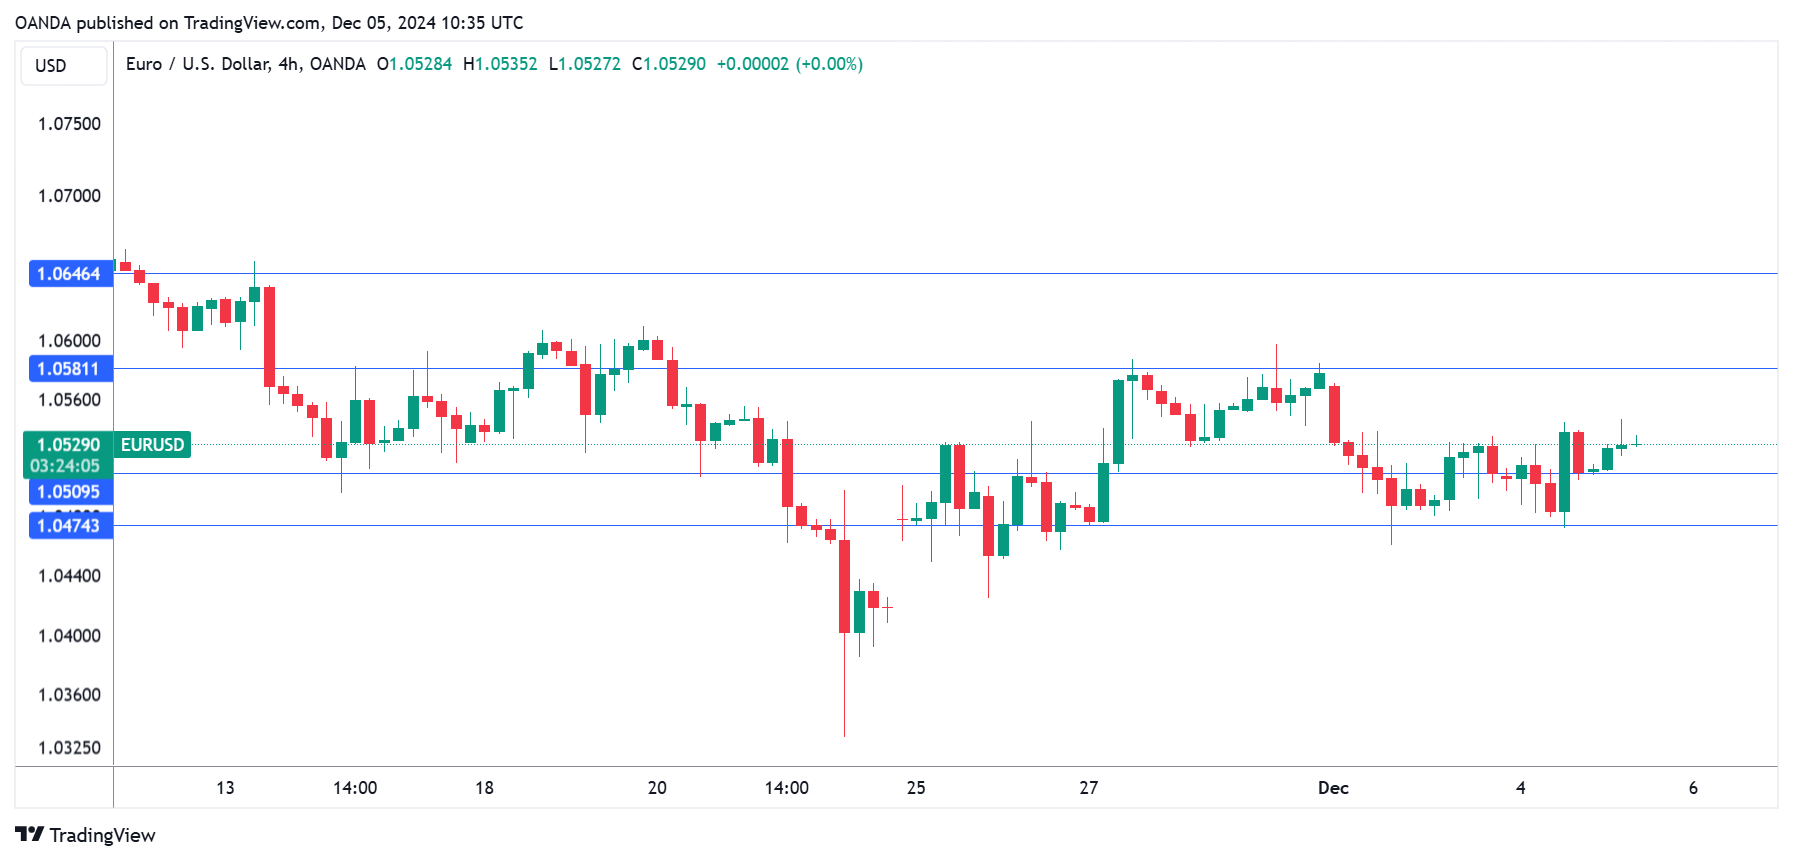
No change in EUR/USD's outlook as it's still staying below 1.0609 resistance. Intraday bias stays neutral for the moment. On the downside, firm break of 1.0609 resistance will resume the rebound from 1.0330 to 1.0760 support turned resistance. On the downside, break of 1.0330 will resume the fall from 1.1213. Also, sustained trading below 1.0404 key fibonacci level will carry larger bearish implication.

In the bigger picture, immediate focus is now on 50% retracement of 0.9534 (2022 low) to 1.1274 at 1.0404. Strong rebound from this level will keep price actions from 1.1273 (2023 high) as a medium term consolidation pattern only. However, sustained break of 1.0404 will raise the chance that whole up trend from 0.9534 has reversed. That would pave the way to 61.8% retracement at 1.0199 first. Firm break there will target 0.9534 low again.

Canadian Trade Posts Eighth Consecutive Deficit
Canada’s merchandise trade balance tallied a $942 million deficit in October, registering in the red ink for the eighth consecutive month. The deficit narrowed from September's $1.3 billion deficit.
Merchandise exports rose by 1.1% month-on-month (m/m) in October, partially reversing the past three months of declines. The highly volatile metallic and non-metallic minerals product group contributed to most of the trade gain (+10.6% m/m). Exports of consumer goods (+4.7% m/m) also provided an assist. Aside from that, 8 of 11 sectors registered declines on the month.
Total merchandise imports also increased, by 0.5% m/m in October, with the biggest gains coming from metal ores and non-metallic minerals (+46.1% m/m) and energy products (+6.2% m/m).
In volume terms, merchandise exports rose by 0.4% m/m and imports were up by 0.7% m/m.
Canada's merchandise trade surplus with the United States narrowed to $6.2 billion in October from $7.9 billion the month prior.
Key Implications
Statistics Canada has cautioned that a new digital initiative will subject October's data to heavy revisions, making this report tough to read. For what it's worth, export volumes are tracking higher than imports putting the growth contribution to Q4 GDP in positive territory.
Trade data has taken on increased importance as President-elect Trump takes office in January. Our base case is that Canada largely avoids Trump's blanket 25% tariff across all goods exports, but we acknowledge that any tariff policy levied against Canada will come with negative economic consequences. There may be signs that manufacturers and retailers are front-running potential tariffs, as total import and export volumes have risen modestly over the last three months, although it's still too early to tell if this is the start of a trend.
GBP/USD Mid-Day Outlook
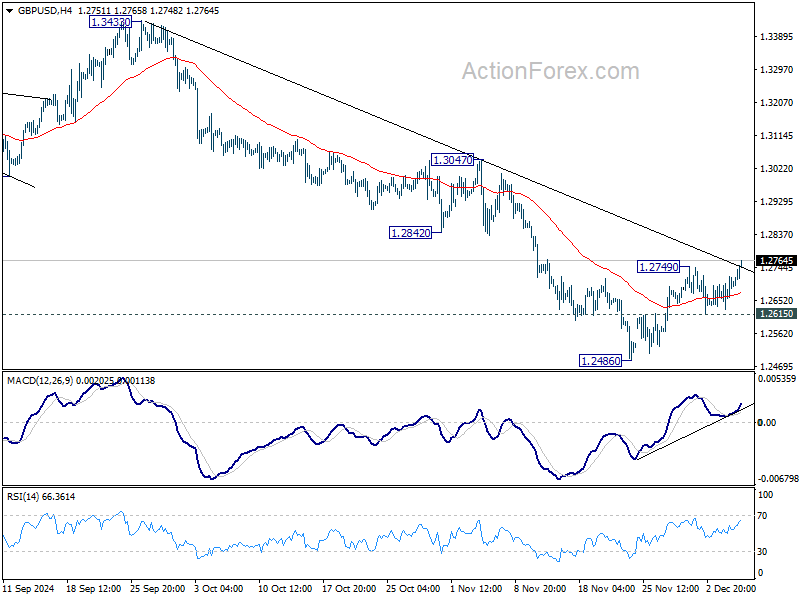
Daily Pivots: (S1) 1.2646; (P) 1.2684; (R1) 1.2737; More...
GBP/USD's rebound from 1.2486 resumes by breaking 1.2749 resistance today. Intraday bias is back on the upside for stronger rally to 55 D EMA (now at 1.2853). Strong resistance is expected there to limit upside, and bring resumption of whole fall from 1.3433. On the downside, below 1.2615 minor support will bring retest of 1.2486 low first. However, sustained break of 55 D EMA will argue that the near term trend has reversed, and targets 1.3047 resistance for confirmation.
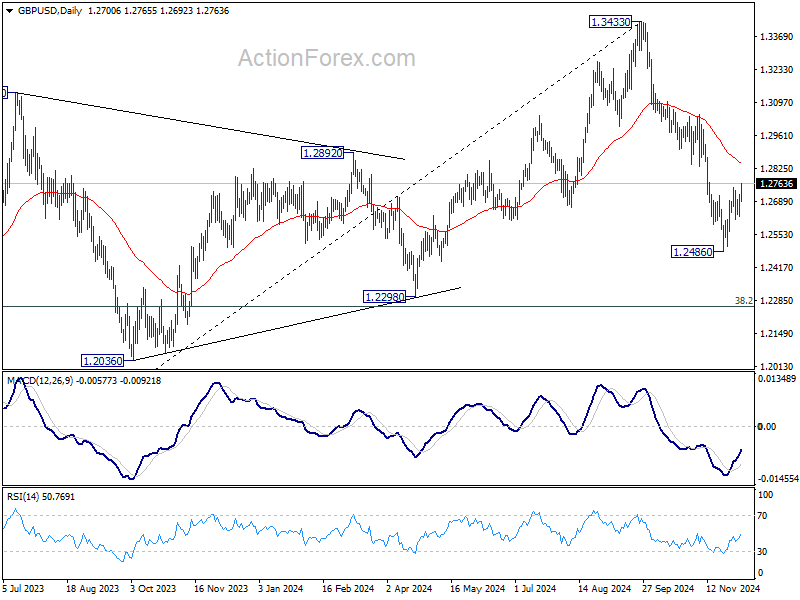
In the bigger picture, a medium term top should be in place at 1.3433, and price actions from there are correcting whole up trend from 1.0351 (2022 low). Deeper decline is now expected as long as 55 D EMA (now at 1.2853) holds, to 38.2% retracement of 1.0351 to 1.3433 at 1.2256, which is close to 1.2298 structural support. Strong support should be seen there to bring rebound.
GBP Strengthens on Conflicting BoE Survey Data, Highlighting Monetary Policy Dilemmas
Sterling rallied broadly today, driven by BoE’s Monthly Decision Maker Panel survey, which underscored a complex economic outlook that reinforces the central bank’s cautious approach to policy easing. The survey revealed a mixed picture of inflationary and deflationary pressures. Notably, 54% of businesses anticipate raising prices in response to National Insurance contribution hikes outlined in the new government’s first budget. However, an equal proportion also expects to reduce staffing levels, signaling growing concerns about employment.
Additionally, 38% of firms indicated plans to pay lower wages than previously intended, contributing to a deceleration in expected pay growth to 3.8% from 4.1%. Meanwhile, inflation expectations among businesses ticked higher, with consumer price inflation projected at 2.7% for the year ahead, up from 2.6% in October. For November alone, inflation expectations jumped to 2.8% from 2.5%, suggesting persistent cost pressures despite softening wage growth. These mixed signals present a challenging picture for BoE as it deliberates its next steps.
Overall for the day, though, Euro led gains among major currencies, as markets digest the latest developments in France’s political sphere. Prime Minister Michel Barnier has resigned following a no-confidence vote against his government, with President Emmanuel Macron expected to address the nation later today. Sterling ranks as the second strongest currency of the day, followed by the Swiss Franc, marking a rebound for European currencies after recent underperformance. On the other hand, Yen is underperforming, followed by the Dollar. Commodity-linked currencies, including Aussie, Kiwi and Loonie, are positioning in the middle.
Technically, GBP/USD's break of 1.2749 resistance is a sign that Dollar's near term pullback is resuming, at least against Europeans. Focus will now be on 1.0609 resistance in EUR/USD and 0.8800 support in USD/CHF. Firm break of these levels should confirm that deeper decline in the greenback is underway. But still, the next big move would still be subject to tomorrow's US non-farm payroll report.
In Europe, at the time of writing, FTSE i down -0.01%. DAX is up 0.37%. CAC is up 0.18%. UK 10-year yield is up 0.0231 at 4.273. Germany 10-year yield is up 0.055 at 2.116. Earlier in Asia, Nikkei rose 0.30%. Hong Kong HSI fell -0.92%. China Shanghai SSE rose 0.12%. Singapore Strait Times rose 0.60%. Japan 10-year JGB yield rose 0.0198 to 1.073.
US initial jobless claims rises 9k to 224k, vs exp 215k
US initial jobless claims rose 9k to 224k in the week ending November 30, above expectation of 215k. Four-week moving average of initial claims rose 750 to 218k.
Continuing claims fell -25k to 1871k in the week ending November 23. Four-week moving average of continuing claims fell -3k to 1884k.
Canada’s trade deficit narrows to CAD - 0.9B as exports rebound in October
Canada's merchandise trade deficit with the world narrowed to CAD -0.9B in October from September's CAD -1.3B, driven by a 1.1% mom rise in exports. This marks a rebound following three consecutive monthly declines. Imports also increased, albeit at a slower pace, rising 0.5% mom.
Despite the headline growth in exports, declines were recorded in 8 of the 11 product sections. The increase was partly attributed to higher prices, with export volumes rising modestly by 0.4% mom in real terms.
Eurozone retail sales fall -0.5%Q mom in Oct, EU down -0.3% mom
Eurozone retail sales volume declined by -0.5% mom in October, underperforming expectations of a -0.4% mom contraction. Breaking down the data, sales for food, drinks, and tobacco edged up 0.1% mom, while non-food products (excluding automotive fuel) slumped -0.9% mom, and automotive fuel sales in specialized stores dropped -0.3% mom.
Across the broader European Union, retail sales volume fell by -0.3% mom. Among member states, the sharpest monthly declines were seen in Belgium (-1.7%), Germany (-1.4%), and Denmark and Cyprus (both -1.1%). Conversely, Luxembourg led with a strong 2.4% increase, followed by Poland at 2.2% and Lithuania at 1.5%.
BoJ’s Nakamura skeptical on wage and inflation sustainability
BoJ board member Toyoaki Nakamura expressed a cautious stance on monetary policy adjustments, emphasizing the need for careful calibration aligned with Japan's economic recovery.
"We are at a state where it’s important to adjust the degree of monetary easing carefully in accordance with the economic recovery by assessing a broad array of data," Nakamura said.
As a known dove on the BoJ board, Nakamura raised doubts about the durability of current wage hikes, saying he is "not confident" about their sustainability. He also flagged concerns about inflation, noting the possibility that the annual rate "may not reach 2% from fiscal 2025 onwards."
In a related development, a Jiji Press report indicated growing hesitation within BoJ regarding a premature rate increase. Market expectations for a December rate hike have fallen sharply, with traders now pricing in only a 36% chance, down from 66% at the end of last week.
GBP/USD Mid-Day Outlook
Daily Pivots: (S1) 1.2646; (P) 1.2684; (R1) 1.2737; More...
GBP/USD's rebound from 1.2486 resumes by breaking 1.2749 resistance today. Intraday bias is back on the upside for stronger rally to 55 D EMA (now at 1.2853). Strong resistance is expected there to limit upside, and bring resumption of whole fall from 1.3433. On the downside, below 1.2615 minor support will bring retest of 1.2486 low first. However, sustained break of 55 D EMA will argue that the near term trend has reversed, and targets 1.3047 resistance for confirmation.
In the bigger picture, a medium term top should be in place at 1.3433, and price actions from there are correcting whole up trend from 1.0351 (2022 low). Deeper decline is now expected as long as 55 D EMA (now at 1.2853) holds, to 38.2% retracement of 1.0351 to 1.3433 at 1.2256, which is close to 1.2298 structural support. Strong support should be seen there to bring rebound.
Bitcoin Has Hit a New Milestone. Is Ethereum Next?
Market Picture
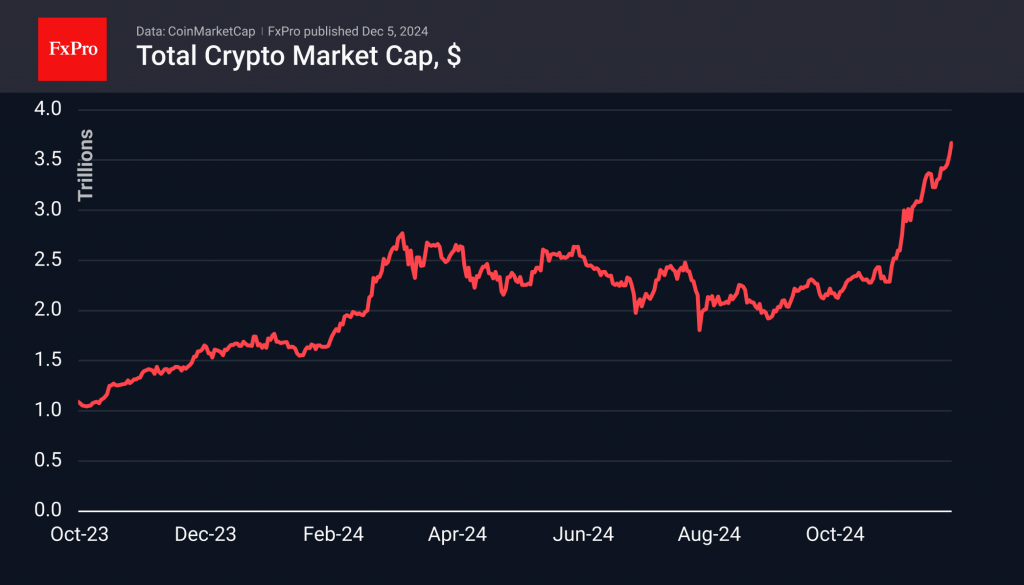
The crypto market has risen by more than 3% in the last 24 hours to reach $3.69 trillion, this time thanks to the euphoria surrounding Bitcoin.
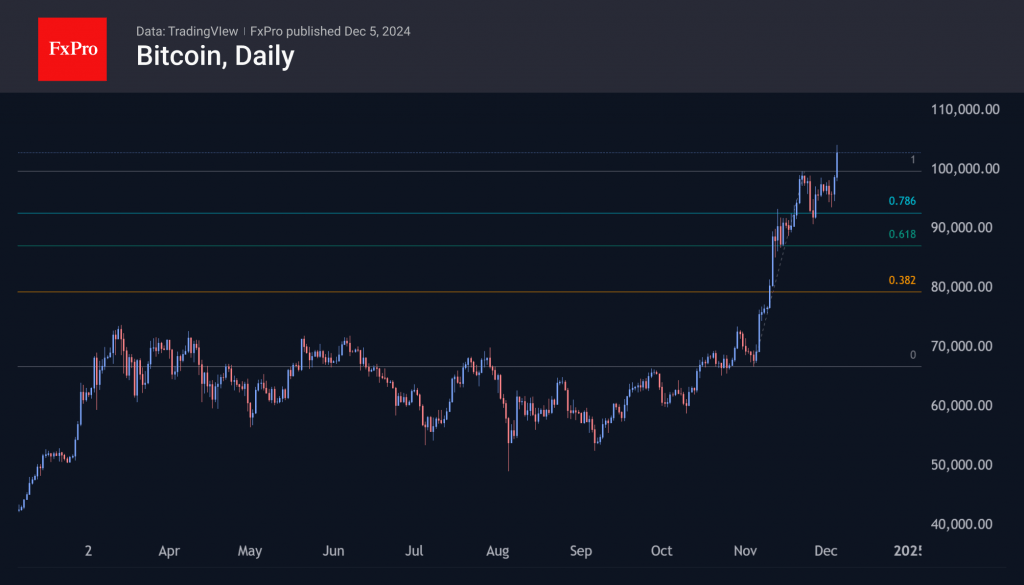
The price of the first cryptocurrency surpassed $100,000, a psychologically important milestone. The price then stabilised at $102.4K. It took almost two weeks from approaching this level to crossing it, during which time altcoins became the market driver. Perhaps the pendulum of interest will swing back to bitcoin for a while.
Powell, the Fed chairman, once again referred to Bitcoin as the digital analogue of gold, which was seen as a bullish signal to overcome resistance. While we believe Powell was the reason for the recent momentum, we attribute it to his upbeat comments on the economy, which supported risk appetite. Next, automatic stop orders came into play, pulling the market higher in thin Asian trading.
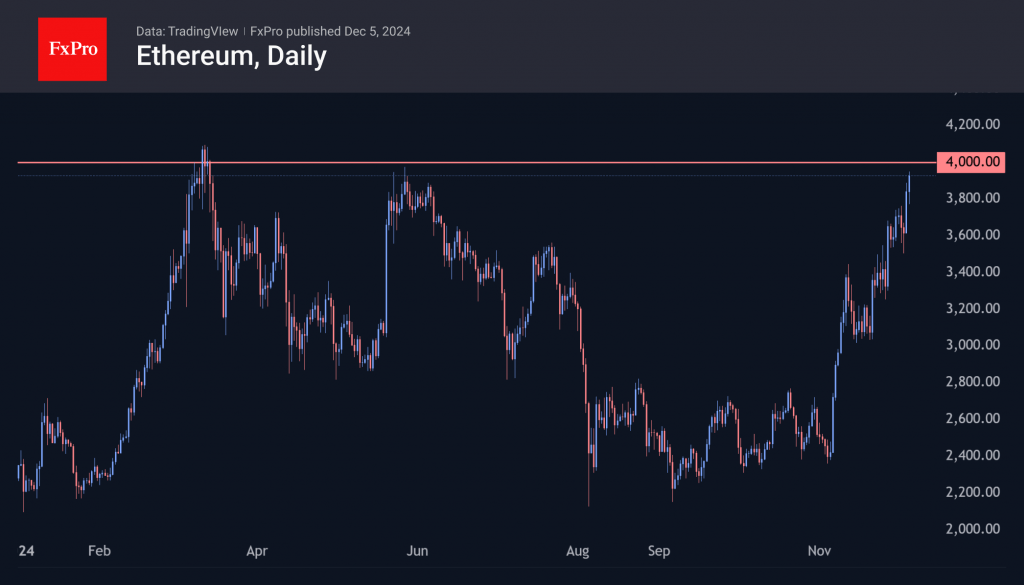
Ethereum’s next important level for the cryptocurrency markets could be $4,000, which it failed to consolidate above earlier this year.
News Background
Grayscale Investments has filed with the SEC to convert the GSOL Trust into a Solana Spot ETF. Canary, VanEck, 21Shares, and Bitwise are also pending applications to launch Solana ETFs.
Paul Atkins, whom the media have touted as a leading candidate for the position of SEC chairman, has been interviewed by President-elect Donald Trump. However, according to CoinDesk, the position is not attractive to Atkins due to the amount of work involved.
BNB hit a new all-time high above $790 after DEX PancakeSwap unveiled Springboard, a platform for issuing meme coins on the BNB chain.
According to QCP Capital, the main driver of altcoin growth was the proposal to abolish the capital gains tax on cryptocurrencies, which representatives of US companies drafted. The market expects this will create a more favourable regulatory environment for the crypto industry.
Canada’s trade deficit narrows to CAD – 0.9B as exports rebound in October
Canada's merchandise trade deficit with the world narrowed to CAD -0.9B in October from September's CAD -1.3B, driven by a 1.1% mom rise in exports. This marks a rebound following three consecutive monthly declines. Imports also increased, albeit at a slower pace, rising 0.5% mom.
Despite the headline growth in exports, declines were recorded in 8 of the 11 product sections. The increase was partly attributed to higher prices, with export volumes rising modestly by 0.4% mom in real terms.
US initial jobless claims rises 9k to 224k, vs exp 215k
US initial jobless claims rose 9k to 224k in the week ending November 30, above expectation of 215k. Four-week moving average of initial claims rose 750 to 218k.
Continuing claims fell -25k to 1871k in the week ending November 23. Four-week moving average of continuing claims fell -3k to 1884k.
Euro Steady as France’s Government Collapses
The euro has been drifting most of this week and remains steady on Thursday. In the European session, EUR/USD is trading at 1.0533, up 0.22% at the time of writing.
France in political chaos as government collapses
France’s coalition government has collapsed after a no-confidence vote against the government passed on Wednesday. French Prime Minister Michel Barnier is expected to resign on Thursday. The political turmoil could leave France without a government for weeks or even months, and the instability in the eurozone’s second-largest economy could spell trouble for the entire bloc.
The euro has weathered this later storm and has managed to post slight gains on Thursday. That could change if France’s political crisis deepens. The euro has been on a dreadful slide and is down 7.2% against the US dollar since October 1.
The European Central Bank meets on Dec. 12 and is widely expected to cut rates by 25 basis points. The political crisis in France is one more headache for ECB policymakers. Germany’s government collapsed last month and the new Trump administration could slap tariffs on the European Union. If this wasn’t enough, the eurozone economy has been sluggish, with the November data indicating that services and manufacturing contracted.
Federal Reserve Chair Jerome Powell sounded guardedly optimistic on Wednesday, saying that the US economy was in “very good shape” and that the Fed could “afford to be a little more cautious” about rate moves. The markets have priced in a rate cut at the Dec. 18 meeting and Powell may be trying to dampen anticipation of further rate cuts in early 2025. Powell may decide to cut in December and take a breather for a few months, with President-elect Trump and the new Congress taking over in January and likely to pursue a protectionist trade policy.
EUR/USD Technical
- EUR/USD is testing resistance at 1.0646. Above, there is resistance at 1.0581
- 1.0509 and 1.0474 are the next support levels
Natural Gas Prices Rebound from 2.5-Month Low
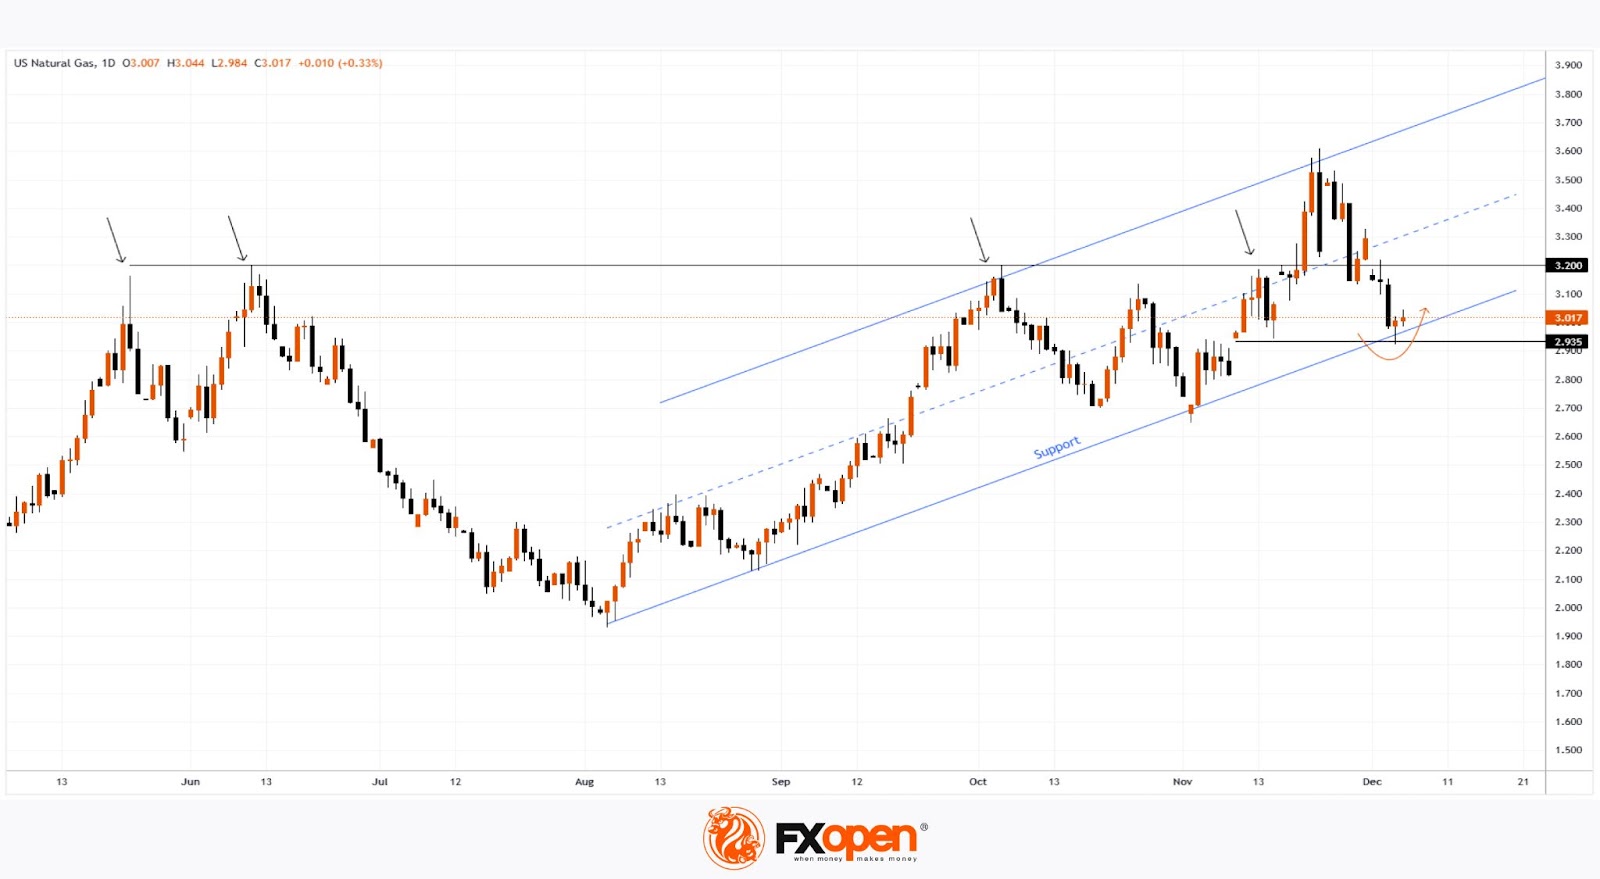
On 19 November, we analysed the natural gas price chart, noting:
→ the formation of an upward channel (marked in blue);
→ a potential bullish attempt to break the key $3.200 level, which had acted as resistance (highlighted with arrows).
As seen on the XNG/USD chart, the price did rise above $3.200 but failed to hold. After fluctuating in the upper half of the channel, it dropped below $3.200 to the channel's lower boundary, driven by:
→ a bearish report from the Energy Information Administration, showing US gas inventories above the five-year average;
→ a report from financial firm LSEG noting increased average gas production across 48 US states.
This decline pushed natural gas prices to a 2.5-month low around the $2.935 level.
What Could Happen Next?
From a technical perspective on the XNG/USD chart:
→ support from the channel's lower boundary (reinforced by the psychological $3.000 mark) is already evident in an emerging price reversal (indicated by an arrow);
→ on the other hand, the $3.200 level may resume acting as resistance.
It’s likely that natural gas prices will fluctuate between $3.000 and $3.200, with weather forecasts playing a decisive role in shaping consumption expectations for the winter season.
Start trading commodity CFDs with tight spreads. Open your trading account now or learn more about trading commodity CFDs with FXOpen.
This article represents the opinion of the Companies operating under the FXOpen brand only. It is not to be construed as an offer, solicitation, or recommendation with respect to products and services provided by the Companies operating under the FXOpen brand, nor is it to be considered financial advice.