
Sample Category Title
EUR/USD Daily Outlook
Daily Pivots: (S1) 1.0533; (P) 1.0562; (R1) 1.0615; More...
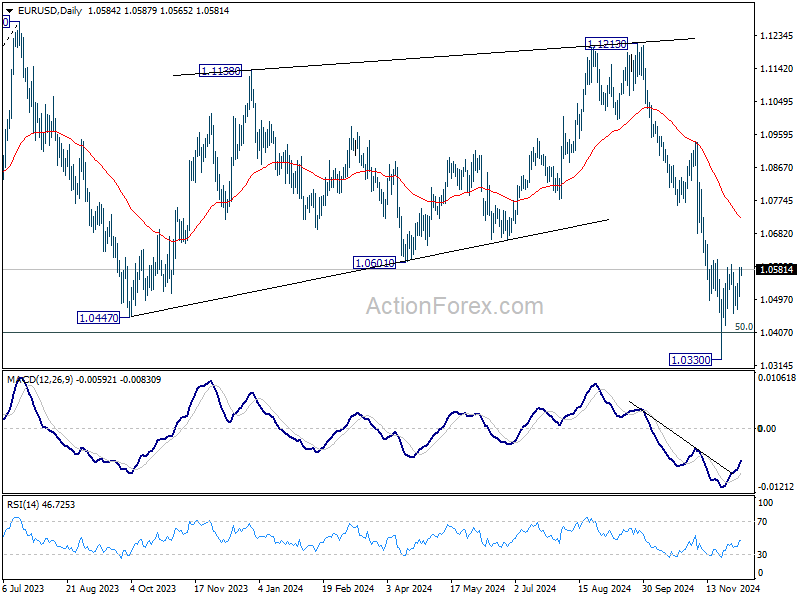
Intraday bias in EUR/USD remains neutral for the moment. On the upside, firm break of 1.0609 resistance will resume the rebound from 1.0330 to 55 D EMA (now at 1.0729). But strong resistance could be seen there to limit upside. . On the downside, break of 1.0330 will resume the fall from 1.1213. Also, sustained trading below 1.0404 key fibonacci level will carry larger bearish implication.
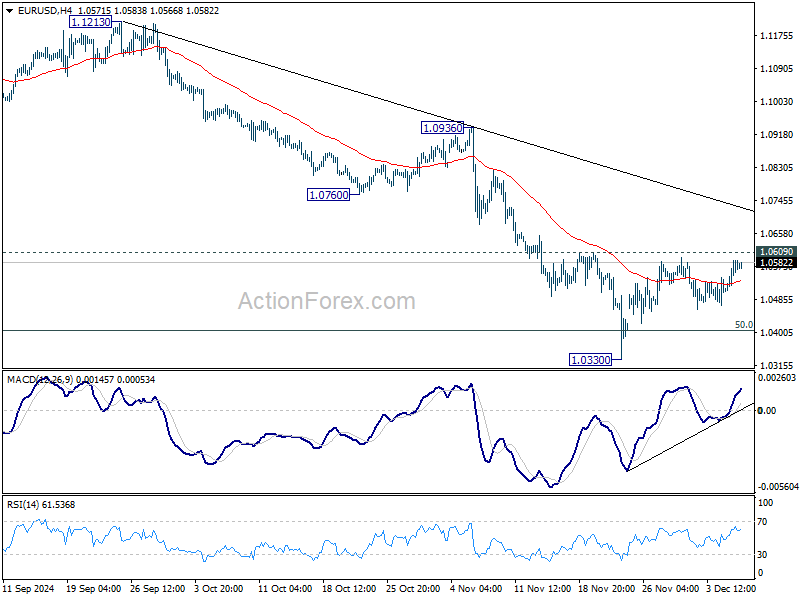
In the bigger picture, immediate focus is now on 50% retracement of 0.9534 (2022 low) to 1.1274 at 1.0404. Strong rebound from this level will keep price actions from 1.1273 (2023 high) as a medium term consolidation pattern only. However, sustained break of 1.0404 will raise the chance that whole up trend from 0.9534 has reversed. That would pave the way to 61.8% retracement at 1.0199 first. Firm break there will target 0.9534 low again.
Dollar Finds Support as Traders Turn to NFP for January Fed Guidance
Dollar steadied after yesterday’s selloff, recovering slightly as markets braced for the non-farm payroll report. Traders appear increasingly confident about a December rate cut, shifting the focus of today’s employment data toward its implications for January's FOMC meeting. While the report may still trigger some market volatility, many participants seem inclined to look past this release, awaiting key indicators like next week’s CPI or January's NFP for more decisive cues.
Meanwhile, Australian and New Zealand Dollars remained under pressure, showing weakness despite the absence of a clear risk-off sentiment. Global equity markets are holding up well, with US indices near record highs and Germany’s DAX extending its powerful record-breaking rally. Australian stocks also hit new highs, albeit with slower momentum. The Antipodean currencies’ weakness could reflect rising concerns about the escalation of US-China tariff tensions under the incoming US administration next year.
For the week so far, Swiss Franc unexpectedly leads as the strongest performer, followed by Sterling and Dollar. Australian Dollar lags at the bottom, trailed by Kiwi and Yen. Euro and Canadian Dollar are positioned mid-pack.
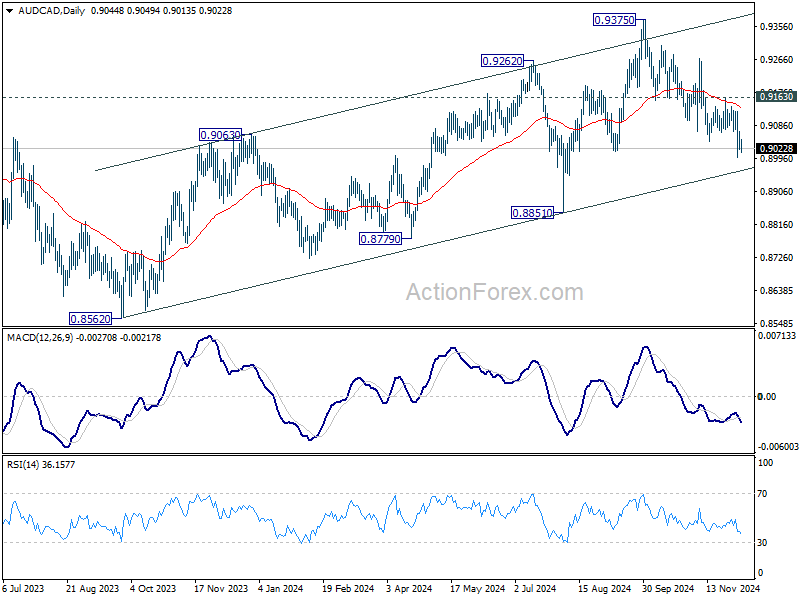
Technically, AUD/CAD's fall from 0.9375 could still be a corrective move tot he rise from 0.8562. Strong rebound from rising channel support (now at 0.8966), followed by break of 0.9163 resistance will suggest that the pull back has completed, and keep the up trend from 0.8562 intact. However, decisive break of the channel support will indicate bearish trend reversal, and target 0.8851 support and below. Canada's upcoming employment data today could be the catalyst for AUD/CAD's next significant move.
In Asia, Nikkei closed down -0.77%. Hong Kong HSI is up 1.52%. China Shanghai SSE is up 1.05%. Singapore Strait Times is down -0.42%. Japan 10-year JGB yield fell -0.0179 to 1.055. Overnight, DOW fell -0.55%. S&P 500 fell -0.19%. NASDAQ fell -0.17%. 10-year yield closed flat at 4.180.
Japan's nominal wages growth hits multi-decade high, but real gains remain elusive
Japan’s labor market data for October showed nominal wages, or labor cash earnings, rose 2.6% yoy, in line with expectations. Regular pay, or base salary, grew 2.7% yoy, marking the fastest increase since November 1992. Full-time workers saw an even sharper wage rise at 2.8% yoy, the highest increase since comparable records began in 1994. Overtime pay also rebounded, registering a 1.4% yoy growth compared to a -0.9% decrease in the prior month.
However, real wages—adjusted for inflation—was stagnant, showing no change from a year ago. This followed declines of -0.4% and -0.8% yoy in September and August, respectively. The inflation rate used by Japan’s labor ministry for these calculations, excluding owners' equivalent rent, slowed to 2.6%, the lowest in nine months.
On the household front, spending fell -1.3% yoy, better than the forecasted -2.6% yoy decline but still reflecting cautious consumer behavior. Food expenditures, comprising around 30% of total spending, dropped -0.8% yoy. Other categories faced sharper declines, including a -13.7% yoy plunge in clothing and shoes, a -10.7% yoy drop in housing-related expenditures, and a -14.0% yoy decrease in education spending, such as tuition fees.
NFP’s role looms larger for January Fed pause while December cut looks set
The pivotal US non-farm payroll report today stands at the center of market focus, with its implications likely to influence both the Fed decision outlook, but probably more on January meeting than this month's.
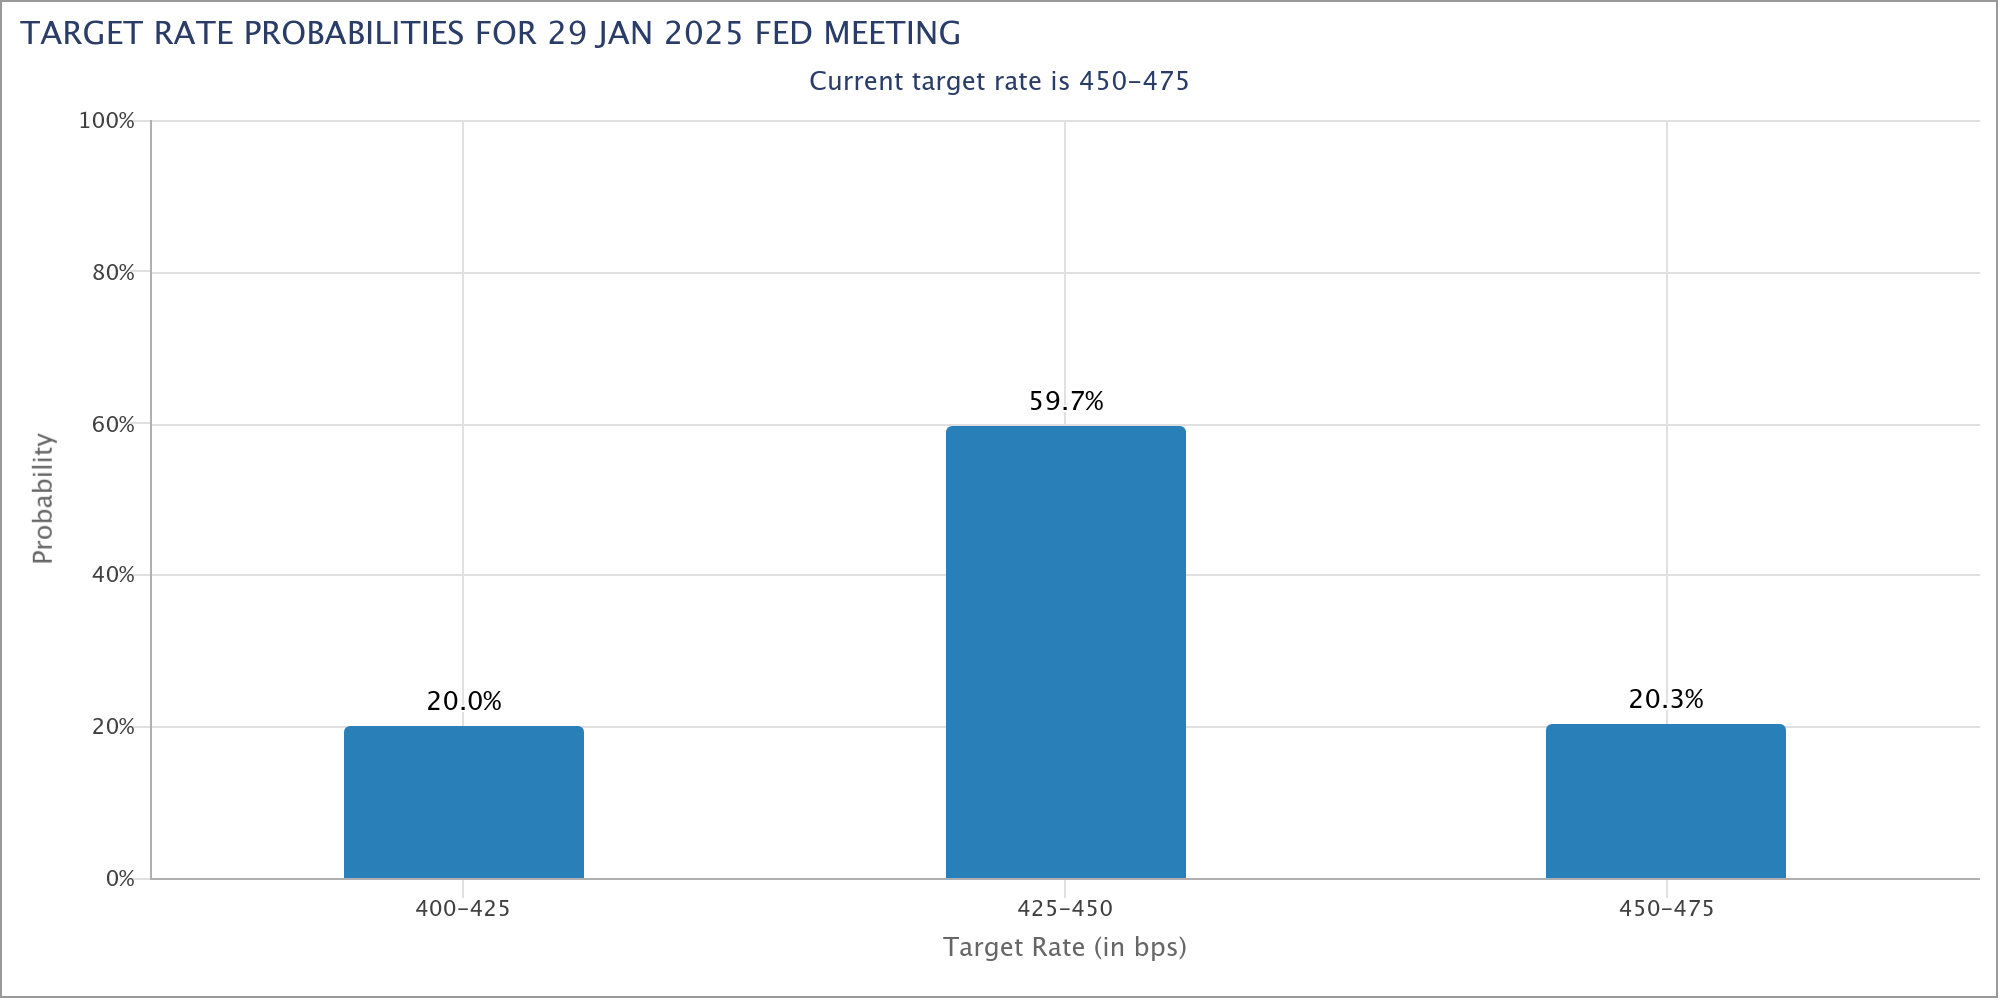
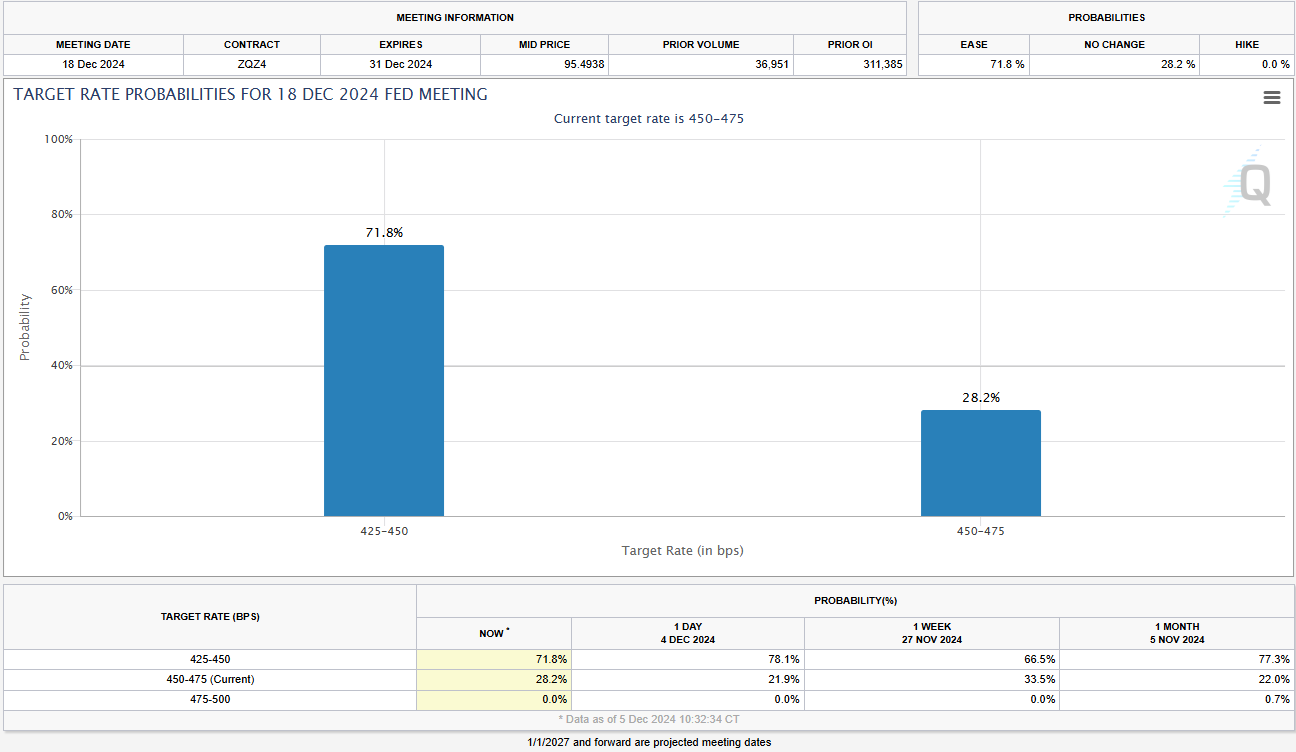
Fed fund futures indicate a 70% probability of a 25bps rate cut this month, up from 66% a week ago. This reflects a growing expectation that recent economic data, including ISM services and manufacturing figures, ADP employment, and JOLTs openings, support further easing to 4.25%-4.50% at the December 18 meeting. This mounting confidence in Fed's decision is unlikely to be deterred by today's data, barring any drastic upside surprises.
However, sentiment regarding January paints a different picture, with just a 20% likelihood of another 25bps cut to 4.00%-4.25%. A stronger-than-expected NFP report today, particularly one highlighting a significant rebound in job growth after October's hurricane- and strike-induced distortions, could solidify expectations of a pause in January.
Recent labor market indicators offer a mixed but steady backdrop. ISM Manufacturing Employment improved to 48.1 from 44.4, while ISM Services Employment softened to 52.1 from 56.0. ADP employment showed a moderation in net job additions at 146K, down from a revised 184K prior. Meanwhile, the 4-week average of initial unemployment claims fell to a strong 218K from 236K. These data points suggest no major red flags for today’s NFP release.
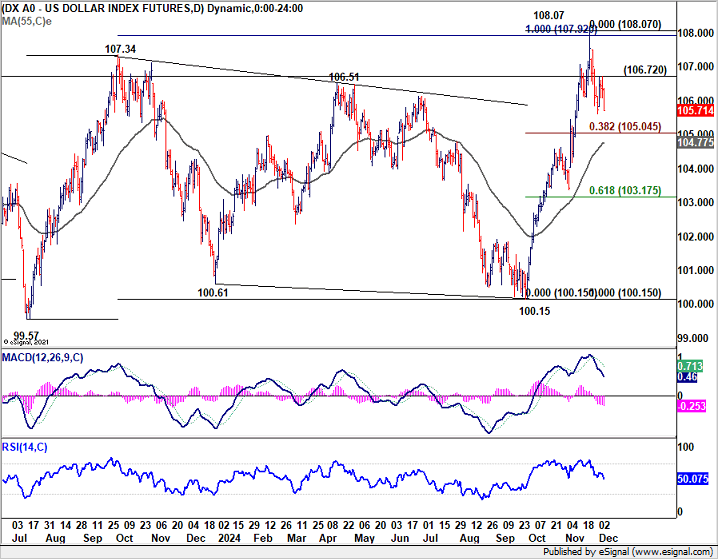
In terms of market reactions, Dollar Index remains in a corrective phase after peaking at 108.07. While a recovery today is possible, near-term risks tilt to the downside as long as 106.72 resistance holds. Deeper pullback could extend to 38.2% retracement of 100.15 to 108.07 at 105.04 completion. Nevertheless, rise from 100.15 would remain in favor to resume at a later stage as long as 55 D EMA (now at 104.77) holds.
EUR/USD Daily Outlook
Daily Pivots: (S1) 1.0533; (P) 1.0562; (R1) 1.0615; More...
Intraday bias in EUR/USD remains neutral for the moment. On the upside, firm break of 1.0609 resistance will resume the rebound from 1.0330 to 55 D EMA (now at 1.0729). But strong resistance could be seen there to limit upside. . On the downside, break of 1.0330 will resume the fall from 1.1213. Also, sustained trading below 1.0404 key fibonacci level will carry larger bearish implication.
In the bigger picture, immediate focus is now on 50% retracement of 0.9534 (2022 low) to 1.1274 at 1.0404. Strong rebound from this level will keep price actions from 1.1273 (2023 high) as a medium term consolidation pattern only. However, sustained break of 1.0404 will raise the chance that whole up trend from 0.9534 has reversed. That would pave the way to 61.8% retracement at 1.0199 first. Firm break there will target 0.9534 low again.
Signs Growing Euro Area Markets Nearing Peak Pessimism
Markets
Rassemblement National’s Le Pen in interview with Bloomberg caused a sigh of relief across markets. After supporting the motion of no confidence that brought down the Barnier government, she’s opened up to any new Prime Minister as long as he/she presents a budget that pencils in a “reasonable trajectory” to bring down outsized deficits. French spreads narrowed sharply and we expect them to settle around the current levels for the time being. There was a general wave of cautious optimism rolling over broader European markets . German Bund yields rose between 2.4 and 6.9 bps in a bear flattener move, stocks rose around 0.7% (EuroStoxx50) and the euro gained against its G10 competitors. EUR/USD rallied from 1.0511 towards the 1.06 area with a weaker dollar helping too. US Treasury yields initially joined the European move higher but some weaker second-tier eco data capped the potential. Net daily changes eventually varied between -1.1 bps (30-yr) and +1.7 bps (2-yr). Markets today brace for the November payrolls report. Job growth should rebound from the -28k decline in October. The negative impact from strikes and hurricanes back then should have been unwounded in November. These kind of statistical bounce-backs are difficult to interpret though. If anything we expect a slightly bigger reaction in case of a downside surprise. A December cut is highly likely but still not fully discounted. Additionally, the bar for pricing out even more cuts in 2025 (about a cumulative 50 bps) is high. We consider front end yields as being most vulnerable for losses. The dollar may lose some ground. If EUR/USD pushes beyond 1.06, the next reference pops up between 1.0666-1.07. We’re keen to see whether the euro is now up for some gains against the dollar of its own making as well. The jury’s still out, but signs are growing that Euro area markets are nearing peak pessimism. The Financial Times yesterday ran an article about several EU countries discussing a new €500bn finance vehicle that could issue bonds backed by participating members to fund common defence projects. It’s a potential important precedent that may pave the way for other initiatives (e.g. green transitioning). It would also open up much-needed fiscal space on a national level.
News & Views
Japanese October wage and consumer spending data published this morning showed a mixed picture. Regular base salary which is seen a less volatile measure for the wage growth dynamics rose 2.8% Y/Y, unchanged from the previous month. Nominal cash labour earnings for all workers rose slightly from a (downwardly revised) 2.5% Y/Y to 2.6%. Real cash earnings were printed at 0.0% Y/Y but improved from -0.4% the previous month. Most of the these wage indicators were close to expectations, some slightly softer than expected. However, while a bit mixed they probably still can be seen by the BoJ as confirming that data wage developments will help keep inflation on a trajectory to sustainably reach the 2% inflation target. Another data series showed real consumer spending declining 1.3% Y/Y in October. This compares to a -1.1% decline in September and market expectations for an even faster drop -2.5% Y/Y. This might show some erratic swings on a monthly basis. The data are important input for the BoJ as it meets on December 19. The market and analysts remain divided whether the BoJ will take a next step to policy normalization already at this meeting or wait until Q1 of next year. The yen hardly reacted to the data. USD/JPY is still hovering near the 150 mark (149.9).
At the press conference the day after Wednesday’s policy meeting, governor Glapinski of the National Bank of Poland (NBP) struck a hawkish tone. The NBP as widely expected kept its policy rate unchanged at 5.75%. Until recently, comments from (some) MPC members suggested that the Bank could start discussing a rate cut at the March meeting. Some members still hold that line (comments from Wnorowski published this morning on Bloomberg). However, Governor Glapinski yesterday indicated that the path in inflation might be more complex due to the handling of the cap on energy prices by the government. Glapinski sees inflation rising to about 5.0% in Q1 2025, but it might again pick up in the 4th quarter. In this context the debate on easing rates might be delayed till October rather than March. The zloty strengthen to the EUR/PLN 4.26 area.
It’s Been A Surprisingly Good Week
Against all odds, yesterday ended up being a good day – at least for investors who have exposure to the French assets. The French government fell and the political uncertainty shifted to a higher gear yet, the French 10-year yield eased, the euro gained, and the CAC 40 hasn’t had such a good week since September. Some say that the fact that the French political turmoil increases the chances of more European Central Bank (ECB) support is helping the French and the broader European indices to do well. But the gains in euro go against that rhetoric... Others say that Le Pen’s comforting words that France could overcome this crisis and even deliver a ‘budget’ in a few weeks – with a slower deficit reducing path of course – have been soothing for the market’s nerves and triggered a relief rally. That’s a bit of day-dreaming, however, given that the job of getting a budget plan improved will probably be as hard for the next government than it has been for Barnier’s - and the next PM should send the new 2025 budget proposal to the president by Dec 21. Tight, tight. And oh, Le Pen also said that Macron doesn’t need to resign – and it made the headlines in a good way, but it sounded like ‘he doesn’t need to resign if he wants to sit in a divided government, handcuffed and wait until his term ends’. But anyway, whatever it is, even chaos is France looks elegant – at least from the market perspective. The market is in a much better mood this Friday than it was the same time last week – when the French government was just about to collapse. And to end this week with a sugar coating, the Eurozone is expected to print a better-looking growth number in Q3. The yearly figure could be revised from 0.6% to 0.9%. The latter could help the euro finish up the week on a better note. The EURUSD is preparing to test the 1.06 resistance. The pair could find enough energy from the euro leg to break the back of the 1.06 offers, but the US jobs figures and the dollar’s direction will say the last word.
The US Dollar Index came swiftly down yesterday on the back of a higher-than-expected jobless claims number last week. Released earlier this week, the US data showed higher job openings in October, but lower-than-expected private job additions in November. In summary, the jobs data was mixed and didn’t lead to an important sentiment change regarding the Federal Reserve (Fed) expectations. The Fed is expected to cut by another 25bp when it meets this month with a 72% probability attached to this scenario. Today, the official jobs data is expected to print a strong NFP number – of around 200K new nonfarm job additions for November. But investors are ready to disregard any strength on that front given that last month’s figure will be impacted by the hurricanes and strikes of the month before. We will keep a closer eye on the unemployment rate – which may have slightly deteriorated from 4.1% to 4.2%, and the wages growth – which may have slightly eased from 0.4% to 0.3% on a monthly basis. The market, and dollar traders, are in a mood to send the US dollar lower. As such, US jobs data in line with expectations – or ideally softer than expected – should lead to a further dollar depreciation into the weekly closing bell. But if the data shows any surprise strength, Powell’s mostly ignored remarks about a ‘remarkably strong US economy and decreased risks in jobs market’ will come back to the headlines and could spoil the mood among Fed doves.
Third time’s not the charm
As widely expected, OPEC announced another 3-month delay to its production restoration plans. It is now planned from April – a full year later than the initial plan. The cartel also said that the restoration will be slower than previously imagined. The problem is, oil bulls are not impressed, because OPEC’s decision to delay its production restoration plans won’t avert a global surplus that the IEA expects to stay above 1mbpd throughout next year. OPEC's announcement, fully priced in, left the bears in control as US crude hovered around $69 per barrel. With the decision lacking surprises, bears are eyeing a drop to the $65-$67 range.
Up and up
The S&P500 and Nasdaq 100 consolidated gains near ATH levels, while the S&P500 equal weight index underperformed its normal-weight version this week, on the back of a rebound in technology stocks. The narrative is still in favour of a broadening market rally toward the non-tech pockets of the market thanks to resilient growth and softer financial conditions. Therefore, short-term divergences are interesting buying opportunities for the equal-weighted index.
The buy-the-divergence rhetoric is also giving support to the European equities. The Stoxx 600 performs surprisingly well for a continent that goes through important political and economical struggles. The rally in DAX index defies the walkout in VW factories, the dire economic fundamentals and an upcoming snap election. So, it’s all about the falling yields and the ECB expectations. Full stop.
What will the ECB do next week? The consensus is another 25bp cut. But many expect the ECB to shift its focus from inflation – that it considers on path to target – to economic growth.
The conclusion of the week is: the stocks go up when the economy is strong, and they go even higher when the economy is weak.
Macron on the Hunt for a New Prime Minister as Barnier Resigns
In focus today
The main data event will be the US Jobs Report for November. We expect Nonfarm Payrolls growth to recover to 160k (cons: 200k, prior: 12k) after temporary weather-related effects have reversed. We anticipate average hourly earnings growth moderated to +0.2% m/m SA and unemployment rate remaining steady at 4.1%. Preliminary results from University of Michigan's December consumer sentiment survey are also due for release.
Ahead of the December ECB meeting, we receive the final estimate of Q3 national accounts. September ECB staff projections estimated compensation per employee would remain at 4.5% y/y in Q3 like in Q2. However, due to data on negotiated wages showing a significant increase in Q3 from Q2, we expect wage growth will likely come in above projections. The batch of data today will also include a breakdown of the GDP components as well as profits, productivity, and hours worked.
In Germany, we receive data on industrial production in October. Industrial production has been on a negative trend the past two years, and data on factory orders yesterday indicates that the decline continued in October.
The Swedish National Debt Office will report the results of the state's payments for November. Deputy Governor of the Riksbank, Anna Seim, will deliver the last scheduled speech (at 10:45 CET) on the theme of current monetary policy and the economic situation, before the publication of the Riksbank's decision on 19 December.
FOMC's blackout period ahead of the December meeting starts on Saturday, and Chicago Fed's Goolsbee, Cleveland Fed's Hammack and SF Fed's Daly will have their chances to share final reflections on the data in scheduled speeches in the evening.
Over the weekend, the South Korean opposition has scheduled an impeachment vote for Saturday evening in the hopes of removing President Yoon Suk Yeol.
Economic and market news
What happened overnight
In South Korea, the ruling party leader said that President Yoon Suk Yeol needed to be removed from authority for his move to impose martial law earlier this week.
In Japan, October wage data revealed nominal wage growth of 2.6% y/y - a slight increase compared to revised September data at 2.5% y/y. It leaves real annual wage growth close to zero; neither an argument for rate hikes, nor cuts.
What happened yesterday
In France, President Emmanuel Macron was on the hunt for a new prime minister after Michel Barnier officially resigned following his ousting in Wednesday's no-confidence vote. President Macron is presumably hoping to avoid a deadlock which could result in an early presidential election before the end of his term in 2027. We anticipate the passing of a 'special law' that will extend the 2024 budget into 2025. This measure would ensure the continuation of minimum state expenditures and revenue collection from 1 January 2025, until a new government is able to propose a formal budget.
In the euro area, retail sales rose slightly more than expected by 1.9% y/y in October (cons: 1.7%, prior: 3.0%). Retail sales in the euro area has been on a positive trend the past year, strengthened by improving consumer confidence. Private consumption is expected to be the main growth driver next year, and the increased retail sales is supporting this narrative.
In Sweden, preliminary November inflation sharply overshot the Riksbank's forecasts as expected. While higher than forecast, we anticipate the Riksbank to look through headline inflation caused by soaring electricity prices for now. However, with core higher and growth data on the positive side, a 50bp rate cut is improbable, instead we expect a 25bp rate cut compared to markets pricing in a 30bp rate cut.
In Oil markets, OPEC+ scaled back pumping plans by 818,000 b/d in 2025. Following the announcement, the global oil benchmark Brent crude LCOc1 gained 0.4% to 72.59, however since June oil has slid by about 10%. The decision is due to a significant downward revision in oil demand for 2025, primarily driven by decreasing demand for oil in China.
Equities: Global equities were lower yesterday, though only marginally, and with the Stoxx 600 higher for the sixth consecutive day. It is now one month since we got strong sense of the US election outcome and the prevailing political challenges. Since the US has remained the strongest performer; however, since we launched our latest strategy update on 8 November, Europe has actually outperformed the US. At the same time, macroeconomic data has been stronger in the US than in Europe. This underscores how low expectations are for Europe and how crowded the US positioning and consensus have become. Finally, one can also highlight the extreme premium at which the US is trading relative to Europe. In the US yesterday, Dow -0.6%, S&P 500 -0.2%, Nasdaq -0.2%, and Russell 2000 -1.3%. Asian markets are mostly lower this morning, with China notably standing out on the positive side. European futures are lower this morning, while US futures are roughly flat.
FI: Risk in European rates dominated with outperformance by French and Italian bonds amid unwinding of safe haven buying in recent days. Le Pen's comment on it being possible to deliver a French budget within weeks soothed the sentiment. The BTPs-Bund spread is now trading at just 108bp, which is the tightest in 3 years. Markets continued to pull back its expectations of near-term rate cuts from the ECB and next week's meeting is priced at just 26bp. However, seen through the end of 2025, the markets have virtually traded sideways of discounting 148bp of rate cuts.
FX: EUR/USD had modest upside momentum within the 1.05-1.06 range during yesterday's session. Political instability in France and slightly softer US data this week have yet to significantly influence the cross. Key today will be the release of the US jobs report. Oil moved modestly lower yesterday amid OPEC+ decision to delay, for a third time, a planned increase in oil production. NOK and GBP both traded to the heavy side, erasing recent gains.
NFP’s role looms larger for January Fed pause while December cut looks set
The pivotal US non-farm payroll report today stands at the center of market focus, with its implications likely to influence both the Fed decision outlook, but probably more on January meeting than this month's.
Fed fund futures indicate a 70% probability of a 25bps rate cut this month, up from 66% a week ago. This reflects a growing expectation that recent economic data, including ISM services and manufacturing figures, ADP employment, and JOLTs openings, support further easing to 4.25%-4.50% at the December 18 meeting. This mounting confidence in Fed's decision is unlikely to be deterred by today's data, barring any drastic upside surprises.
However, sentiment regarding January paints a different picture, with just a 20% likelihood of another 25bps cut to 4.00%-4.25%. A stronger-than-expected NFP report today, particularly one highlighting a significant rebound in job growth after October's hurricane- and strike-induced distortions, could solidify expectations of a pause in January.
Recent labor market indicators offer a mixed but steady backdrop. ISM Manufacturing Employment improved to 48.1 from 44.4, while ISM Services Employment softened to 52.1 from 56.0. ADP employment showed a moderation in net job additions at 146K, down from a revised 184K prior. Meanwhile, the 4-week average of initial unemployment claims fell to a strong 218K from 236K. These data points suggest no major red flags for today’s NFP release.
In terms of market reactions, Dollar Index remains in a corrective phase after peaking at 108.07. While a recovery today is possible, near-term risks tilt to the downside as long as 106.72 resistance holds. Deeper pullback could extend to 38.2% retracement of 100.15 to 108.07 at 105.04 completion. Nevertheless, rise from 100.15 would remain in favor to resume at a later stage as long as 55 D EMA (now at 104.77) holds.
Japan’s nominal wages growth hits multi-decade high, but real gains remain elusive
Japan’s labor market data for October showed nominal wages, or labor cash earnings, rose 2.6% yoy, in line with expectations. Regular pay, or base salary, grew 2.7% yoy, marking the fastest increase since November 1992. Full-time workers saw an even sharper wage rise at 2.8% yoy, the highest increase since comparable records began in 1994. Overtime pay also rebounded, registering a 1.4% yoy growth compared to a -0.9% decrease in the prior month.
However, real wages—adjusted for inflation—was stagnant, showing no change from a year ago. This followed declines of -0.4% and -0.8% yoy in September and August, respectively. The inflation rate used by Japan’s labor ministry for these calculations, excluding owners' equivalent rent, slowed to 2.6%, the lowest in nine months.
On the household front, spending fell -1.3% yoy, better than the forecasted -2.6% yoy decline but still reflecting cautious consumer behavior. Food expenditures, comprising around 30% of total spending, dropped -0.8% yoy. Other categories faced sharper declines, including a -13.7% yoy plunge in clothing and shoes, a -10.7% yoy drop in housing-related expenditures, and a -14.0% yoy decrease in education spending, such as tuition fees.
The Care Economy Slow Lane
Weak household income is being masked by an expansion in non-market care economy. The implications for productivity are often misunderstood, meaning the end of that transition could come as a shock to some.
Australian households have been hit by the largest real income shock since the Great Depression. And, although tax cuts and declining inflation boosted real incomes in the September quarter, other sources of income were weak. No wonder the spending response to those tax cuts was so anaemic and private demand has shown essentially no growth in recent quarters.
The RBA has been sanguine about this weakness in private demand. It assesses that aggregate demand has been outstripping aggregate supply, implying that a period of weak demand is needed to close the gap. In our view, though, the output gap has largely closed. The further deceleration in wages growth, unit labour cost growth and output price inflation in the latest quarter are all consistent with this.
The difference is that the RBA’s post-Review framework treats any deviation of inflation from target as a sign of a positive output gap. The Governor’s latest speech framed the assessment in this way: “Elevated inflation indicates that the level of demand in the economy is above the ability of the economy to supply the goods and services demanded.”
While this implicitly acknowledges that inflation expectations have been anchored, it does not adequately allow for lags in price adjustment or the fact that the usual year-ended calculation of inflation incorporates stale information. Nor does it make a distinction between stable above-target inflation and declining above-target inflation. While their models are more sophisticated than this, it seems something has been lost in an effort to simplify communications. Even more perplexing, the speech did not mention wages growth at all.
We also note that the concentration of growth in the public demand segment is part of a broader pattern where the non-market sector of the economy (health & social care, education and public administration – not all public sector) accounts for a larger share of the economy. Combined with growth in new public spending, at 2.2%qtr, outstripping the rest of the economy, these three industries accounted for the bulk of employment growth over the past year or so.
Baristas and care workers
This shift has several implications. First, strong growth in non-market sectors has only a weak link to overall price pressures, because their prices are not determined in markets.Second, taken together, these sectors generate less GDP or output per hour worked (i.e. labour productivity) than the market sector does. Arithmetically, as the share of non-market sector activity rises, measured economy-wide labour productivity falls, as we have previously highlighted. This is about more than different growth rates in productivity. In the transition, where the non-market sector’s share of the economy is rising, it is also a consequence of the differing productivity levels.
Third, measured aggregate productivity is further dragged down because measured labour productivity within the non-market sector has fallen, according to the annual national accounts. This is the result of the shifting mix of occupations within the ‘care economy’ towards relatively low-paid childcare and age & disability care workers – much like the ‘barista phenomenon’ we identified previously.
In the Q&A following her recent speech, RBA Governor Michele Bullock acknowledged that many of these additional workers are doing important jobs with significant positive spillovers for the rest of the community – teaching, nursing, caring for small children and the elderly. What was not acknowledged was that this period of weak demand and an apparently strong labour market may well be a transition phase. Instead, it is being interpreted as a signal that the trend in supply capacity is even weaker than previously believed.
This means that, when the RBA Board leaves the cash rate unchanged next week, it is also likely to keep its messaging similar to recent RBA communications. While there is an argument to pivot the language to signal that they are getting closer to the point of cutting rates, we do not expect that they will.
When the ramp-up ends
Further out, there is the question of what happens when the non-market part of the economy is no longer increasing as a share of the overall economy, which will happen sooner or later. To maintain overall growth, the market sector would need to see faster growth than it has recorded recently. However, historical experience suggests that when one or a few sectors are expanding their share at the expense of all the others, it takes a while before those other sectors’ growth rates bounce back.
The Australian economy could therefore be in for a period of even more subdued growth and much weaker employment than has occurred recently. And while we expect private investment to become a more prominent driver heading into 2026 – reflecting the need to expand capacity, transition to lower carbon emissions, and adopt new technologies – this may be slow to gain momentum.
It’s unclear how long this relative expansion in public demand will continue. Although the ABS reported that growth in NDIS spending was subdued in the September quarter, this and other programs might not have completed their ramp-ups. There are also risks around next year’s Federal election, both from additional boosts to public demand in the lead-in and potential changes flowing from the election outcome. In the short term, then, this shift might have further to run.
The risk is that a period of transition to a new economic configuration is misinterpreted as an ongoing trend. In that case, the shakeout once the transition ends could come as a shock.
Cliff Notes: Growth Headwinds
Key insights from the week that was.
Australia’s Q3 National Accounts disappointed expectations with GDP up just 0.3% (0.8%yr) as the gap between public and private demand widened – the latter now stalled for six months. While partly explained by the ‘reallocation’ of electricity spending by households to the government through energy rebates, the majority of the divergence comes as a consequence of prolonged weakness in real incomes, elevated interest rates and a historically-high tax burden. Highlighting the cumulative impact on the economy, Q3 marked the sixth consecutive quarterly decline in per capita GDP, the longest (but not deepest) contraction since the 1950s, when official records begin. In this week’s essay, Chief Economist Luci Ellis considers the consequences for productivity and monetary policy.
Looking into the detail of the National Accounts, it is hardly surprising that the primary contributor to the Q3 surprise was household consumption, flatlining in Q3 to be up just 0.4% over the year. The underlying picture for real household disposable incomes was more constructive owing to the stage 3 tax cuts and disinflation, but the 0.8% gain was saved not spent – a result foreshadowed by the Westpac Consumer Panel. On current data, the latest updates on retail sales and experimental measures of household spending point to a solid lift in consumption in October, but our measure of card activity cautions that shifting seasonal patterns around end-of-year discounting are likely to distort affected monthly reads, as occurred last year. Looking to 2025, income and saving dynamics stand as significant headwinds for the recovery in consumption growth.
The external sector also provided little support for GDP in Q3, the current account deficit narrowing slightly from a materially downwardly revised figure of –$16.4bn to –$14.1bn in Q3. The terms of trade are still elevated but have fallen back over the past year; export volumes are also struggling as import volumes gain steadily, albeit recently at a slower pace. While net exports have added 0.1ppts to growth in both Q2 and Q3, prior weakness saw the external account subtract a percentage point from GDP growth over the year.
Before moving offshore, it is worth noting that the latest CoreLogic data highlighted a broadening in the nascent slowdown in Australian house price growth. Affordability is increasingly a concern across the capitals – price growth slowing in Perth, Adelaide and Brisbane, as buyers lower their expectations, and in outright decline in Sydney and Melbourne, where many would be buyers have been priced out. Supply remains critical for the affordability outlook; encouragingly, the firming uptrend in dwelling approvals is coinciding with tentative evidence of easing supply constraints for construction, balancing the risks around the pipeline. For more detail on our views around the housing market, see our latest Housing Pulse on Westpac IQ.
Ahead of tonight’s employment report, data received for the US continued to support a 25bp cut at the FOMC’s December meeting.
JOLTS job openings rose from 7.4mn to 7.7mn in October, reversing September’s decline. Looking through the monthly volatility, the trend remains consistent with a labour market that is slowly decelerating from a starting point broadly consistent with the pre-pandemic experience – when both wages and inflation were benign. The FOMC’s December Beige Book provided further evidence of labour market balance with some glimpses of downside risks, employment characterised as “flat or up only slightly across Districts” and wage growth having “softened to a modest pace”. Unsurprisingly, on inflation, prices were said to have risen “only at a modest pace... [and] Both consumer-oriented and business-oriented contacts reported greater difficulty passing costs on to customers”.
The ISM services survey corroborated the above view, the headline PMI falling from 56.0 to 52.1 in November and employment weakening from 53.0 to 51.5, both outcomes well below their five-year pre-COVID averages but still expansionary. The ISM manufacturing survey in contrast shone the spotlight on downside risks, the headline and employment indexes well below average at outright contractionary levels. The prices paid measures meanwhile remained consistent with consumer inflation at target. Altogether, this week’s data supports our expectation of a 25bp cut from the FOMC at their 17-18 December policy meeting. Tonight’s employment report and the upcoming November CPI report will inform on the risks to this view and the outlook for policy in 2025. Chair Powell and other recent FOMC speakers have made clear their policy decisions will be made meeting-by-meeting in a data and risk dependent manner.
US Jobs Report Preview: Implications for DXY and Gold (XAU/USD)
- US jobs report (NFP) is highly anticipated, with market expectations for a 200k payroll figure. The unemployment rate is also a key focus, with a potential slight uptick to 4.2%.
- A print in line with expectations could lead to short-lived US Dollar reactions.
- Gold prices are currently range-bound between $2600-$2660, with the 2655-2660 zone being a key resistance area.
- Goldman analyst forecasts and impacts of the NFP report.
Market participants are waiting on today’s jobs report from the US in a week that has seen a lot of choppy price action and uncertainty. The exception being a US equity and Crypto rally which has given markets a wee bit of optimism as the Festive season approaches.
NFP Preview: What to Expect
Heading into the jobs report and market expectations over US monetary policy have seen a significant shift over the past ten days. The probability of a 25 bps rate cut on December 18 has risen from 56% to a high yesterday of 78%, currently at 71%. Will the jobs data later today finally settle the matter?
Source: CME FedWatch Tool (click to enlarge)
The expected Non-farm payroll figure is 200k which would be a significant step up from last month’s disappointing print. Last month’s print was the worst in nearly four years, however it is key to remember the impact of hurricane Milton and the Boeing strikes. These all had a negative impact on job numbers and are all expected to reverse.
A job print above the 200k mark may prove to be less important than the unemployment rate which may be key. Markets are looking at a 4.1% print but I believe we could get a slight uptick toward 4.2%. Either way, should we get a print in the 4.1-4.2% range and a jobs number of 200k plus, I expect any immediate reaction by the US Dollar to prove short-lived. Similar to what we saw last month.
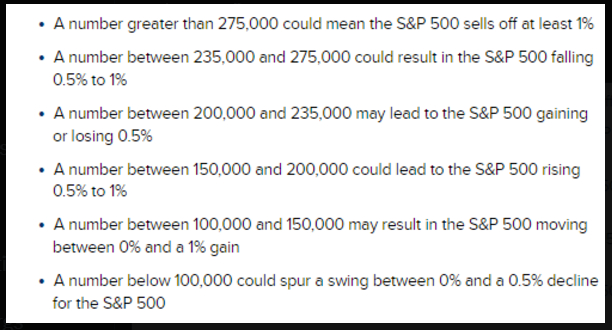
For interest’s sake I thought we could see what Goldman Sachs analysts are looking at from today’s report. Goldman’s analyst gives a scenario analysis for the NFP. The “sweet spot” he says is 150k-200k which he expects will see a 0.5-1% rally. Worst case is >275k which may lead to a Dec FOMC rate cut skip. Notably every other scenario he sees less than a 1% move.
Source: CNBC (click to enlarge)
Impact on the US Dollar Index (DXY)
Such a print should keep the Fed on track for a 25 bps cut at the upcoming meeting and thus should not have any lasting impact on market moves. This could lead to steady US Dollar weakness heading into next week.
The US Dollar is historically weak in December, usually weighed down by portfolio rebalancing and a pivot to more risky assets. The recent rise in US Equities and slight US Dollar weakness may be a sign that this has already begun.
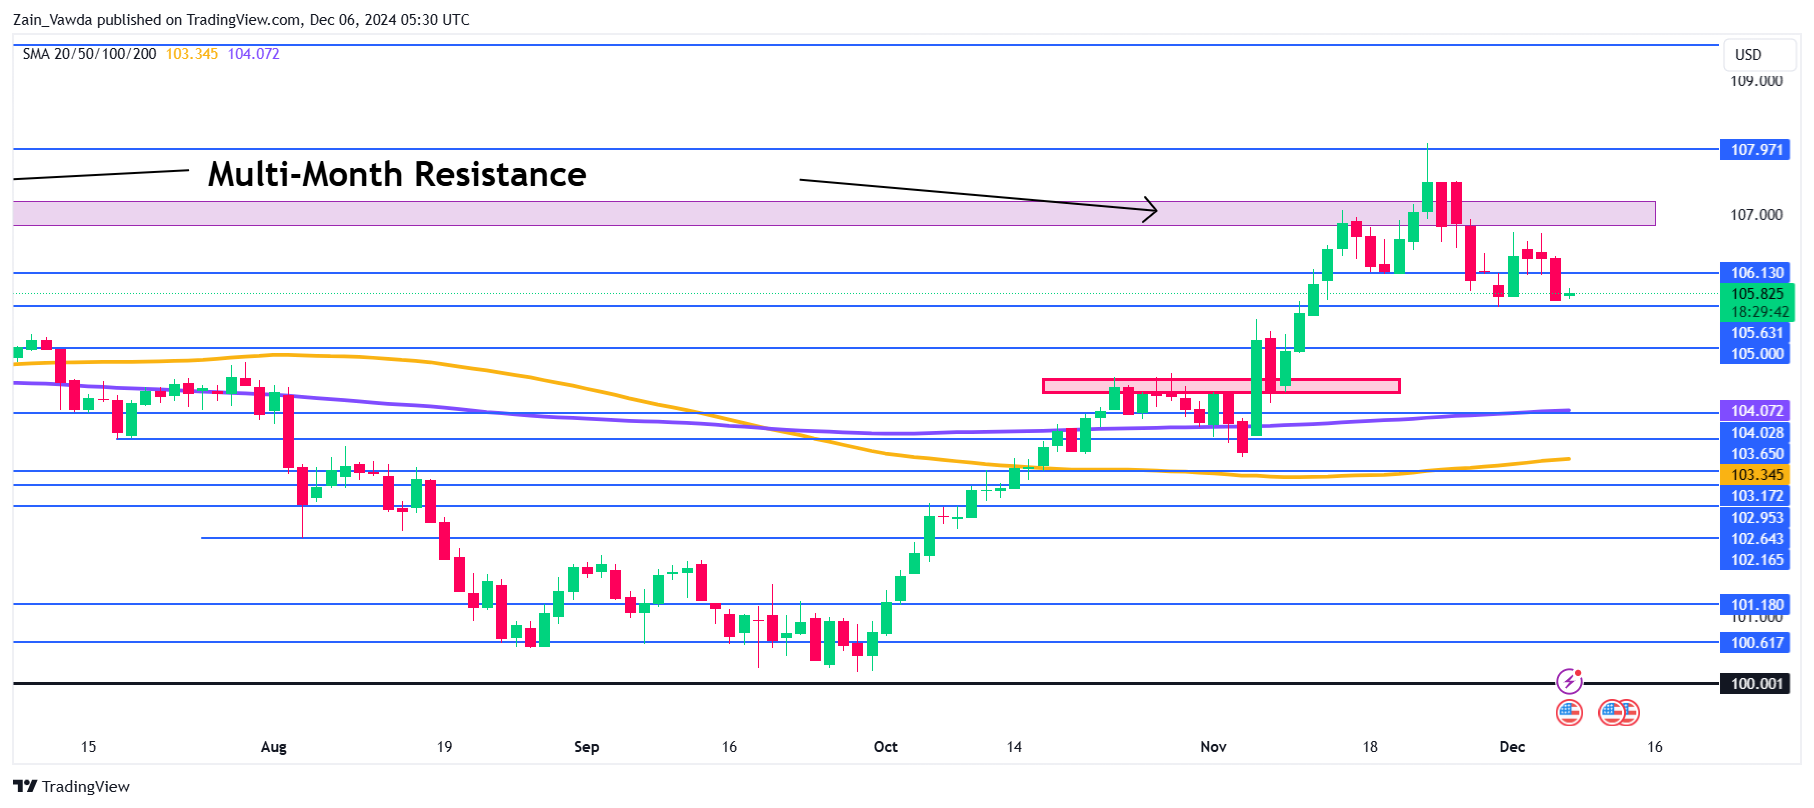
Yesterday saw the DXY print a bearish daily candle close which is a maubozu candlestick. No wick on either side suggests significant bearish pressure as the DXY is back at last week’s lows around 105.63.
A break lower brings the 105.00 handle into focus before the 104.50 handle.
The DXY needs to gain acceptance above the 107.00 handle if bulls are to continue their impressive run from the beginning of October.
US Dollar Index (DXY) Daily Chart, December 6, 2024
Source: TradingView (click to enlarge)
Technical Analysis Gold (XAU/USD)
Looking at the Gold chart below, the range continues to hold between the $2600-$2660 area. The Asian session brought wild price swings for the precious metal with a low of 2612 before rallying toward the 2644 handle.
The one thing that has piqued my interest is the amount of rejections we have had in the 2655-2660 range suggesting this zone remains a key area. For not it appears that risks are tilted to the downside.
If the nobs data comes out largely in line with expectations and rate cut bets increase, I wonder whether bulls will be able to facilitate a breakout and acceptance above the 2660 handle.
A significant increase in the average hourly earnings and a jobs number closer to 300k could result in significant USD strength which could push Gold below the 2600 handle and beyond.
Gold (XAU/USD) Daily Chart, December 6, 2024
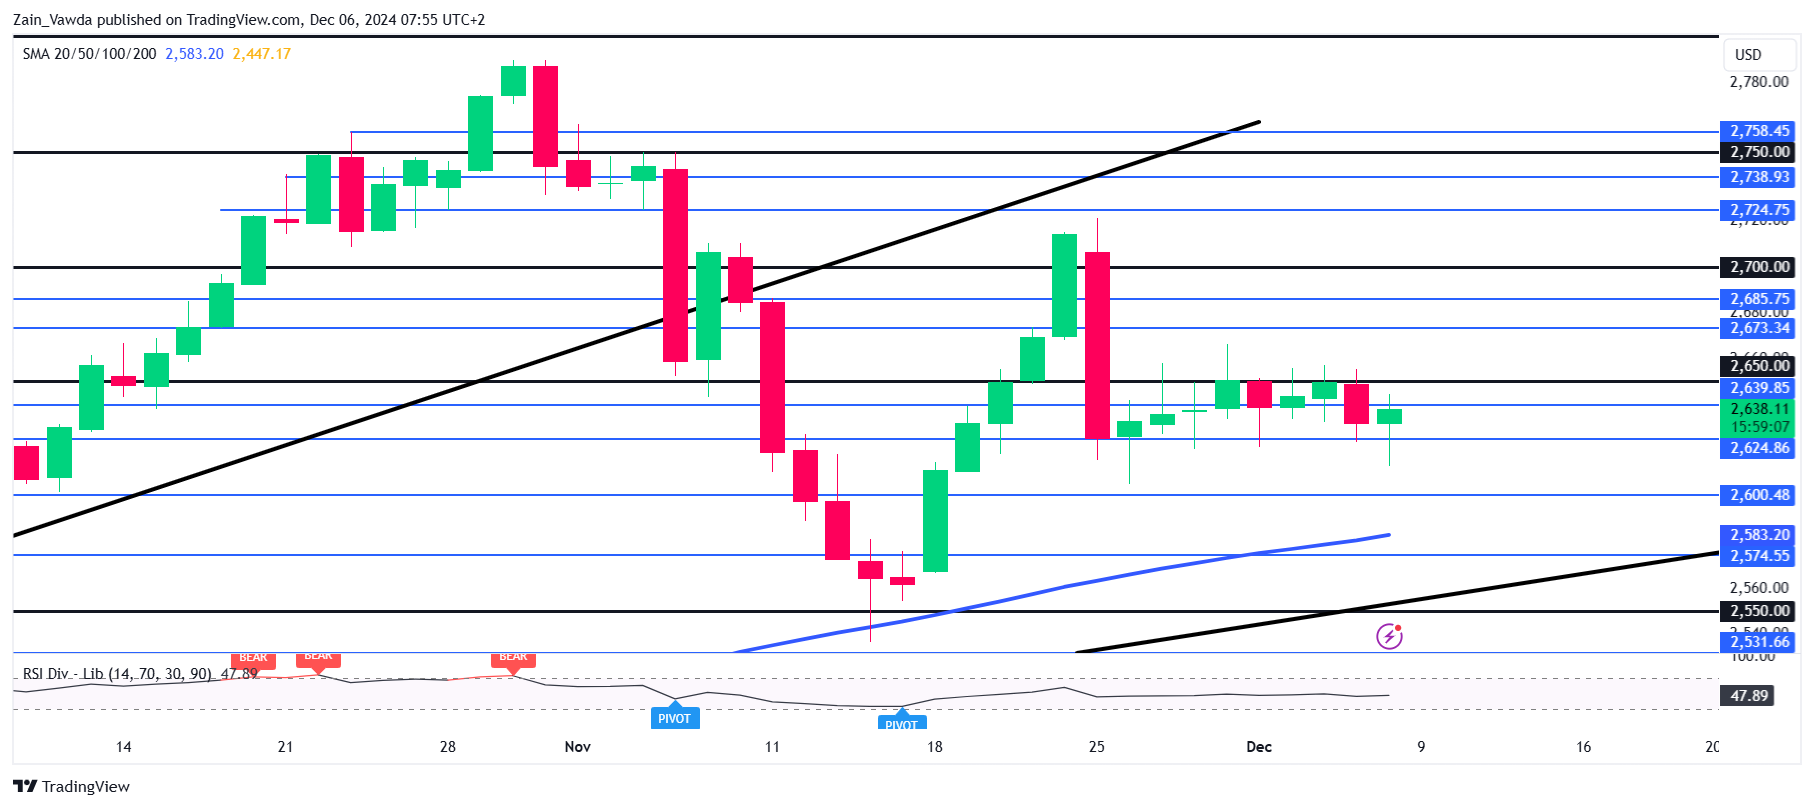
Source: TradingView (click to enlarge)
Support
- 2624
- 2612
- 2600
Resistance
- 2660
- 2675
- 2700