Sample Category Title
Euro Rally Ends, Eurozone GDP Expected to Accelerate
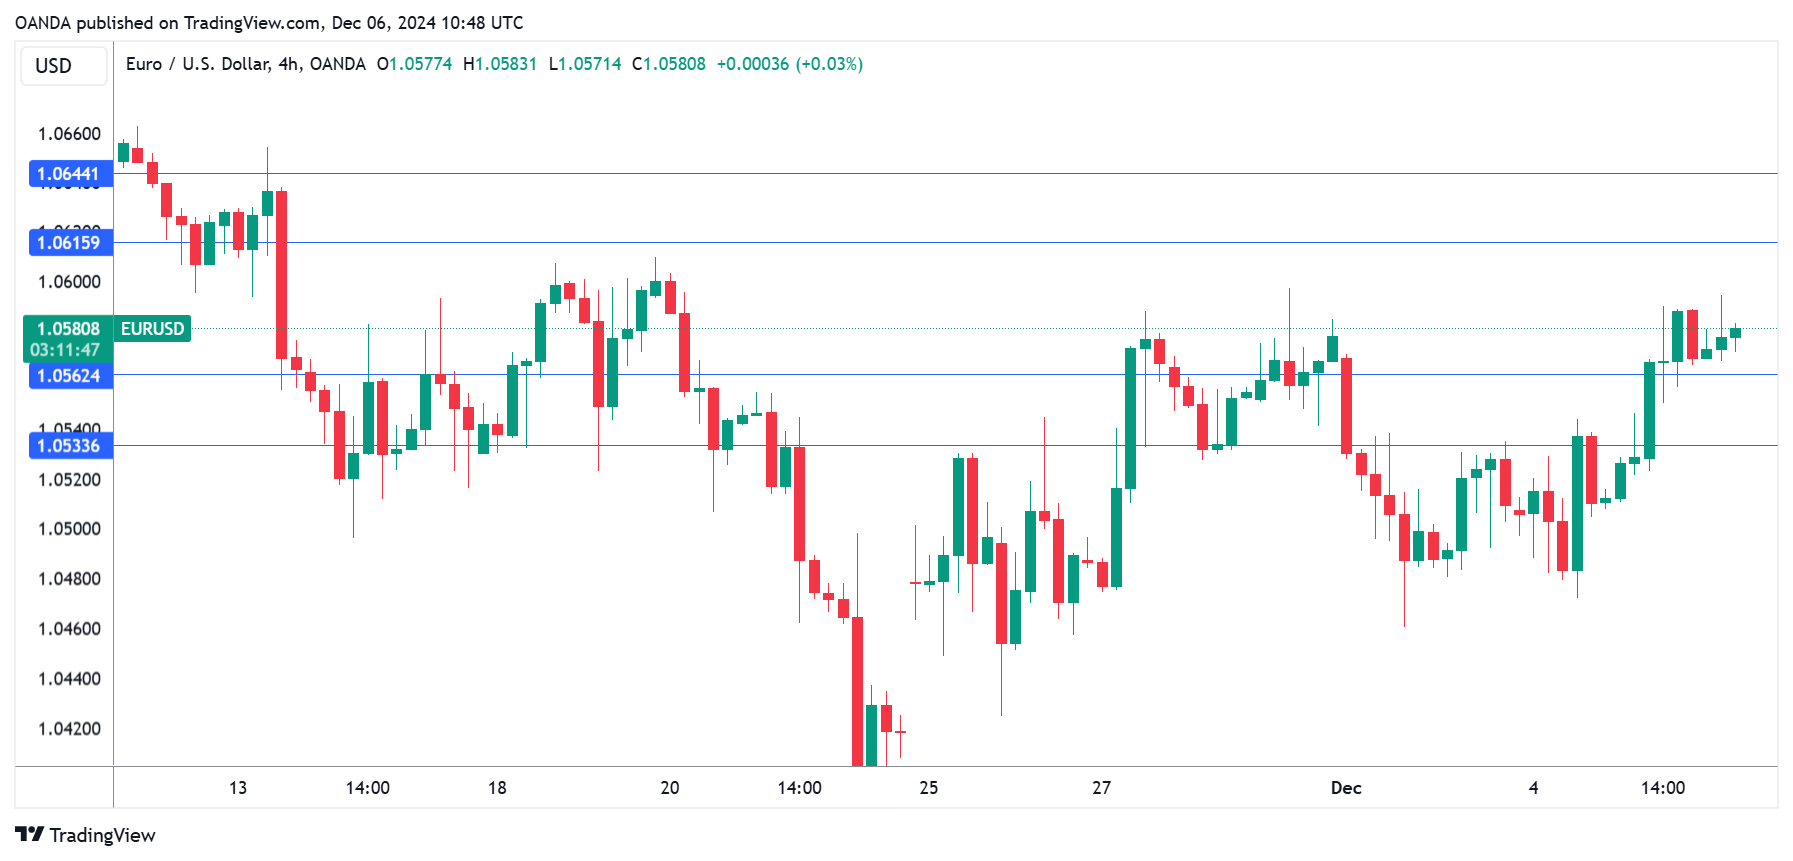
The euro is steady on Friday after jumping 0.7% a day earlier. In the European session, EUR/USD is trading at 1.0581, down 0.06% at the time of writing.
The eurozone wraps up the week with the GDP and job growth reports and the market is expecting an improvement. Third-quarter GDP is expected to improve to 0.4% q/q from o.2% in the second quarter. Job growth if forecast to tick upwards to 0.2% q/q, up from 0.1% in Q2.
In France, the political chaos continues. A no-confidence vote passed this week and has left the country without a functioning government. Prime Minister Michel Barnier resigned on Thursday after just three months in office. President Emmanuel Macron said he will name a new prime minister shortly but the political crisis could push up French interest rates and the country’s large debt.
Germany, once the powerful locomotive of the eurozone, has faltered badly and has hampered growth in the eurozone. This week’s German manufacturing data was dismal. The Manufacturing PMI remains mired in contraction and was unchanged at 43.0 in November. Factory orders for October declined by 1.5% after a 7.2% gain a month earlier. On Friday, industrial production fell 1% in October, after a 2% decline in September and shy of the market estimate of 1.2%.
The German Services PMI slipped into contraction in November and there is political instability, as the coalition German government collapsed in November. A snap election has been scheduled for Feb. 23, 2025.
The US wraps up the week with the nonfarm payroll report. With inflation largely contained, the employment growth is once again a key release can move the US dollar. The November report is expected to rise to a respectable 200 thousand, after a weak gain of 12 thousand in October, which was driven downwards by hurricanes and work stoppages at Boeing.
EUR/USD Technical
- EUR/USD faces resistance at 1.0615 and 1.0644
- 1.0562 and 1.0533 are providing support
US Dollar Index Outlook: Dollar Index in a Quiet Mode Ahead Release of US NFP Report
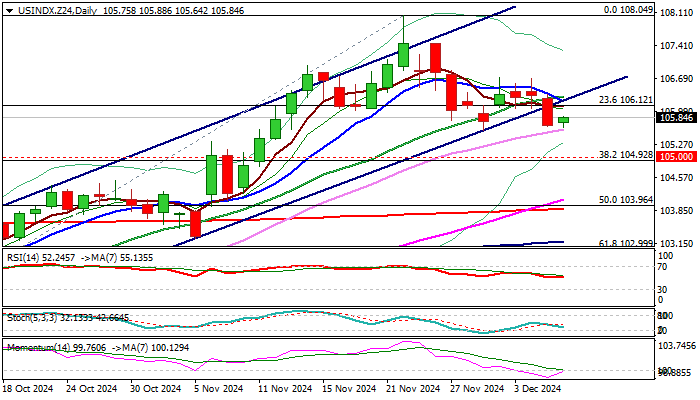
The dollar index is holding within a narrow range, in a quieted pre-NFP mode on Friday morning, but remains at the back foot following 0.5% drop previous day, which generated initial negative signal on close below bull-channel support line (106.08) also near Fibo 23.6% retracement of 99.87/108.04 uptrend.
Fresh bears found footstep just above next pivotal supports at 105.65/57 (daily Kijun-sen / Nov 27 higher low) and expected to remain in play while holding above these levels.
Technical studies on daily chart are mixed, as MA’s hold in a mixed mode (10/20 DMA bear cross vs 55/200 DMA golden cross, while 14-d momentum is heading north but still in the negative territory.
Bearish scenario would require firm break of 105.65/57 pivots to complete a failure swing pattern on daily chart and open way for deeper fall (150 zone marks next strong supports), while stronger bounce and possible weekly close within the bull channel, would signal another downside rejection and possible formation of a double bottom.
The dollar is looking for fresh direction signal from release of US Nov labor report today, with NFP expected to increase by 200K, following Oct slump to 12K (which is seen as temporary phenomenon, sparked by hurricane and strike of Boeing employees).
Average earnings are forecasted for 0.3% rise vs 0.4% rise previous month, while inflation in November is expected to tick higher to 4.2% from 4.1% in October.
Overall, the data suggest a healthy easing in the US labor sector that adds support to Fed’s signals for 25 basis point rate cut in the next policy meeting.
On the other hand, any significant NFP divergence from forecasted levels would generate stronger direction signals, with dollar to receive fresh boost on upside surprise and come under more pressure in November NFP disappoints.
Res: 106.10; 106.24; 106.71; 107.00.
Sup: 105.57; 105.00; 104.50; 104.08.
EUR/USD Outlook: EUR/USD Eyes Fresh Direction Signals from Fundamentals as Technical Studies are Mixed
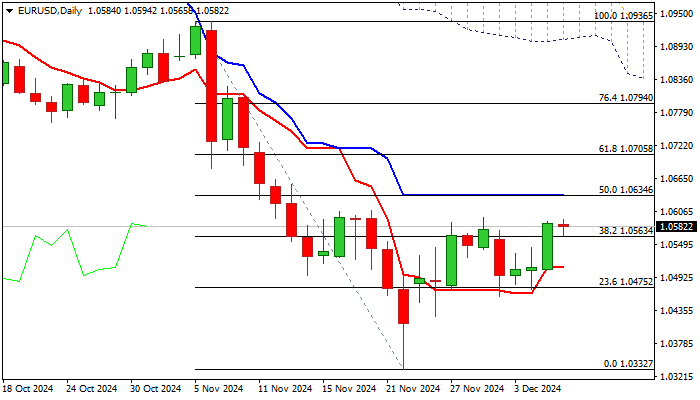
EURUSD is consolidating under new one-week high, posted after Thursday’s 0.8% jump.
Fresh advance broke again above Fibo resistance at 1.0563 (38.2% of 1.0936/1.0332), after last week’s recovery stalled at this zone, despite registering a weekly close above 1.0563.
Signals on daily chart are mixed, with 14-d momentum entering negative territory and conflicting MA’s, but countered by developing positive signal on weekly chart, following a bear trap under 1.0405 Fibo level (50% retracement of 0.9535/1.1275) and subsequent bounce.
However, confirmation of bullish signal will require not only repeated weekly close above 1.0563, but extension above former recovery top (1.0593) and violation of next key barrier at 1.0634 (50% retracement / daily Kijun-sen).
Otherwise, repeated upside failure would keep the downside vulnerable, with close below 1.0563 to weaken near-term structure and risk test of lower pivot at 1.0511 (daily Tenkan-sen) loss of which will be bearish.
From the fundamental side, unexpected drop in German Industrial production in October and Eurozone Q3 GDP in line with forecasts, did not have significant impact on the single currency, with focus shifting on US NFP data for possible stronger direction signal..
Res: 1.0597; 1.0609; 1.0634; 1.0682.
Sup: 1.0563; 1.0511; 1.0475; 1.0424.
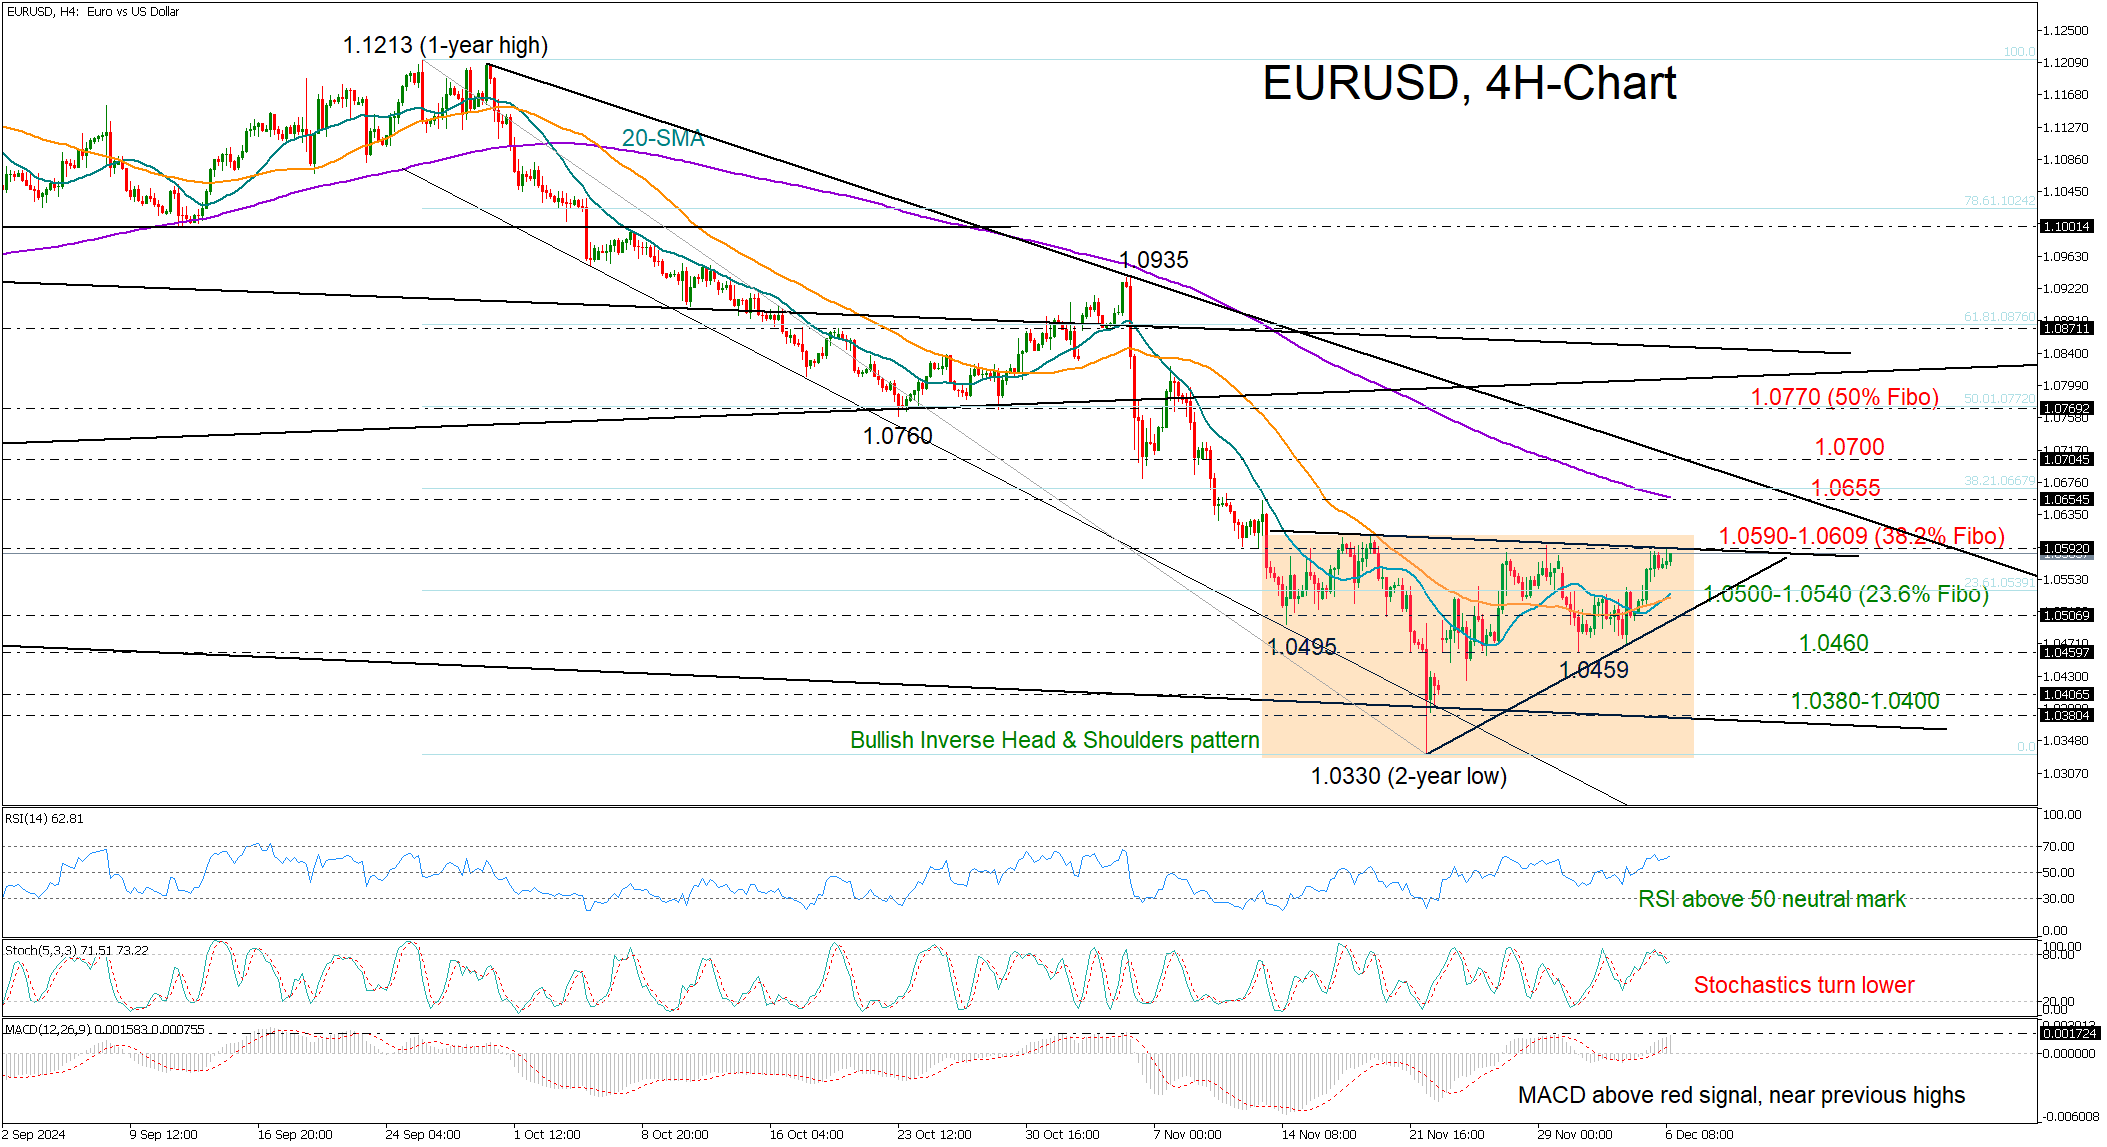
Is EURUSD Ready for a Bullish Reversal?
- EURUSD fights for a bullish reversal above 1.0600
- Upward moves may face choppy conditions
EURUSD has started to show some signs of life. The pair seems to have formed an inverse head and shoulders pattern around a two-year low of 1.0330 in the four-hour chart, sparking speculation that a positive turnaround could be around the corner.
The soft upturn in the 20- and 50-period simple moving averages (SMAs) are endorsing the encouraging trend signals. However, for the latest rebound to gain real traction, a sustainable close above the neckline at 1.0590-1.0600 is needed.
That said, the way higher may not be entirely smooth, with new obstacles likely emerging around the 200-period SMA at 1.0655 and then near the tentative resistance line at 1.0700. Even higher, the pair could face another wall somewhere between the 50% Fibonacci of the September-November downleg and the 1.0800 number.
On the flip side, if the pair slides below the 23.6% Fibonacci retracement at 1.0540—where the 20- and 50-period SMAs are converging—immediate support could be found around the 1.0500 level. A failure to hold at this point could open the door to further losses, potentially targeting the 1.0460 area or even the 1.0380-1.0400 zone.
In brief, EURUSD is poised for an upside reversal, with the 1.0600 level acting as a crucial confirmation point. However, a potential bullish trend may not take shape unless the pair breaks decisively above 1.0700.
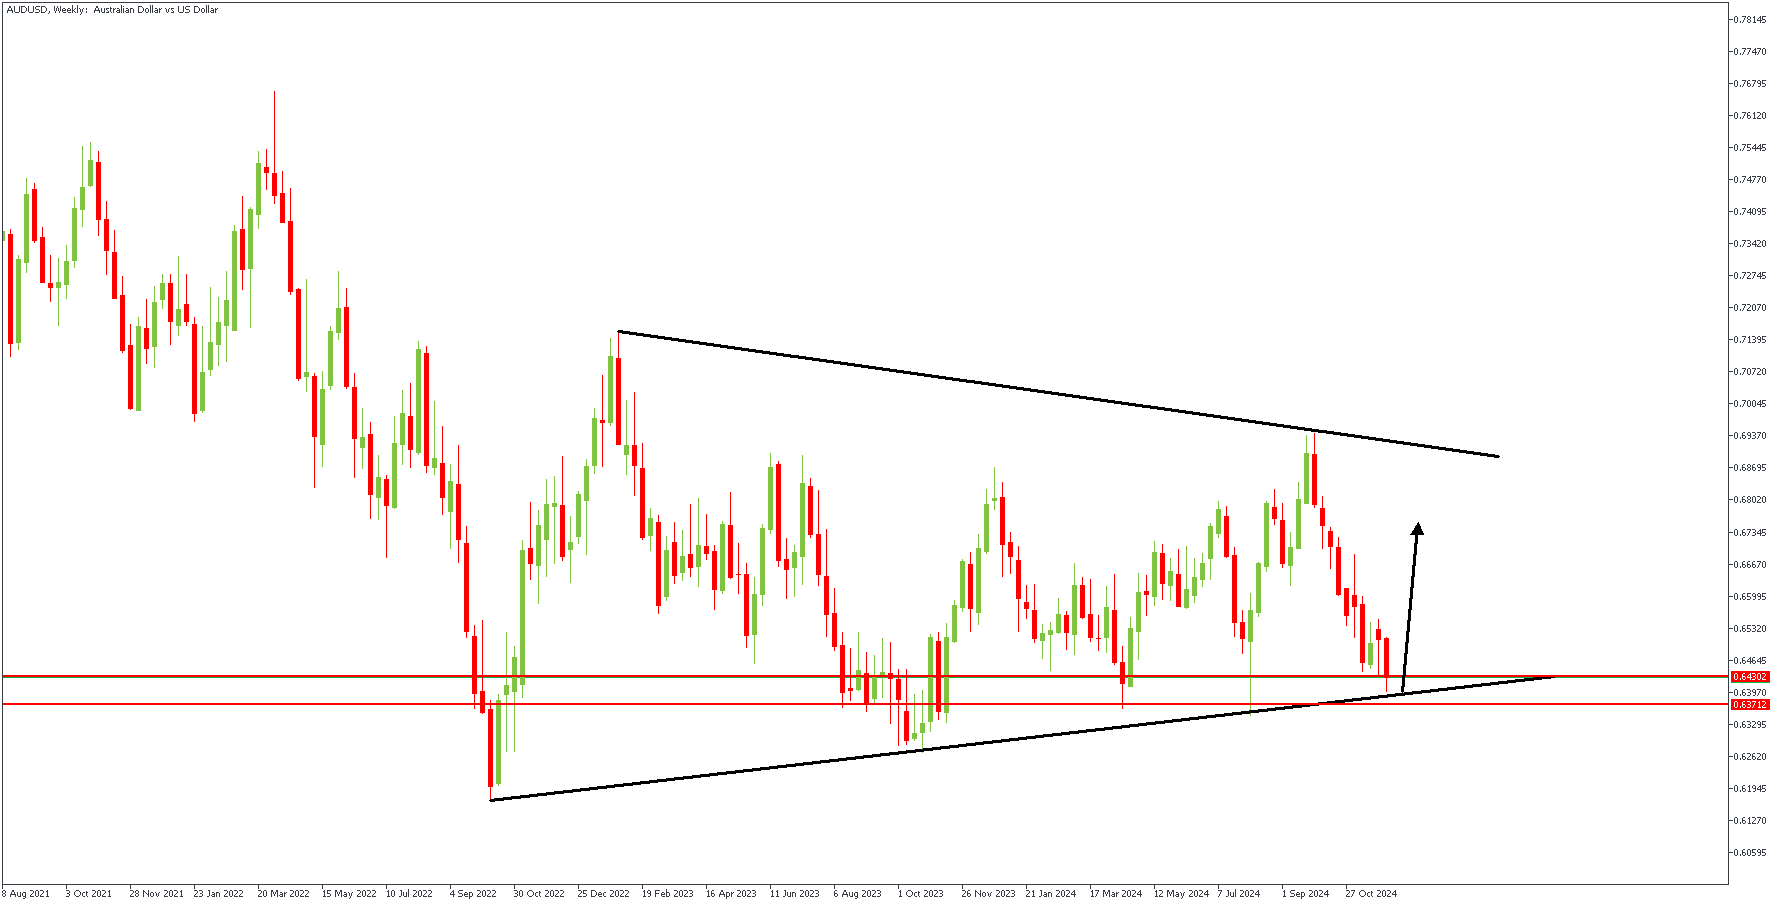
AUDUSD Looks Bullish Ahead of NFP
AUDUSD remains near its lowest levels since August touched on Wednesday and looks vulnerable to further declines. However, traders are holding back from making big moves and are waiting for the US Nonfarm Payrolls (NFP) report, which will provide clues on the Federal Reserve's (Fed) next steps regarding interest rate cuts. This key jobs data will likely impact the US Dollar (USD) and influence the AUDUSD pair's movement.
Expectations that the Fed might not ease its policies as much as previously thought, along with growing caution in global markets, are keeping the USD supported. Meanwhile, the Australian Dollar (AUD) faces pressure due to increasing bets that the Reserve Bank of Australia (RBA) could cut interest rates soon, following weaker-than-expected GDP data earlier this week.
Adding to the challenges for the Aussie Dollar are ongoing geopolitical tensions, economic concerns in China, and uncertainty about US President-elect Donald Trump's trade tariffs. These factors suggest that the Australian Dollar could face further downside risks. Even if AUDUSD manages a slight recovery, it may not last long and could be seen as an opportunity for sellers. As a result, the pair is on track to close the week lower, potentially marking its weakest weekly close of 2024.
AUDUSD – W1 Timeframe
The AUDUSD price chart on the weekly timeframe shows prices ranging within a wedge pattern, with the current price resting on the trendline support of the wedge pattern. There is also a critical pivot zone right around the current price, as highlighted by the two horizontal red lines. Although the demand zone could be more precise in the weekly timeframe, we will look to the daily timeframe for clarity.
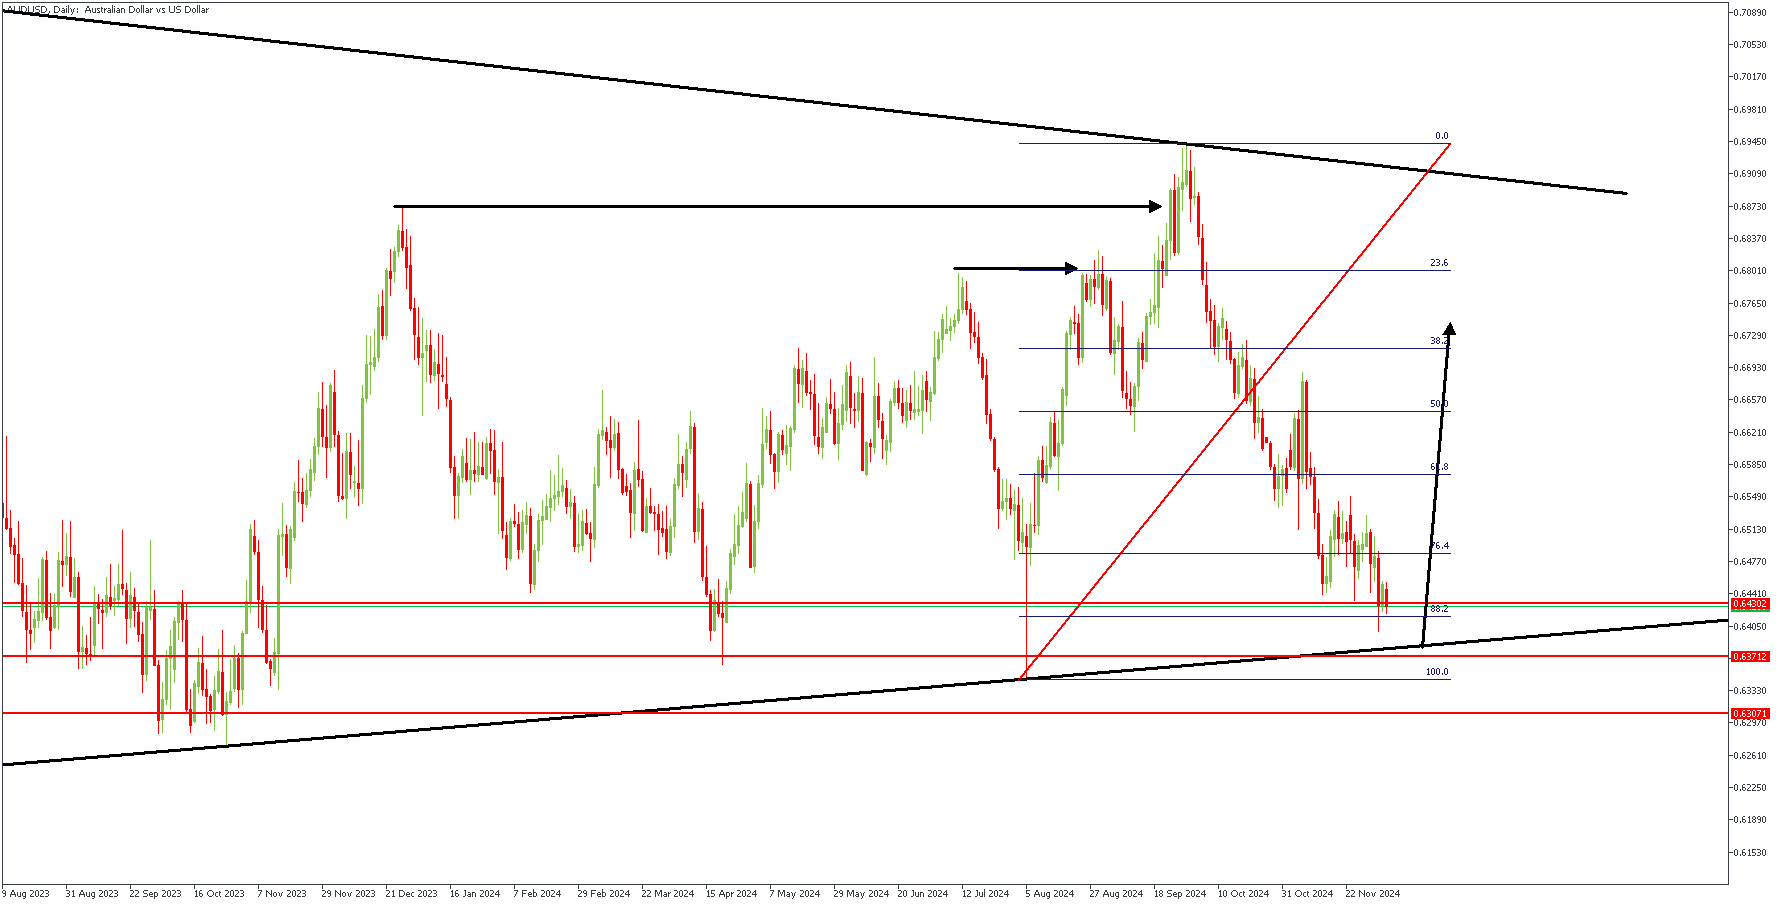
D1 Timeframe
We see that the wick hides the demand zone on the daily timeframe. In such a situation, the Fibonacci retracement tool can be trusted to clarify the matter. Hence, the price is around the 88% Fibonacci retracement level, and a reversal may soon be underway.
Analyst's Expectations:
- Direction: Bullish
- Target: 0.67650
- Invalidation: 0.62608
Liquidations in Bitcoin, Altcoins Cooling Off
Market Picture
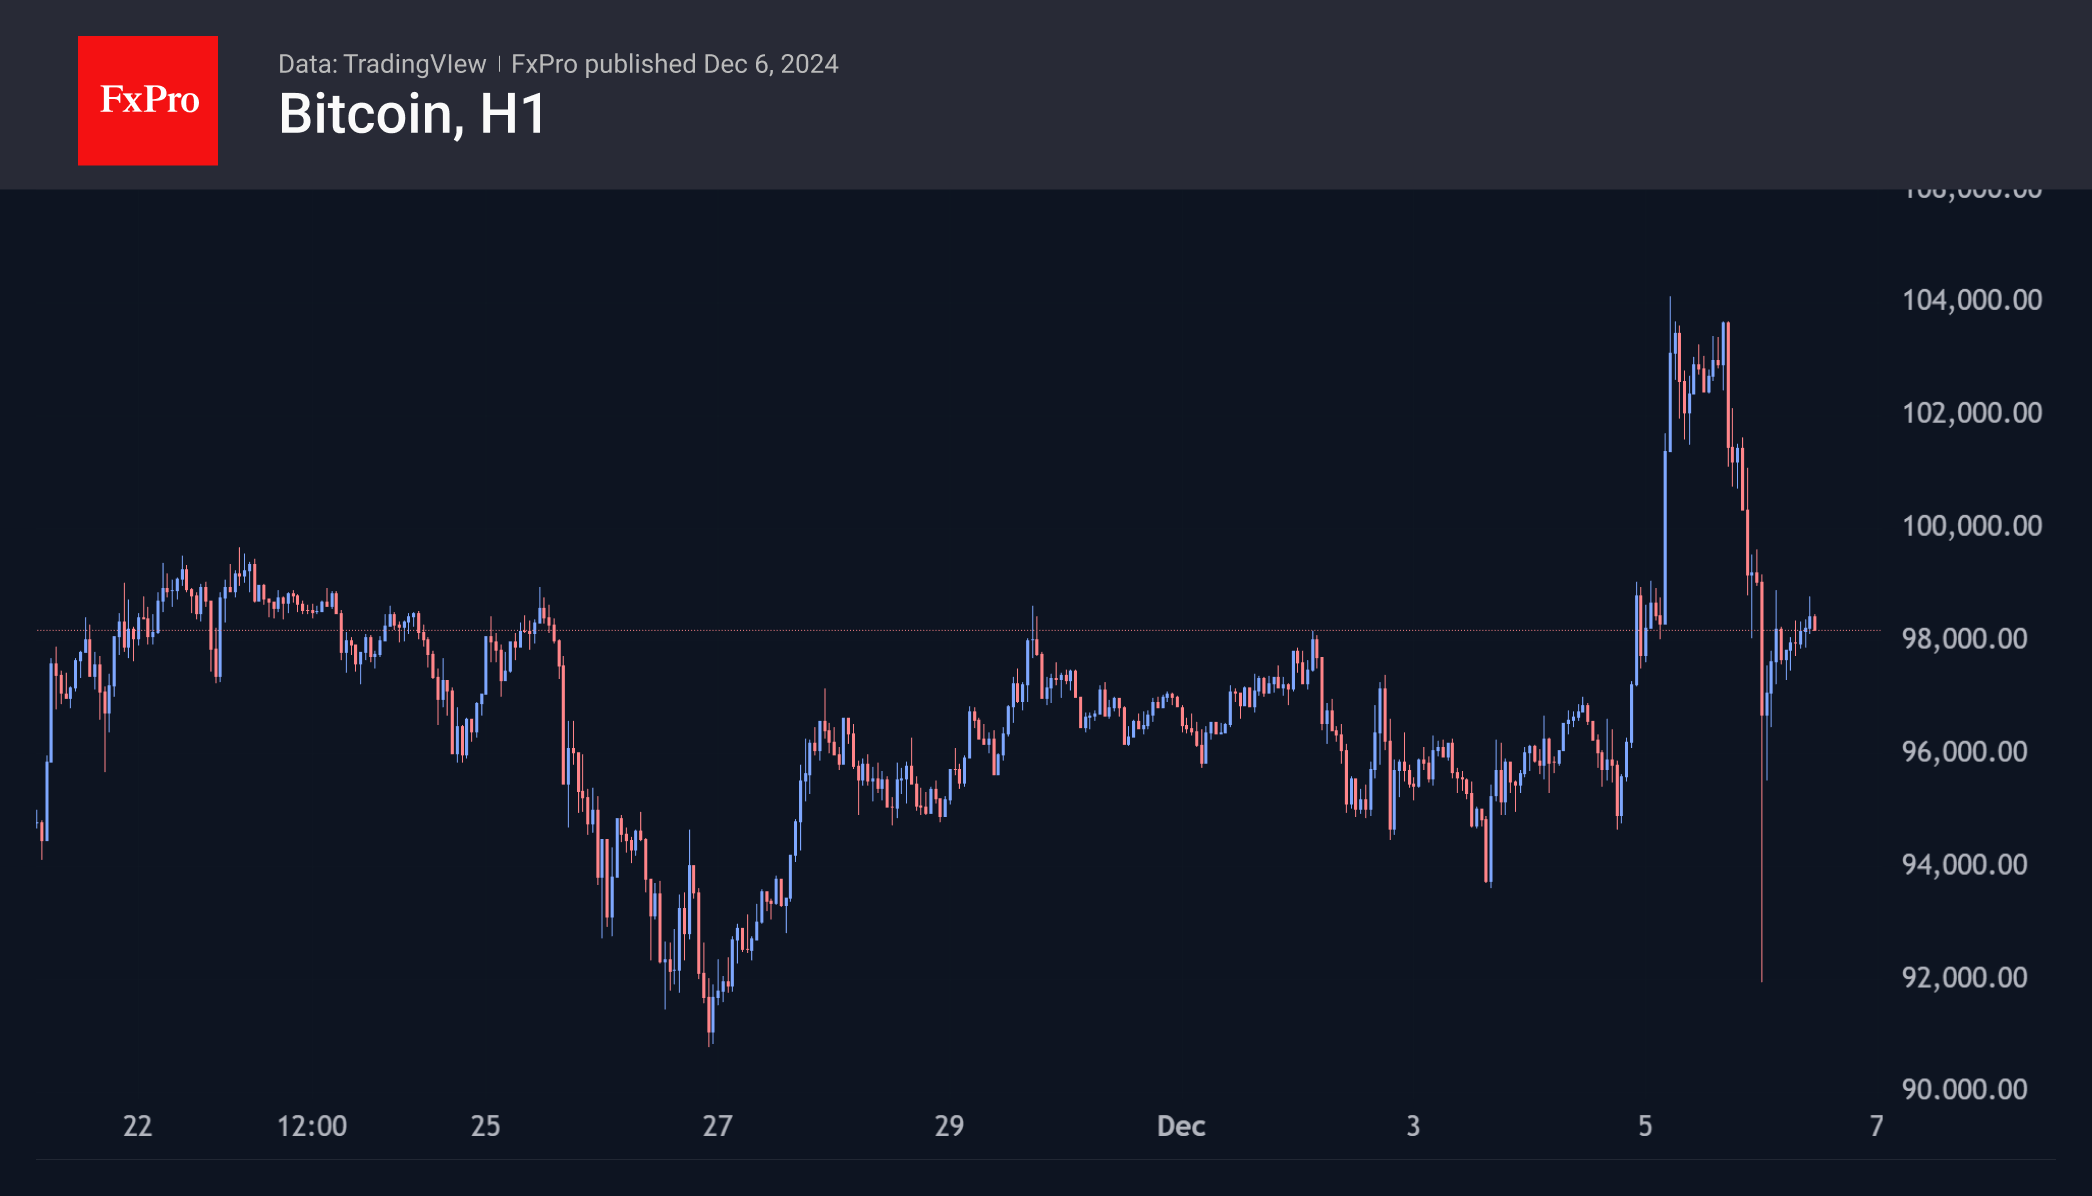
The crypto market cap has shrunk to $3.6 trillion, down around 2% in the last 24 hours. The main volatility has been in Bitcoin, with Ethereum affected to a lesser extent and a barely noticeable ripple at the altcoin level. This is a strong signal of a short-term shakeout but not a change in sentiment.
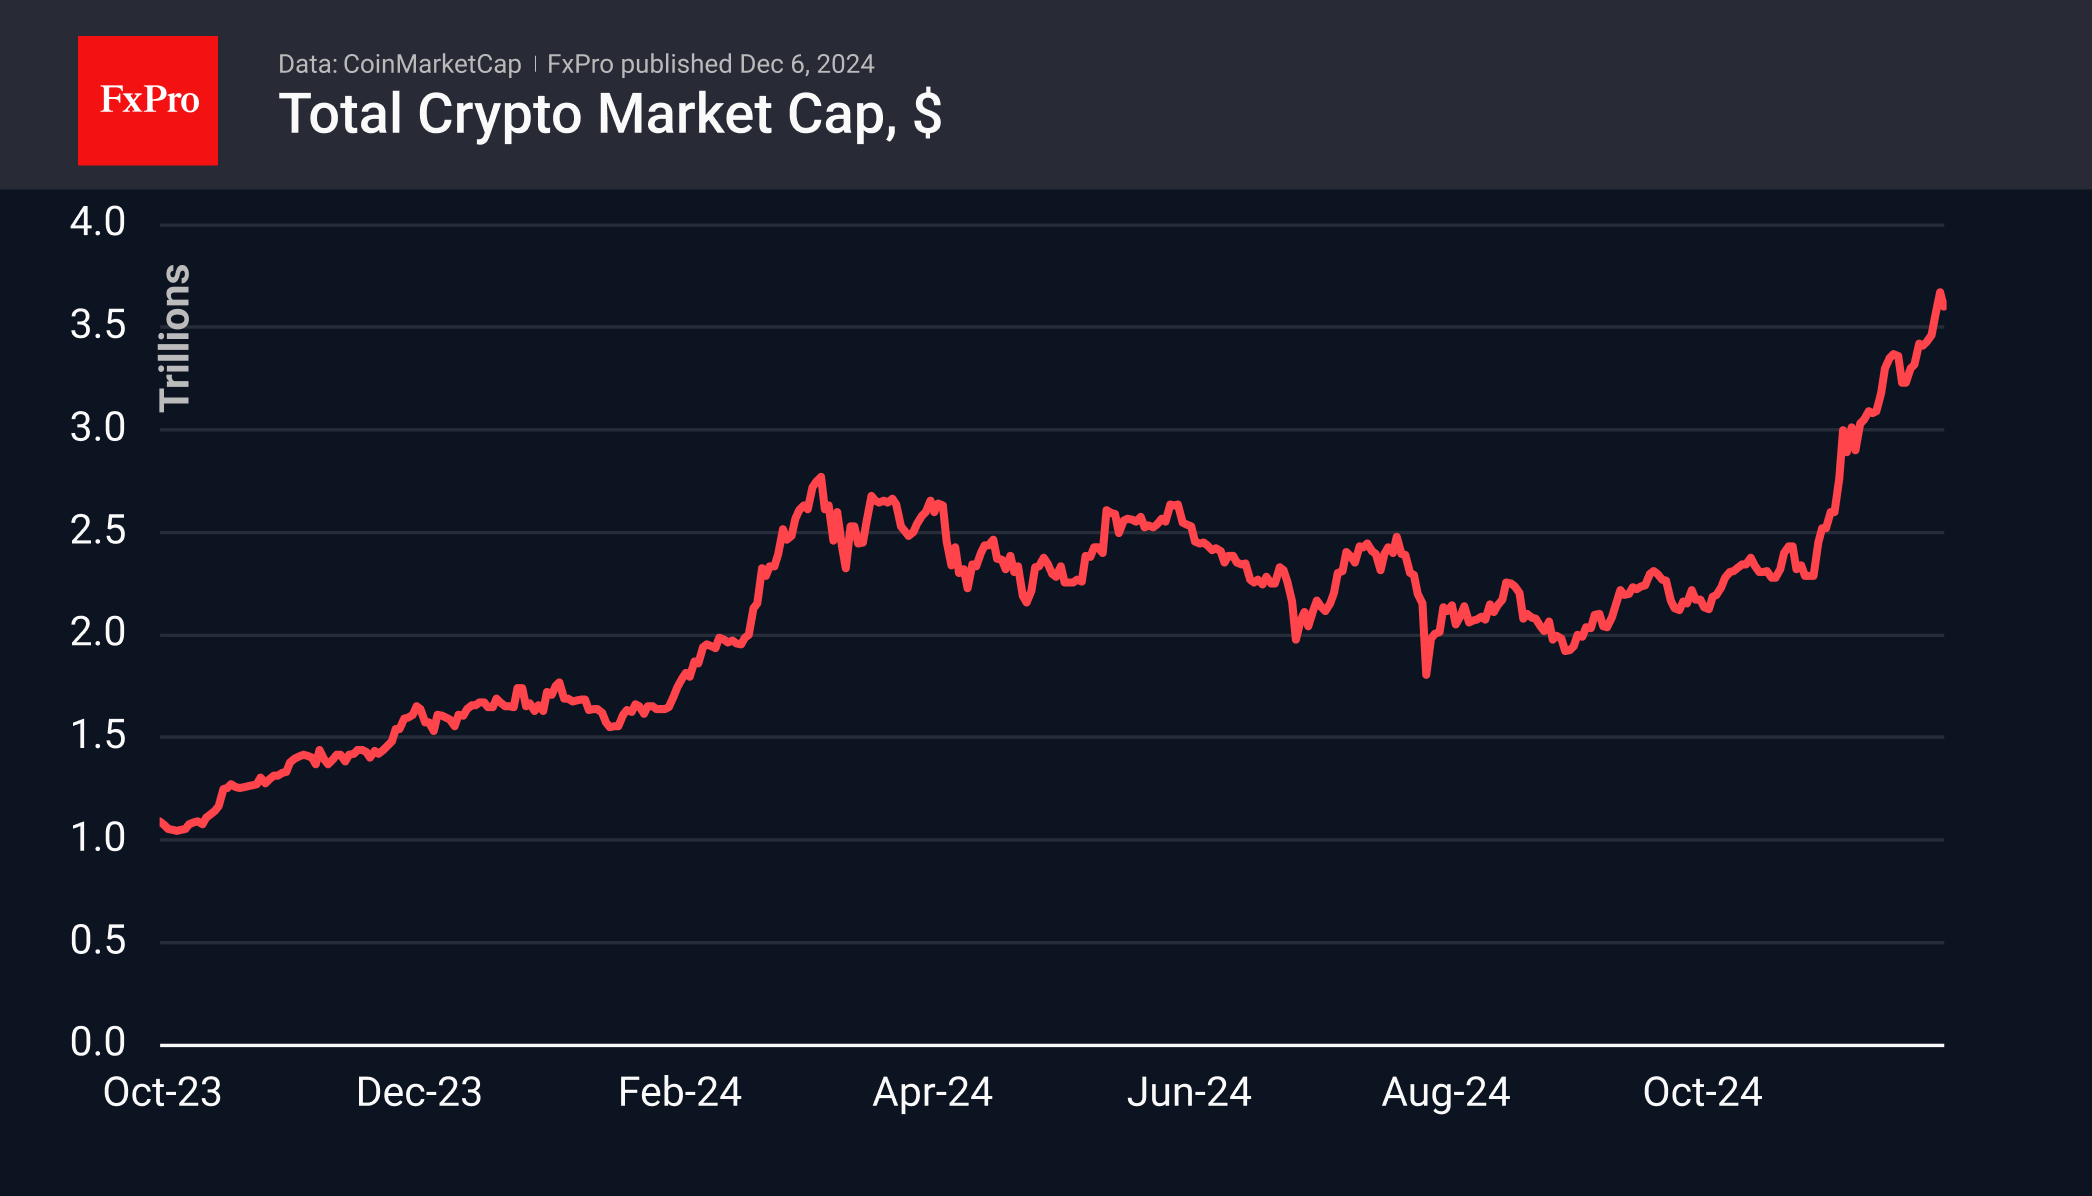
Thursday’s US session saw a strong wave of profit-taking, which quickly turned into a liquidation of marginal long positions. Both bullish and bearish liquidation created a swing range of almost 13% in less than 24 hours. At its lowest point, the price of Bitcoin was down to $91,000. By early European trading, it had stabilised just below $98,000, back to where it started the day on Thursday.
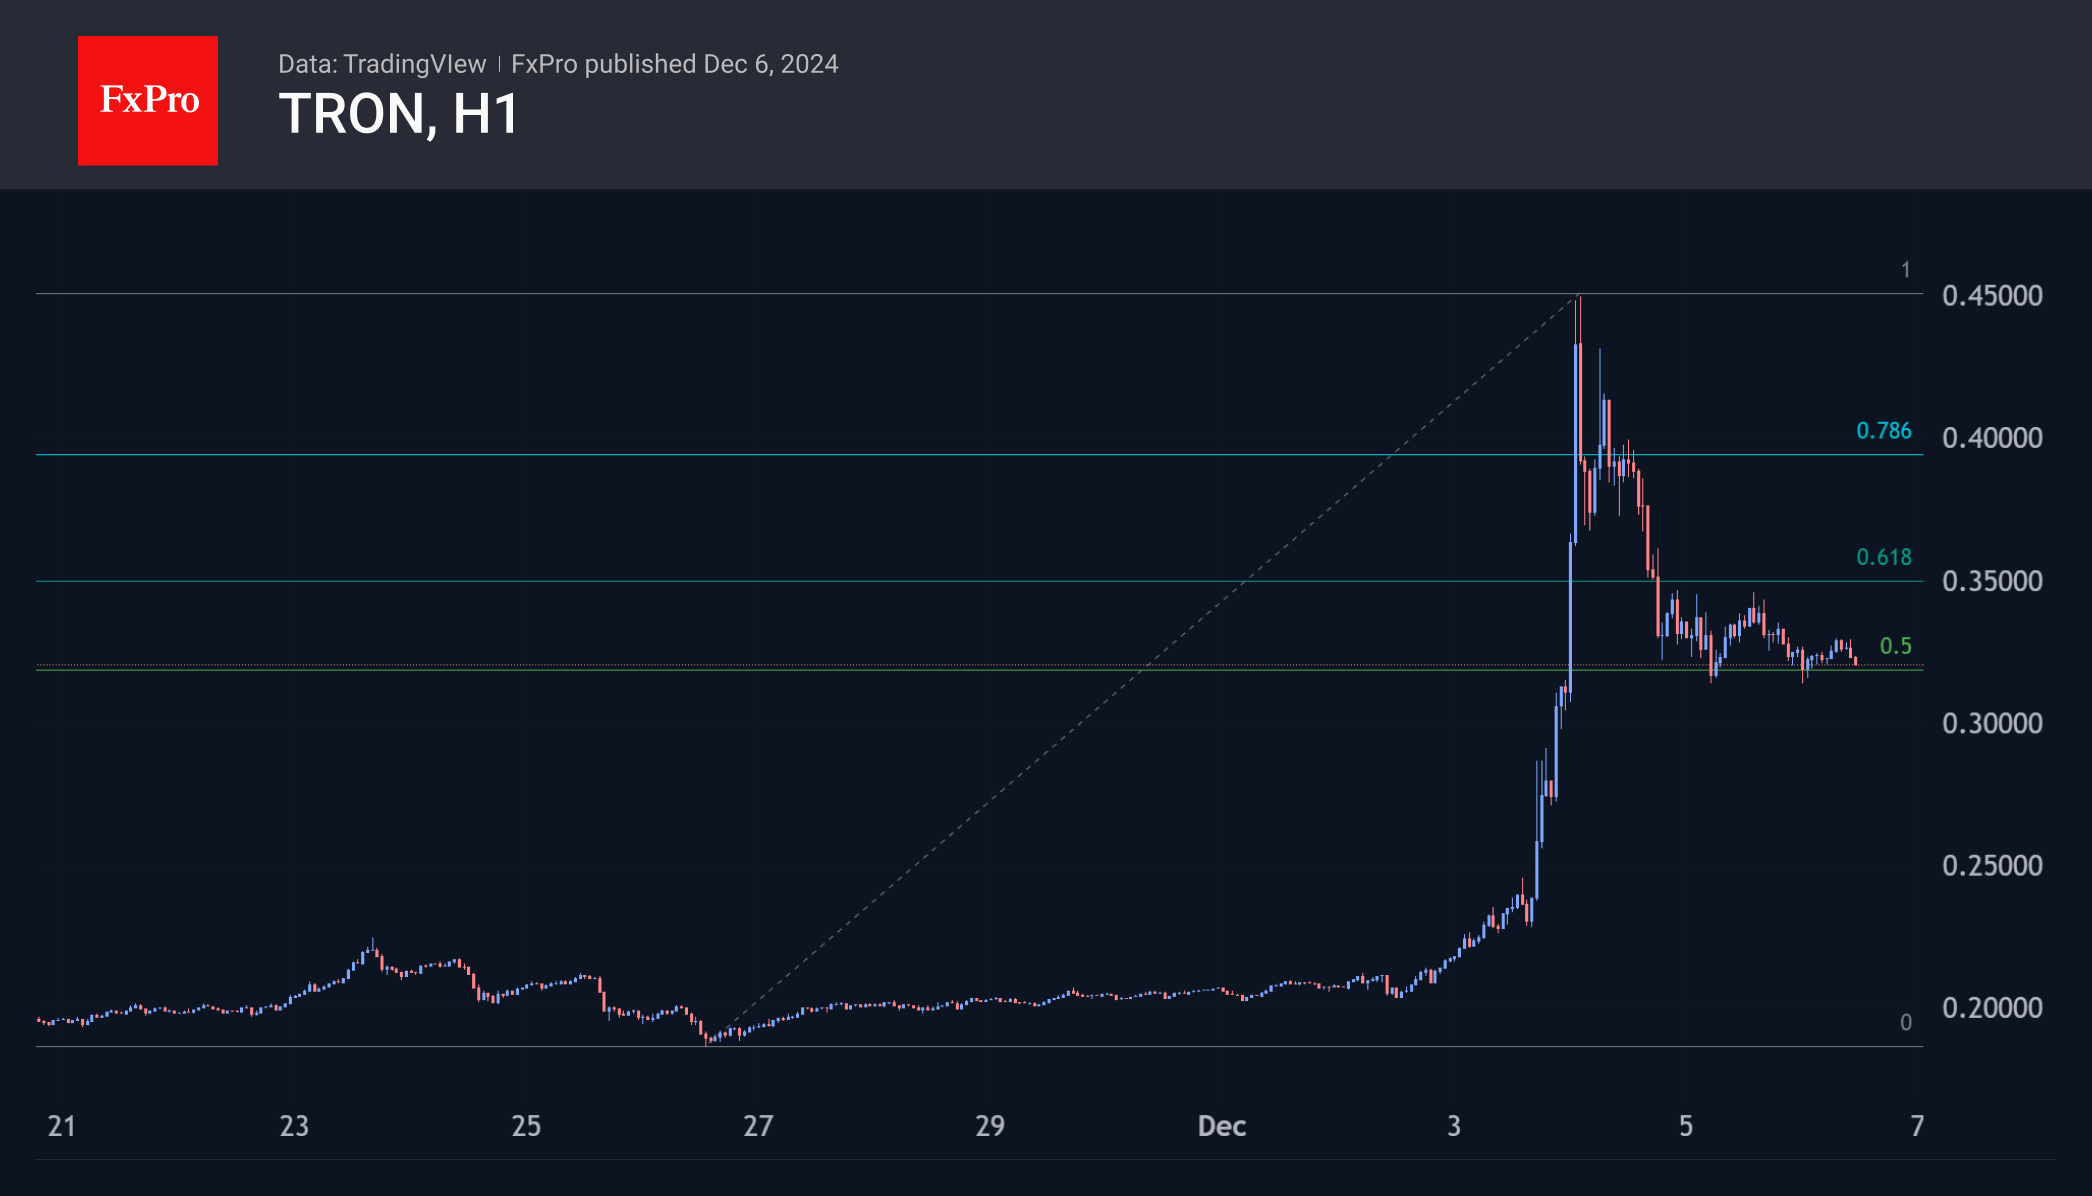
Other stars of recent flights are also cooling off. Tron has stabilised around $0.32, roughly in the middle of this week’s range. XRP is cooling off, pulling back to $2.30, which is near the 76.4% level from the early November lows.
News Background
There is a strong correlation between Bitcoin’s rise above $100,000 and Tether’s increased supply of USDT stablecoin, said CEO Paolo Ardoino. Over the past 20 days, the stablecoin’s capitalisation has increased by approximately $16 billion.
CryptoQuant identified significant institutional demand from US investors based on Coinbase’s premium dynamics.
Mining company Hut 8 will sell $500 million worth of shares. The funds will be used to expand the company’s data centre infrastructure and to purchase Bitcoin as a strategic reserve.
Venture capital firm Andreessen Horowitz (a16z) sees the integration of AI with blockchain, tokenisation and stablecoins as key areas of development for the crypto industry in 2025.
Justin Drake, one of Ethereum’s core developers, said the Solana network, touted as a “killer” of Ethereum, is not really a threat or even a direct competitor.
Arkham Intelligence noted that the bankrupt Mt. Gox exchange moved 24,052 BTC ($2.47 billion) to an unknown address. This is the first major move of the exchange’s assets since 12 November, when the platform sent 2,500 BTC to two unknown addresses.
EUR/USD: Additional Accommodative Nonetary Policy Guidance from ECB May be Forthcoming
- Pronounced weakness in manufacturing activities in Germany may spread to the broader Eurozone.
- ECB may be forced to remove its “restrictive monetary policy” forward guidance next Thursday and evolve into a “recession fighting” move.
- The medium-term downtrend of EUR/USD remains intact but a mean reversion corrective rebound may occur first below 1.0770 key medium-term resistance.
For next Thursday, 12 December European Central Bank (ECB) monetary policy outcome, market participants are likely to expect a 25-basis point (bps) cut rather than a more aggressive reduction of 50 bps based on short-term interest rate futures pricing.
If such a scenario occurs, it will be the fourth interest rate cut in the Eurozone since June to lower the key deposit rate further to 3%. Hence, it will be paramount to scrutinize the latest ECB’s forward monetary policy guidance for hints of further and or more aggressive monetary policy stance in 2025 via its latest macroeconomic projections which are released next Thursday as well, and ECB President Lagarde’s press conference.
Weakness in German manufacturing growth has spread to the wider Eurozone
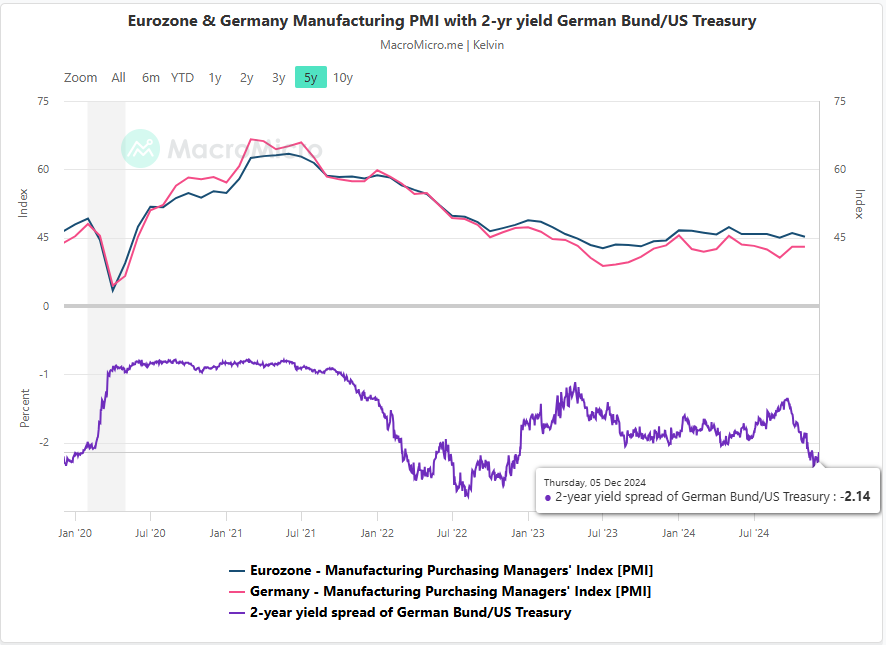
Fig 1: Germany, Eurozone Manufacturing PMI & 2-year yield spread of German Bund/US Treasury Note as of 5 December 2024 (Source: MacroMicro, click to enlarge chart)
“When Germany catches a cold, the entire Eurozone has the flu”. Germany, being the bellwether economy of the Eurozone has continued to flash out recessionary-liked leading economic conditions.
After a peak of 45.50 seen on the German manufacturing PMI at the start of 2024, manufacturing activities continued their downward spiral of deterioration and further contracted in November to 43.
Notably, the January 2024 peak of the German manufacturing PMI before it inched down further occurred ahead of the broader-based Eurozone manufacturing PMI that peaked later in May. Thereafter, it increased its pace of contraction to hit 45.2 in November from 46 in the previous month of October.
Therefore, if manufacturing activities in Germany continue to slip further in the red, it may drag down the entire Eurozone’s economic growth prospects.
This negative feedback loop mechanism has already been playing out in the two-year yield spread between the German Bund and the US Treasury Note where the yield spread peaked at -1.34% in mid-September 2024 and dropped significantly by 80 bps to hit -2.14% on Thursday, 5 December which was a two-year low (see Fig 1).
To negate the adverse effects of “Germany’s flu” on the entire Eurozone, the ECB may need to set a forward guidance in the upcoming meeting next Thursday, 12 December that restrictive monetary policy is over, and preventing recession is now the priority in the Eurozone.
EUR/USD is shaping a potential corrective rebound within its medium-term downtrend
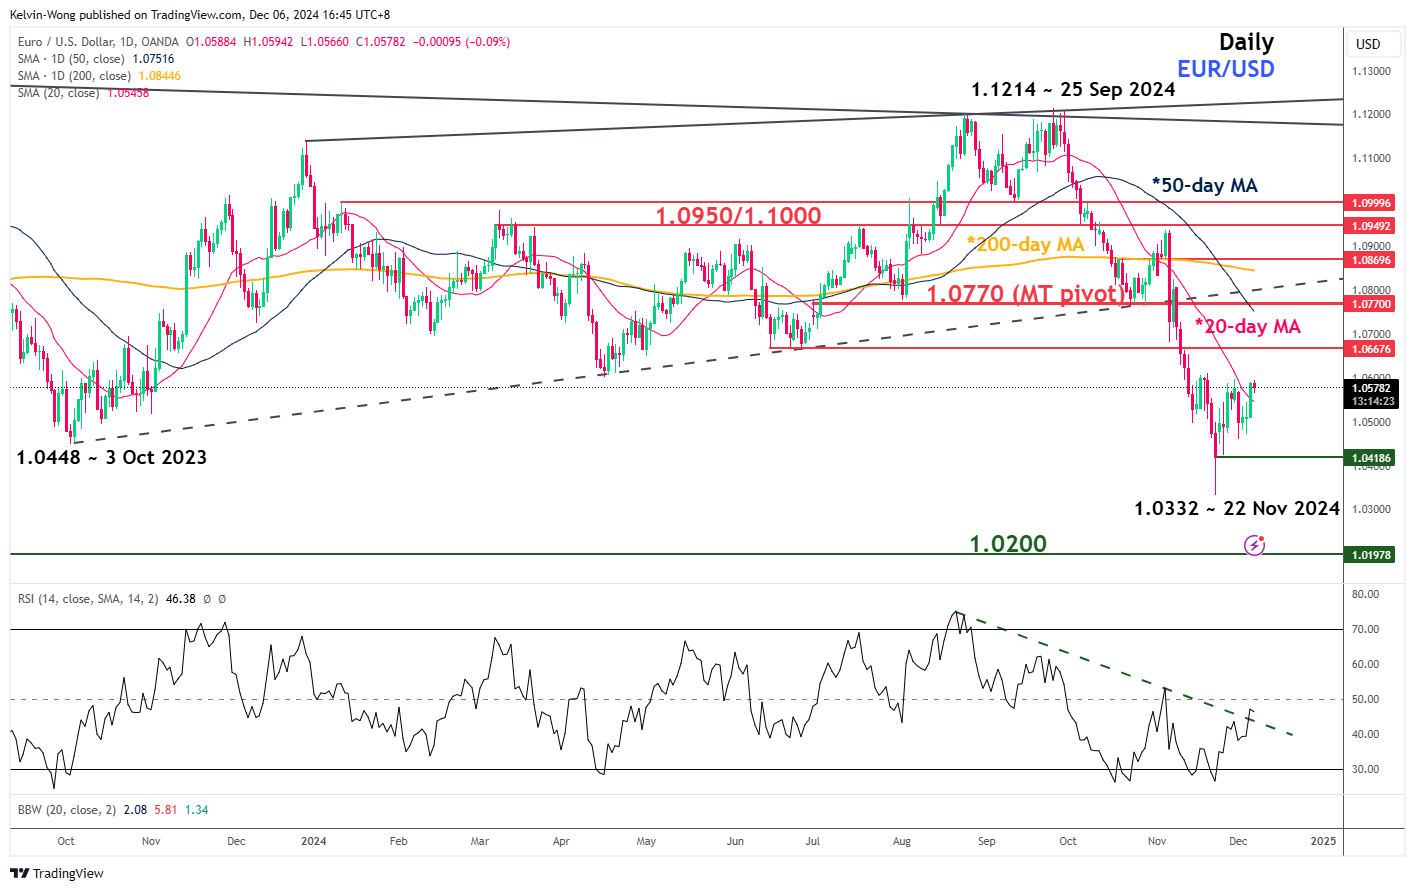
Fig 2: EUR/USD medium-term & major trends as of 6 Dec 2024 (Source: TradingView, click to enlarge chart)
In the lens of technical analysis, the directional movement of highly liquid tradable financial instruments does not move vertically but oscillates within broader trends.
Since its recent 52-week low of 1.0332 printed on 22 November 2024, the EUR/USD has consolidated in a sideway range configuration ahead of today’s key US non-farm payrolls data release.
Its daily RSI momentum indicator has just staged a bullish breakout above a key parallel descending resistance after it hit an oversold condition on 22 November, the same day as the current 52-week low (see Fig 2).
The current condition of the daily RSI indicator suggests that bullish momentum has surfaced to at least support a potential mean reversion corrective rebound scenario with intermediate resistance to watch at 1.0670, and above it exposes the 1.0770 key medium-term pivotal resistance before another round of impulsive down move sequence materializes to resume its medium-term downtrend phase.
Only a break below the intermediate support of 1.0420 reinstates a direct bearish tone to see the next medium-term support coming in at 1.0200.
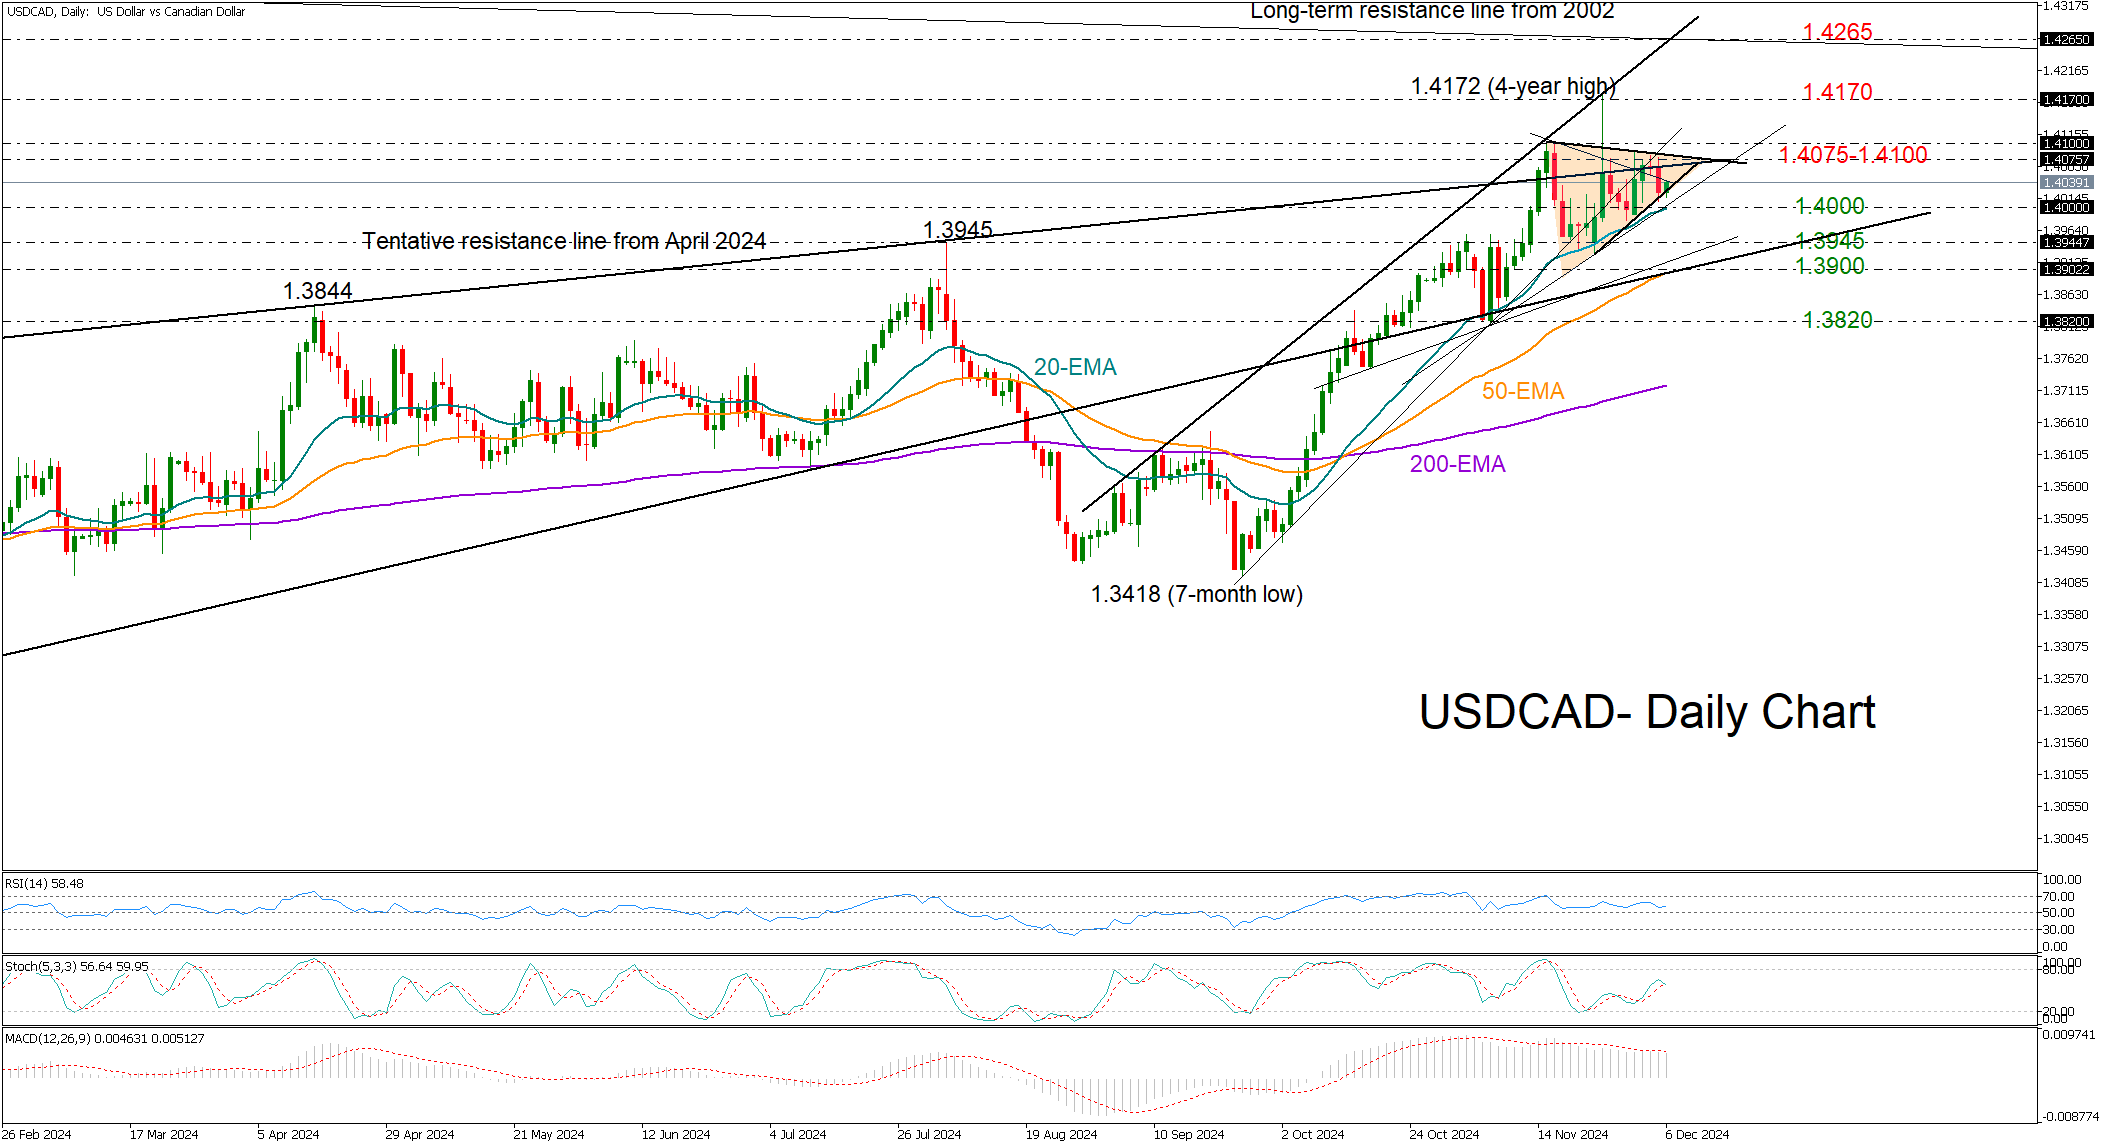
USDCAD Battles for Direction Within Triangle
- USDCAD stays on the sidelines ahead of November’s jobs data
- Bearish pressures likely but sellers need a close below 1.4000
USDCAD is currently treading water, caught in a neutral symmetrical triangle at the top of the two-month-old uptrend as traders are holding their breath ahead of the release of key U.S. and Canadian jobs data.
The technical indicators suggest the short-term bias is leaning to the downside as the stochastic oscillator is set for a negative reversal and the MACD continues to decelerate below its red signal line. Nevertheless, traders may stay patient until the price breaks above the 1.4075-1.4100 area or falls below 1.4000.
In the event of a bullish breakout, the pair may re-challenge November’s four-year high of 1.4172 and if this proves easy to overcome this time, it could speed up toward the resistance line at 1.4265. Next, the rally could pause around the 1.4370 region if the 1.4300 psychological mark gives the green light.
On the downside, a step below the 20-day exponential moving average (EMA) at 1.4000 could activate selling orders toward the 1.3945 barrier, while a deeper pullback could take a breather near the 50-day SMA currently at 1.3900. If the bears claim the latter, the downfall could stretch aggressively to 1.3820.
Summing up, USDCAD is holding a neutral-to-bearish bias, monitoring the 1.4000 and 1.4100 levels, as a break in either direction could determine the next significant move.
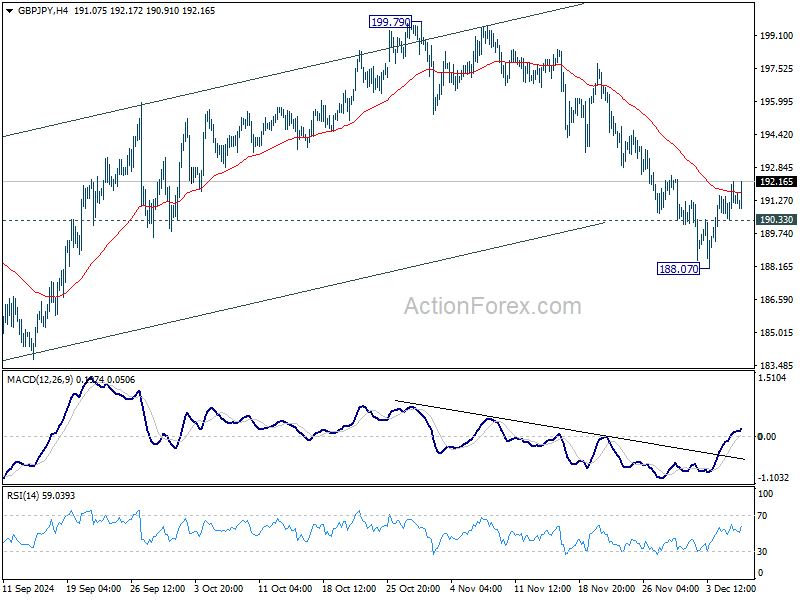
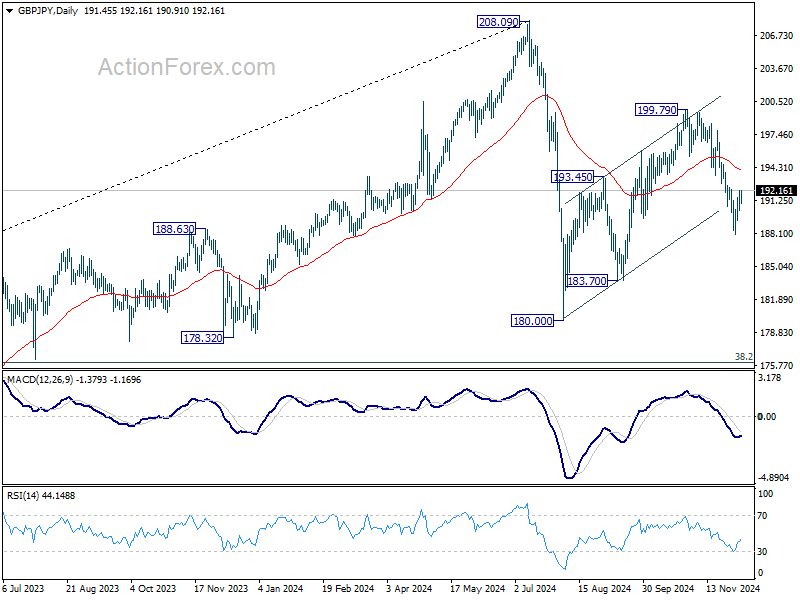
GBP/JPY Daily Outlook
Daily Pivots: (S1) 190.53; (P) 191.37; (R1) 192.39; More...
Intraday bias in GBP/JPY remains neutral first. While recovery from 188.07 might extend, further decline is expected as long as 55 D EMA (now at 194.07) holds. On the downside, below 190.33 minor support will turn bias to the downside for 188.07, and then 183.70 support. Firm break there will argue that whole decline from 208.09 is resuming, and target a test on 180.00 low next.
In the bigger picture, price actions from 208.09 are seen as a correction to whole rally from 123.94 (2020 low). The range of consolidation should be set between 38.2% retracement of 123.94 to 208.09 at 175.94 and 208.09. However, decisive break of 175.94 will argue that deeper correction is underway.
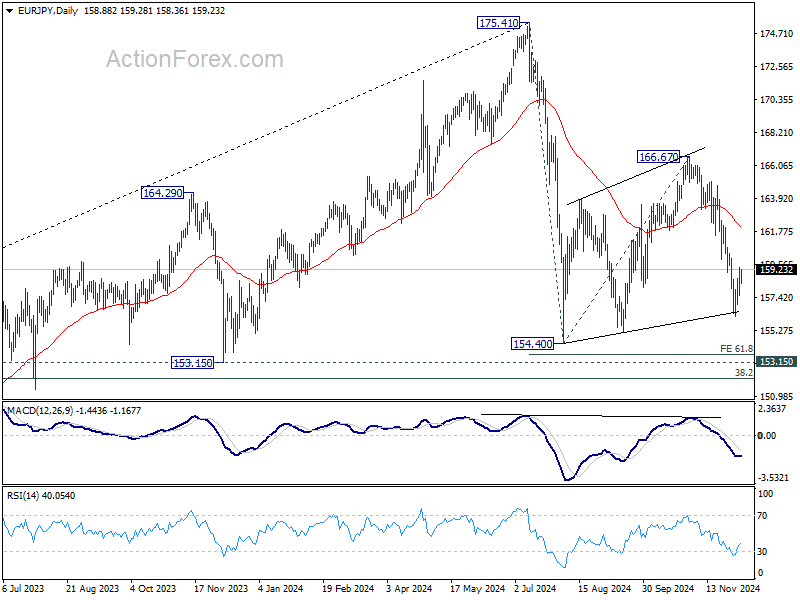
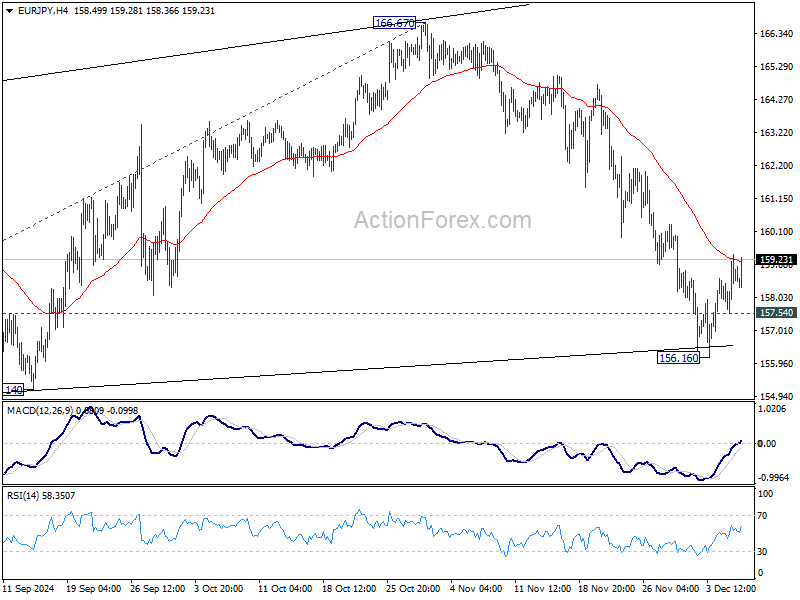
EUR/JPY Daily Outlook
Daily Pivots: (S1) 157.85; (P) 158.62; (R1) 159.68; More....
Intraday bias in EUR/JPY remains neutral first. While, recovery from 156.16 might extend, further decline is expected as long as 55 D EMA (now at 162.01) holds. On the downside, below 157.54 minor support will bring retest of 156.16 first. Break there will target 154.40 low next.
In the bigger picture, price actions from 175.41 are seen as correction to rally from 114.42 (2020 low). The range of consolidation should have been set between 38.2% retracement of 114.42 to 175.41 at 152.11 and 175.41 high. However, decisive break of 152.11 would argue that deeper correction is underway.