Sample Category Title
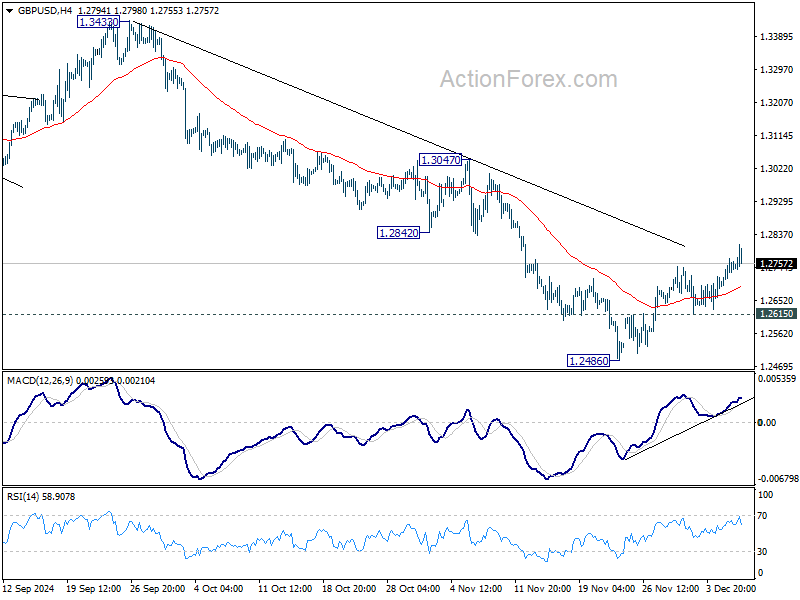
GBP/USD Mid-Day Outlook
Daily Pivots: (S1) 1.2712; (P) 1.2742; (R1) 1.2790; More...
GBP/USD's rebound from 1.2486 continues today and intraday bias stays on the upside for 55 D EMA (now at 1.2849). Strong resistance is expected there to limit upside, and bring resumption of whole fall from 1.3433. On the downside, below 1.2615 minor support will bring retest of 1.2486 low first. However, sustained break of 55 D EMA will argue that the near term trend has reversed, and targets 1.3047 resistance for confirmation.
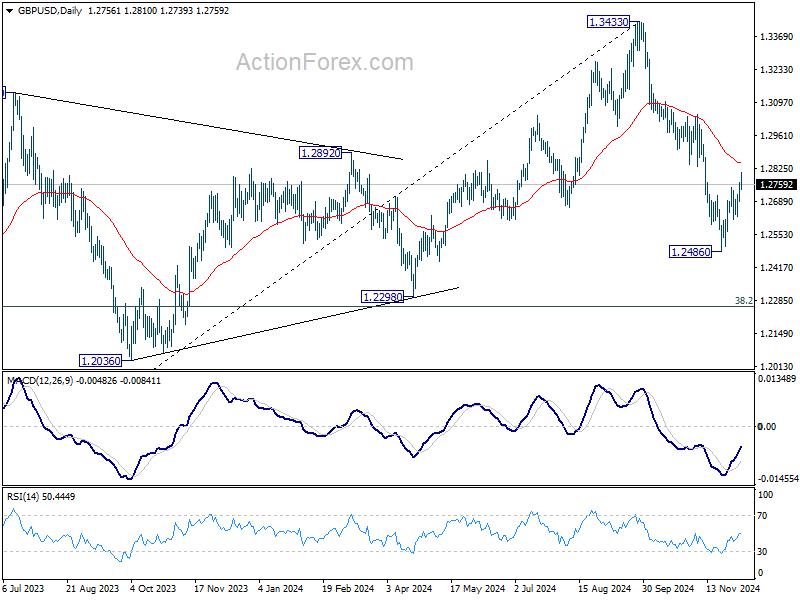
In the bigger picture, a medium term top should be in place at 1.3433, and price actions from there are correcting whole up trend from 1.0351 (2022 low). Deeper decline is now expected as long as 55 D EMA (now at 1.2849) holds, to 38.2% retracement of 1.0351 to 1.3433 at 1.2256, which is close to 1.2298 structural support. Strong support should be seen there to bring rebound.
USD/JPY Mid-Day Outlook
Daily Pivots: (S1) 149.59; (P) 150.18; (R1) 150.71; More...
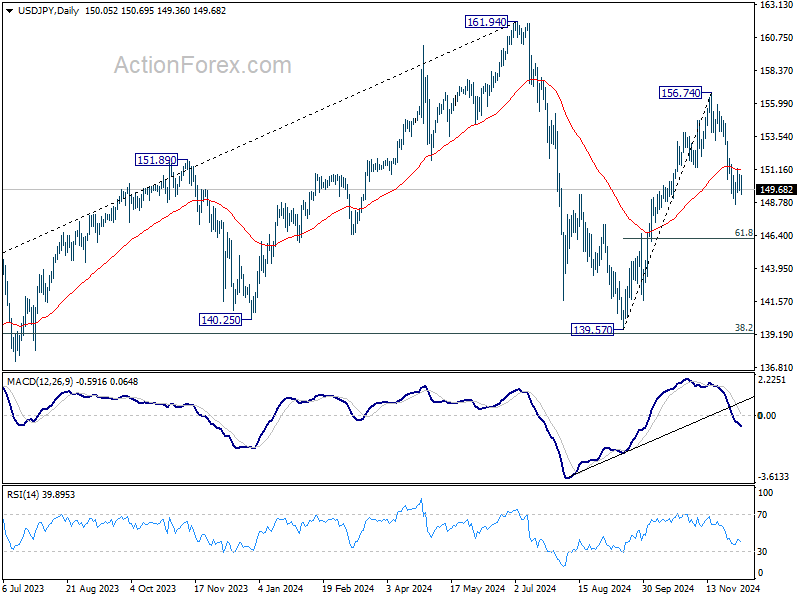
USD/JPY dips mildly but stays in range above 148.64 and intraday bias remains neutral. On the downside, break of 148.64 will strengthen the case that rise from 139.57 has already completed at 156.754. Deeper fall should then be seen to 61.8% retracement of 139.57 to 156.74 at 146.12 next. Nevertheless, firm break of 151.94 resistance will revive near term bullishness and bring retest of 156.74 high.
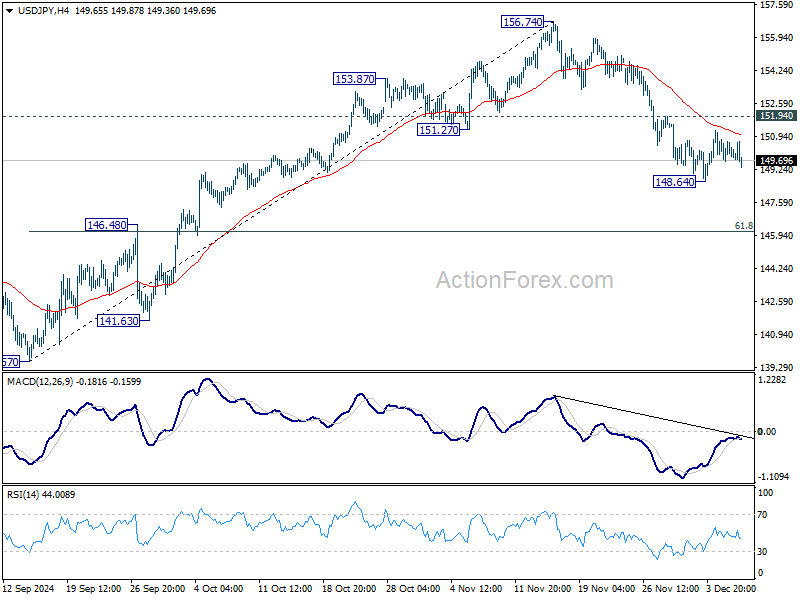
In the bigger picture, price actions from 161.94 are seen as a corrective pattern to rise from 102.58 (2021 low). The range of medium term consolidation should be set between 38.2% retracement of 102.58 to 161.94 at 139.26 and 161.94. Nevertheless, sustained break of 139.26 would open up deeper medium term decline to 61.8% retracement at 125.25.
US: Payrolls Rebound in November, But Unemployment Rate Ticks Up to 4.2%
The U.S. economy added 227k jobs in November, in line with the consensus forecast calling for a gain of 218k. Payroll figures for the two prior months were revised higher by 56k.
Private payrolls rose 194k, with the largest gains seen in health care & social assistance (+72.3k), leisure & hospitality (+53k), professional & business services (+26k) and manufacturing (+22k). The gain in manufacturing were largely payback from the month prior following the resolution of the Boeing strike. The public sector added 33k new positions last month.
In the household survey, civilian employment (-355k) fell by considerably more than the labor force (-193k), which pushed the unemployment rate up to 4.2%. The labor force participation rate fell 0.1 percentage points to 62.5% - a six-month low.
Average hourly earnings (AHE) rose 0.4% month-on-month (m/m), matching October's gain. On a twelve-month basis, AHE were up 4.0% (unchanged from October). Aggregate hours worked rose sharply, up 0.4% m/m.
Key Implications
This morning's release provided further evidence that October's soft employment report was more to do with temporary effects stemming from hurricanes and labor disputes, and not a sudden deterioration in the labor market. Not only did job creation regain its vigor in November, but revisions to prior months were also a tad higher, and aggregate hours worked grew at the fastest pace in eight months.
Smoothing through the recent volatility, job gains have averaged 173k over the past three-months, or only a modest stepdown from the 186K averaged over the prior twelve-month period. But this likely overstates the degree of "strength" in the job market. A broader sweep of the data suggests that the labor market has already come back into better balance, and is no longer a meaningful source of inflationary pressure. Moreover, the fact that the labor force has contracted in each of the past two-months suggests that job seekers are starting to internalize the fact that jobs are becoming harder to come by – a further indication that the labor market is cooling. This should give policymakers the assurance they need to cut by another quarter-point later this month. But with inflation progress showing early signs of stalling and some of the incoming administration's policy proposals (including the potential for tax cuts and tariffs) viewed as inflationary, the Fed is likely to proceed more cautiously with easing its policy rate in 2025
Canada’s Labour Market Shows Underlying Momentum in November
The Canadian labour market gained 50.5k positions in November. Most of them were full-time jobs, which rose 54.2k, while part-time employment fell 3.6k.
The unemployment rate rose 0.3 percentage points to 6.8% as more people joined the labour force (+138k). The labour force participation rate rebounded 0.3 percentage points to 65.1% after two months of decline.
Employment by sector showed gains in trade (+39k), construction (+18k), and professional, scientific and technical services (+17k). Declines were seen in manufacturing (-29k) and transportation and warehousing (-19k).
Lastly, despite so many new jobs, total hours worked fell 0.2% month-on-month due to labour disputes. Wages were up 4.1% year-on-year (from 4.9% in October).
Key Implications
Today's jobs report had a lot of moving parts. Yes, the unemployment rate rose significantly, but this was due to a massive increase in the labour force rather than outright job losses. Remember that Statcan has cautioned people on using its jobs report population figures, which don't match recent demographic data (also means caution of labour force figures). So, we should be taking this with a heavy hand of salt. Rather, we focus on the trend, where employment growth has held up well, with cyclically sensitive sectors driving gains over the last few months.
The Bank of Canada will make an interest rate announcement next Wednesday and markets are still on the fence as to whether the bank will cut by 50 or 25 bps. Recall that the BoC accelerated its rate cutting cycle with a 50 beeper in October as weak growth and an inflation undershoot raised fears that it was behind the curve. But since then, economic data have shown more resilience, with consumer spending, the real estate market, and price pressures rebounding. Even with the messiness of today's employment report, the economy continues to add jobs, reinforcing our view that the labour market is on solid foundations. We think this should be enough to convince the central bank to revert to a 25 bp cut next week, but it will remain a close call for the central bank.
USD/CHF Mid-Day Outlook
Daily Pivots: (S1) 0.8758; (P) 0.8806; (R1) 0.8832; More…
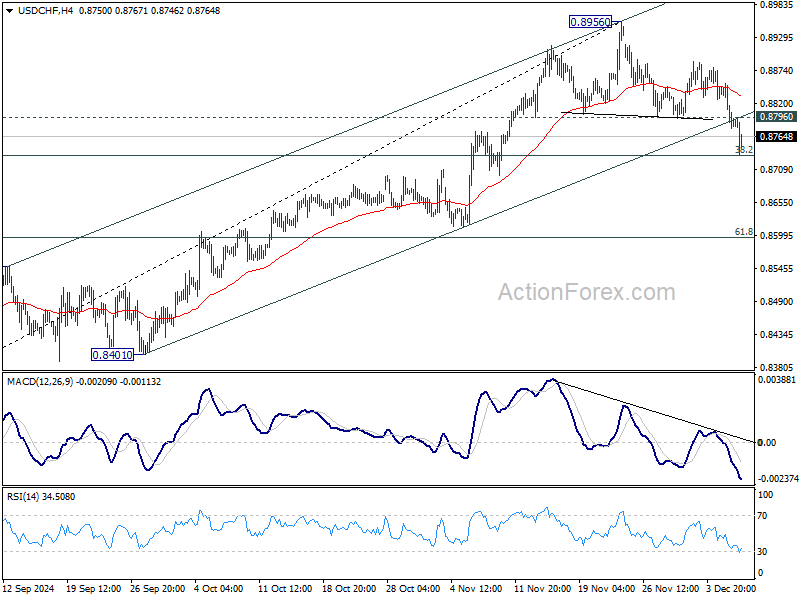
USD/CHF's fall from 0.8956 short term top extends lower in early US session and touched 55 D EMA (now at 0.8737. Strong support could be seen from current level, and firm break of 0.8796 resistance will turn bias back to the upside for rebound. However, considering head and shoulder top pattern, firm break of the EMA will argue that whole rise from 0.8401 might have completed, and bring deeper decline to 61.8% retracement of 0.8401 to 0.8956 at 0.8613 next.
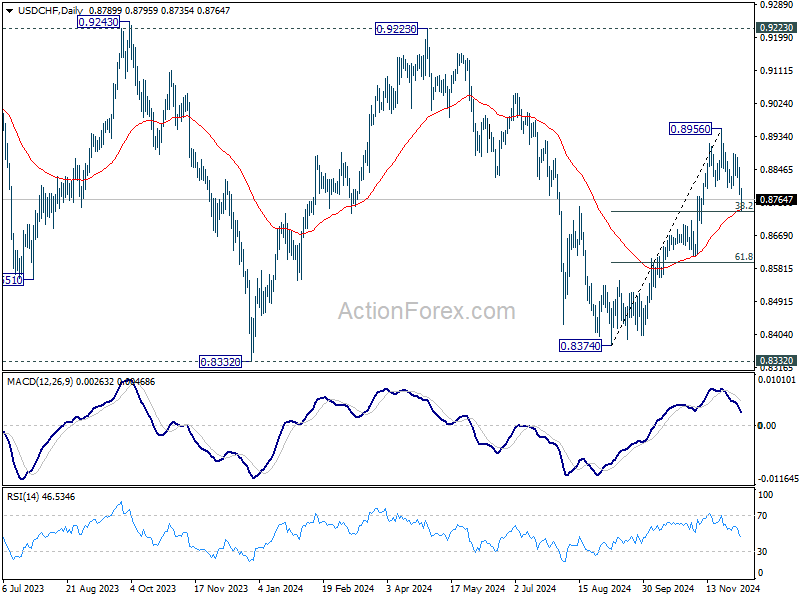
In the bigger picture, price actions from 0.8332 (2023 low) are currently seen as a medium term corrective pattern. Rise from 0.8374 is seen as the third leg. Overall outlook will continue to stay bearish as long as 0.9223 resistance holds. Break of 0.8332 low is in favor at a later stage when the consolidation completes.
Dollar Slips Versus European Peers Post-NFP, Maintains Ground Against Others
Dollar came under pressure against European currencies following release of US non-farm payroll report, despite the data being robust overall. In contrast, the greenback held firm against Yen and Aussie, while advancing against Loonie, with the latter pressured by surprisingly large increase in Canada’s unemployment rate, signaling sharp loosening in its labor market.
The NFP report showed job growth exceeding the average of the prior 12 months, while earnings growth beat expectations, underscoring resilience in the U.S. labor market. The slight uptick in the unemployment rate, while a minor blemish, didn’t significantly alter market sentiment. Overall, the data is not strong enough to deter Fed from delivering another 25bps rate cut at its December meeting. Market sentiment has shifted decisively, with Fed funds futures now pricing in more than 90% chance of a cut, up sharply from 71% just a day earlier.
Reactions in other markets to NFP report have been relatively subdued, with stock futures posting modest gains. US 10-year Treasury yield dipped slightly but lacked the momentum to decisively break through 4.15% level yet. With much of the immediate reaction to the payroll data absorbed, market activity might taper off as traders square positions ahead of next week.
For the week, Swiss Franc is leading as the strongest performer, followed by Sterling and the Euro. Australian Dollar remains the weakest, with Kiwi and Loonie trailing behind. Dollar and Yen are positioned in the middle of the pack.
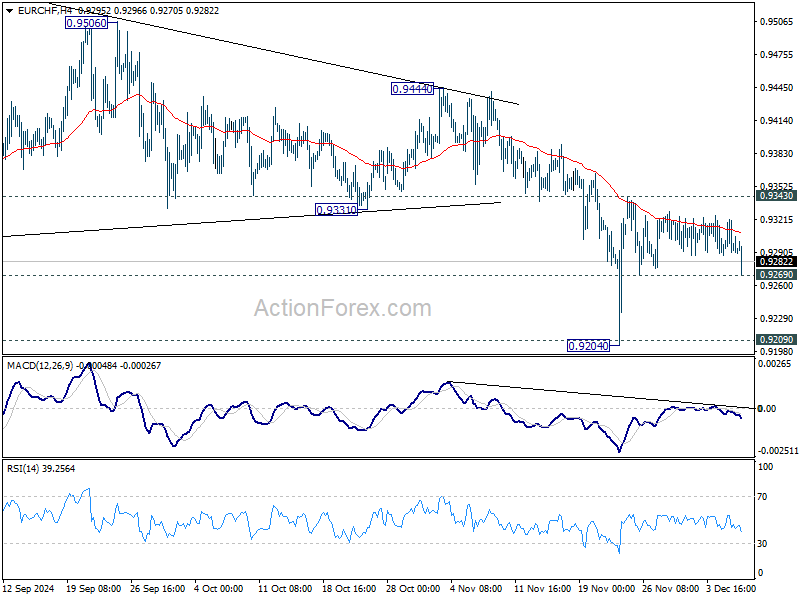
Technically, EUR/CHF has been repeatedly rejected by falling 55 4H EMA, which keeps near term outlook bearish. A focus now is whether the cross would break through 0.9269 support and lose below before the week ends. If released, that could set up further selloff in Euro, and push EUR/CHF for a retest on 0.9204 low next week.
In Europe, at the time of writing, FTSE is up 0.02%. DAX is up 0.28%. CAC is up 1.46%. UK 10-year yield is down -0.016 at 4.272. Germany 10-year yield is down -0.002 at 2.114. Earlier in Asia, Nikkei fell -0.77%. Hong Kong HSI rose 1.56%. China Shanghai SSE rose 1.05%. Singapore Strait Times fell -0.69%. Japan 10-year JGB yield fell -0.0195 to 1.053.
US NFP grows 227k in Nov, unemployment rate rises to 4.2%
US non-farm payroll employment grew 227k in November, close to expectation of 218k. That's notably higher than the average of 186k monthly growth over the prior 12 months.
Unemployment rate rose from 4.1% to 4.2%, above expectation of 4.1%. Labor force participation rate was at 62.5%, ticked down from 62.6%.
Average hourly earnings rose 0.4% mom, above expectation of 0.3% mom. Over then past 12 months, average hourly earnings rose 4.0% yoy.
Canada's employment grows 51k in Nov, unemployment rate jumps to 6.8%
Canada's employment grew 51k in November, above expectation of 25k. Employment gains were concentrated in full-time work (+54k).
Employment rate was unchanged at 60.6%. Unemployment rate jumped from 6.5% to 6.8%, as more people are looking for work. Labor force participation rate rose 0.3% to 65.1%.
Total hours worked was down slightly by -0.2% mom but up 1.9% yoy. Average hourly wages grew 4.1% yoy, slowed from 4.9% yoy in October.
BoE's Dhingra calls for more policy relief, labels current stance very restrictive
BoE MPC member Swati Dhingra, often viewed as the most dovish voice within the committee, reinforced her call for policy easing during an interview with Bloomberg TV today.
Dhingra highlighted the "very restrictive stance" of current monetary policy, arguing that high interest rates are dampening consumption, investment, and supply capacity. She stressed, “We should be easing policy more” to alleviate the strain on living standards and pave the way for economic normalization.
Dhingra pointed to easing wage pressures and declining service inflation as key indicators supporting a shift towards lower rates.
She advocated for a "gradual" approach to rate cuts, suggesting the Bank Rate should eventually settle between 2.5% and 3.5%, her updated estimate of the “neutral rate.” Notably, she acknowledged that this estimate has risen since BoE’s 2018 estimate of 2%-3%.
Turning to the potential fallout from a global trade war, Dhingra noted its indirect effects could significantly harm productivity and business adaptability. While she believes the direct impact on UK growth and inflation might be "limited," she cautioned that secondary effects, such as supply chain disruptions and reallocation challenges, would be far more damaging.
Japan's nominal wages growth hits multi-decade high, but real gains remain elusive
Japan’s labor market data for October showed nominal wages, or labor cash earnings, rose 2.6% yoy, in line with expectations. Regular pay, or base salary, grew 2.7% yoy, marking the fastest increase since November 1992. Full-time workers saw an even sharper wage rise at 2.8% yoy, the highest increase since comparable records began in 1994. Overtime pay also rebounded, registering a 1.4% yoy growth compared to a -0.9% decrease in the prior month.
However, real wages—adjusted for inflation—was stagnant, showing no change from a year ago. This followed declines of -0.4% and -0.8% yoy in September and August, respectively. The inflation rate used by Japan’s labor ministry for these calculations, excluding owners' equivalent rent, slowed to 2.6%, the lowest in nine months.
On the household front, spending fell -1.3% yoy, better than the forecasted -2.6% yoy decline but still reflecting cautious consumer behavior. Food expenditures, comprising around 30% of total spending, dropped -0.8% yoy. Other categories faced sharper declines, including a -13.7% yoy plunge in clothing and shoes, a -10.7% yoy drop in housing-related expenditures, and a -14.0% yoy decrease in education spending, such as tuition fees.
USD/CHF Mid-Day Outlook
Daily Pivots: (S1) 0.8758; (P) 0.8806; (R1) 0.8832; More…
USD/CHF's fall from 0.8956 short term top extends lower in early US session and touched 55 D EMA (now at 0.8737. Strong support could be seen from current level, and firm break of 0.8796 resistance will turn bias back to the upside for rebound. However, considering head and shoulder top pattern, firm break of the EMA will argue that whole rise from 0.8401 might have completed, and bring deeper decline to 61.8% retracement of 0.8401 to 0.8956 at 0.8613 next.
In the bigger picture, price actions from 0.8332 (2023 low) are currently seen as a medium term corrective pattern. Rise from 0.8374 is seen as the third leg. Overall outlook will continue to stay bearish as long as 0.9223 resistance holds. Break of 0.8332 low is in favor at a later stage when the consolidation completes.
Canada’s employment grows 51k in Nov, unemployment rate jumps to 6.8%
Canada's employment grew 51k in November, above expectation of 25k. Employment gains were concentrated in full-time work (+54k).
Employment rate was unchanged at 60.6%. Unemployment rate jumped from 6.5% to 6.8%, as more people are looking for work. Labor force participation rate rose 0.3% to 65.1%.
Total hours worked was down slightly by -0.2% mom but up 1.9% yoy. Average hourly wages grew 4.1% yoy, slowed from 4.9% yoy in October.
US NFP grows 227k in Nov, unemployment rate rises to 4.2%
US non-farm payroll employment grew 227k in November, close to expectation of 218k. That's notably higher than the average of 186k monthly growth over the prior 12 months.
Unemployment rate rose from 4.1% to 4.2%, above expectation of 4.1%. Labor force participation rate was at 62.5%, ticked down from 62.6%.
Average hourly earnings rose 0.4% mom, above expectation of 0.3% mom. Over then past 12 months, average hourly earnings rose 4.0% yoy.
BoE’s Dhingra calls for more policy relief, labels current stance very restrictive
BoE MPC member Swati Dhingra, often viewed as the most dovish voice within the committee, reinforced her call for policy easing during an interview with Bloomberg TV today.
Dhingra highlighted the "very restrictive stance" of current monetary policy, arguing that high interest rates are dampening consumption, investment, and supply capacity. She stressed, “We should be easing policy more” to alleviate the strain on living standards and pave the way for economic normalization.
Dhingra pointed to easing wage pressures and declining service inflation as key indicators supporting a shift towards lower rates.
She advocated for a "gradual" approach to rate cuts, suggesting the Bank Rate should eventually settle between 2.5% and 3.5%, her updated estimate of the “neutral rate.” Notably, she acknowledged that this estimate has risen since BoE’s 2018 estimate of 2%-3%.
Turning to the potential fallout from a global trade war, Dhingra noted its indirect effects could significantly harm productivity and business adaptability. While she believes the direct impact on UK growth and inflation might be "limited," she cautioned that secondary effects, such as supply chain disruptions and reallocation challenges, would be far more damaging.
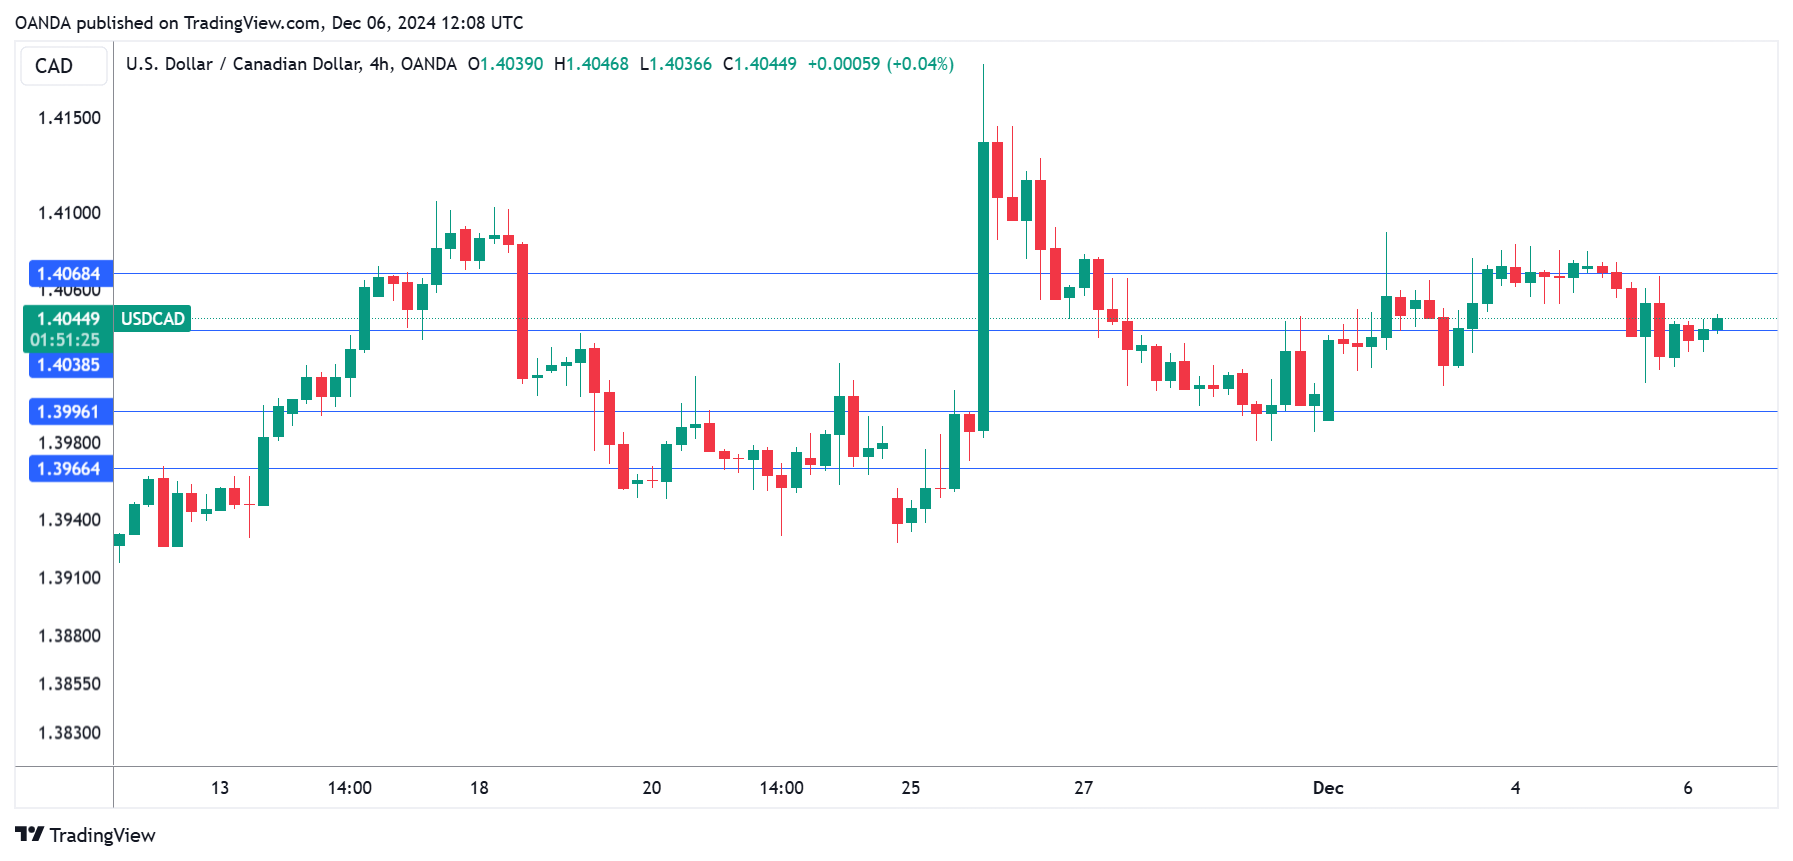
USD/CAD Steady Ahead of Can. Job Growth, US NFP
The Canadian dollar is showing small gains on Friday. In the European session, USD/CAD is trading at 1.4041, up 0.12% at the time of writing.
Canada’s job growth expected to climb
Canada releases job growth for November later today. The market estimate stands at 25 thousand, compared to 14.5 thousand in October.
The modest growth in job creation has not kept pace with the labor force, which has rapidly expanded as a result of high immigration to Canada. This has resulted in a high unemployment rate, which is expected to creep up to 6.6% in November from 6.5% a month earlier.
With inflation running at 2%, the Bank of Canada’s target, employment data has become a key factor for the central bank with regard to rate policy. The BoC has cut interest rates four times this year, including a jumbo 50-basis point rate cut in October.
What will the Bank of Canada do at the Dec. 11 meeting? The market is split on whether the BoC will cut rates by 25 or 50 bp at the meeting. BoC policymakers can point to low inflation and a cool labor market to support the case for an oversized 50-bp cut. However, an argument can be made for a modest 25 bp cut. The government has announced stimulus in the form of a temporary sales tax holiday, which could cause some growth and in turn inflation. As well, the battle with inflation is not yet won, as core inflation remains around 2.5%, above the BoC’s target of 2%. The bottom line? Next week’s rate decision is shaping up as a close call between a 25 bp and 50 bp rate cut.
The US wraps up the week with the nonfarm payroll report. With inflation largely tamed, job growth is once again a key release that should be considered a market-mover. The November report is expected to rise to a respectable 200 thousand, after a weak gain of 12 thousand in October, which was driven downwards by hurricanes and work stoppages at Boeing.
USD/CAD Technical
- USD/CAD is testing resistance at 1.4039, followed by resistance at 1.4068
- 1.3996 and 1.3967 are the next support levels