
Sample Category Title
USD/CHF Weekly Outlook
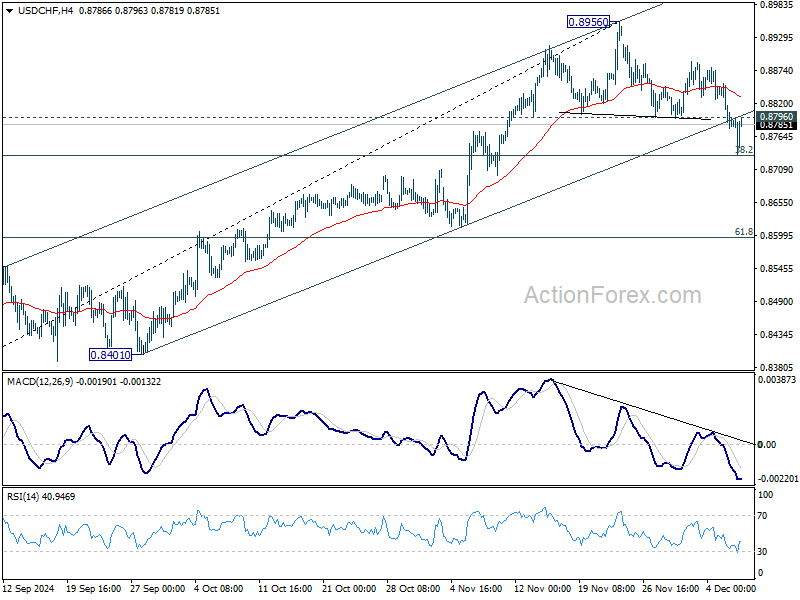
USD/CHF's pullback from 0.8956 extended lower last week but recovered after touching 55 D EMA (now at 0.8738). Initial bias is turned neutral this week first. Strong rebound from current level will retain near term bullishness. Break of 0.8796 minor resistance will bring retest of 0.8956 high first. However, considering head and shoulder top pattern, firm break of the EMA will argue that whole rise from 0.8401 might have completed, and bring deeper decline to 61.8% retracement of 0.8401 to 0.8956 at 0.8613 next.
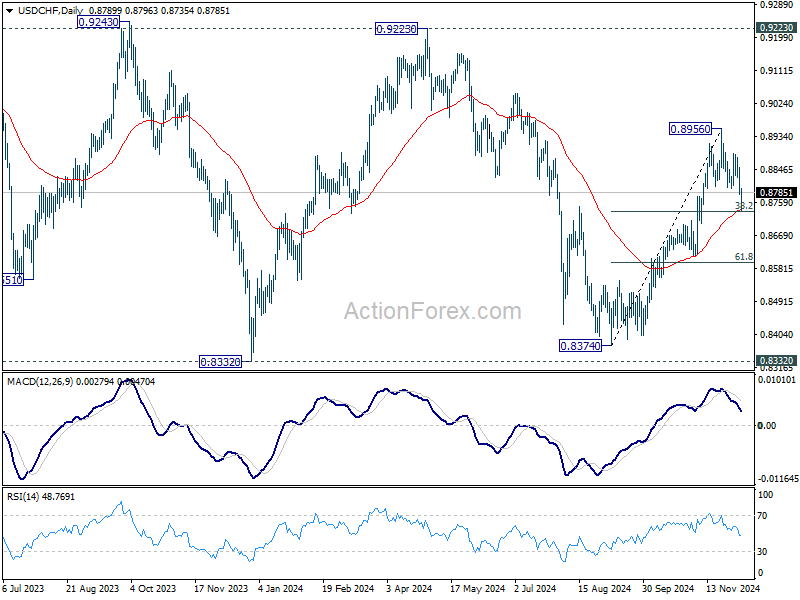
In the bigger picture, price actions from 0.8332 (2023 low) are currently seen as a medium term corrective pattern, with rise from 0.8374 as the third leg. Overall outlook will continue to stay bearish as long as 0.9223 resistance holds. Break of 0.8332 low is in favor at a later stage when the consolidation completes.
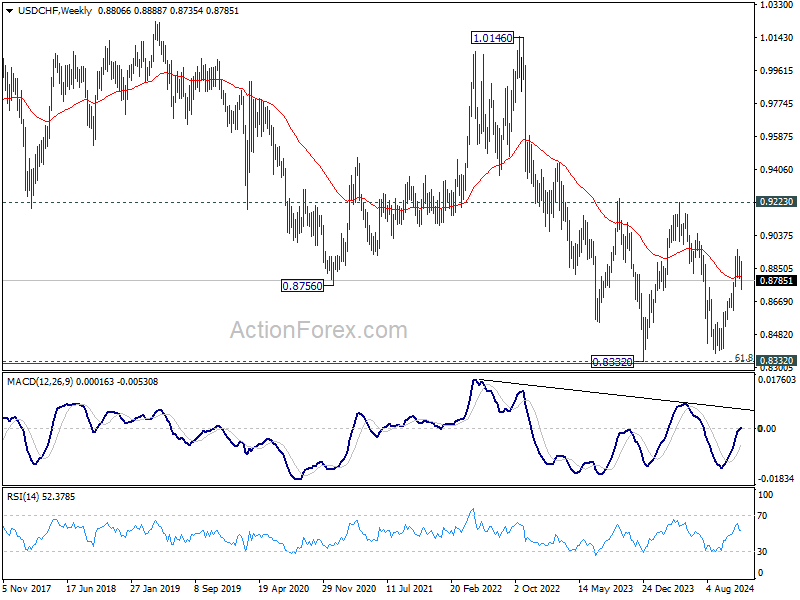
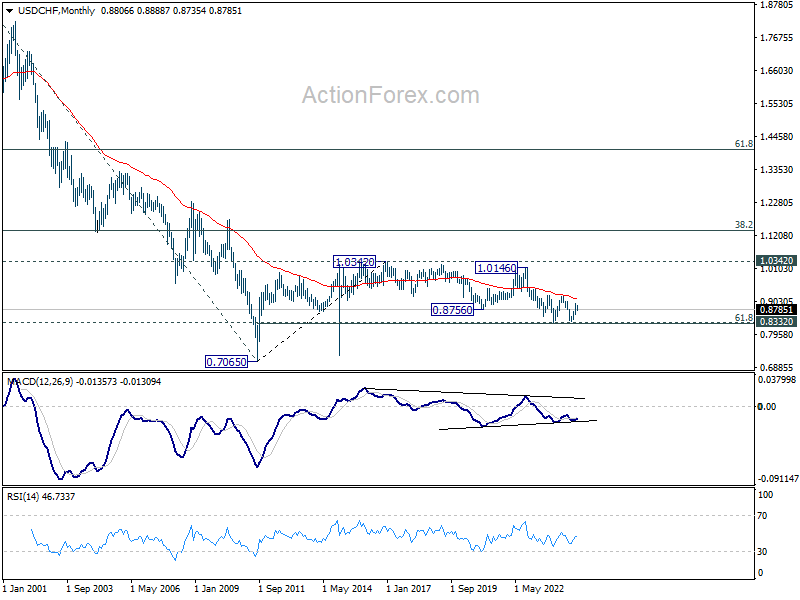
In the long term picture, price action from 0.7065 (2011 low ) are seen as a corrective pattern to the multi-decade down trend from 1.8305 (2000 high). Fall from 1.0342 (2016 high) is seen as the second leg. Rejection by 55 M EMA suggest that this fall is in progress. Break of 61.8% retracement of 0.7065 to 1.0342 at 0.8317 will pave the way back to 0.7065.
AUD/USD Weekly Report
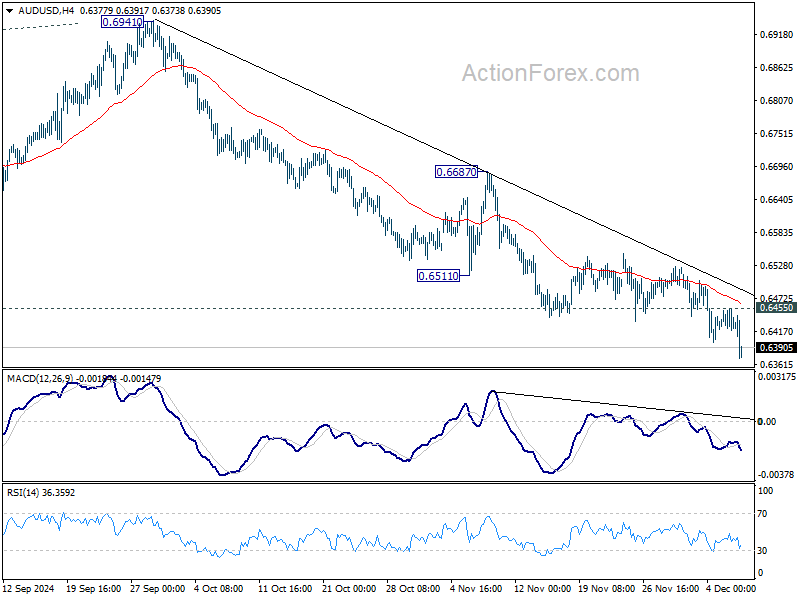
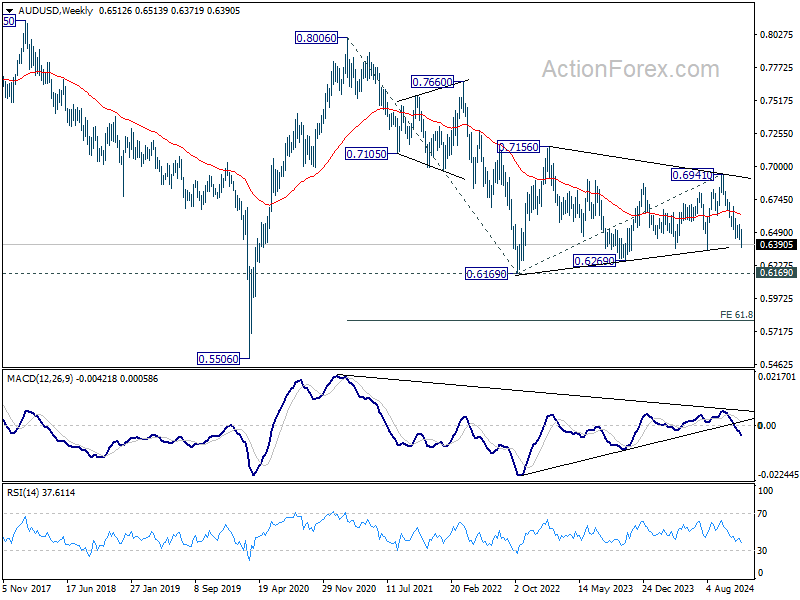
AUD/USD's decline from 0.6941 resumed last week and dived to as low as 0.6371. Initial bias stays on the downside this week for 0.6348 support first. Firm break there will target 0.6269 support next. On the upside, above 0.6455 minor resistance will turn intraday bias neutral and bring consolidations first, before staging another fall.
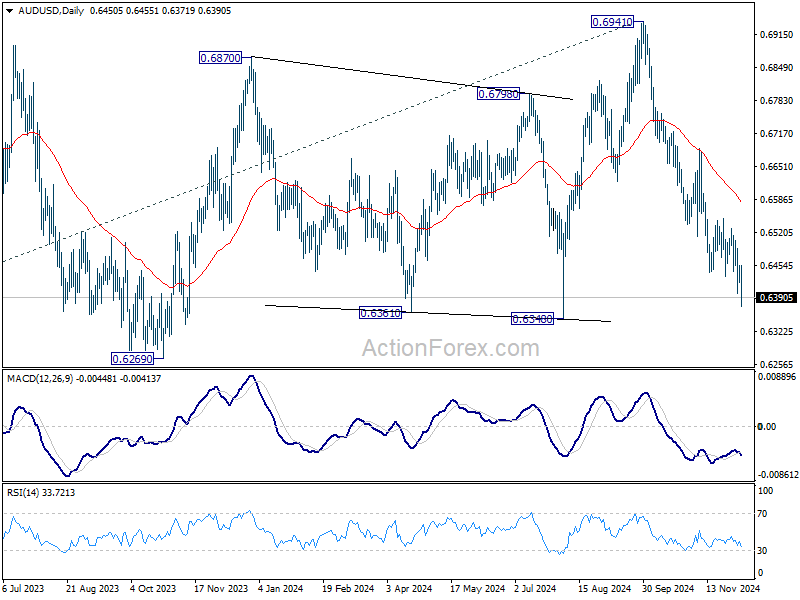
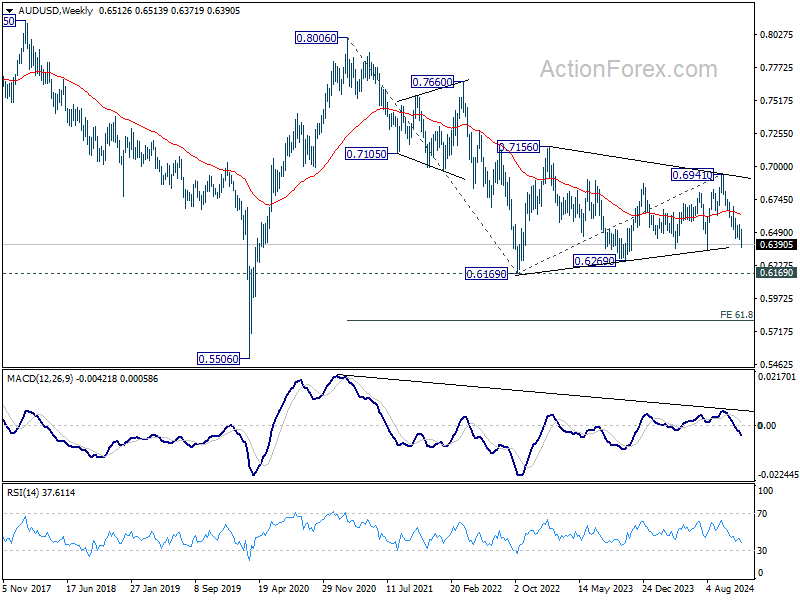
In the bigger picture, price actions from 0.6169 (2022 low) are seen as a medium term consolidation to the down trend from 0.8006. More sideway trading could be seen above 0.6169, but overall outlook will stay bearish as long as 0.6941 resistance holds. Firm break of 0.6169 will resume the down trend to 61.8% projection of 0.8006 to 0.6169 from 0.6941 at 0.5806 next.
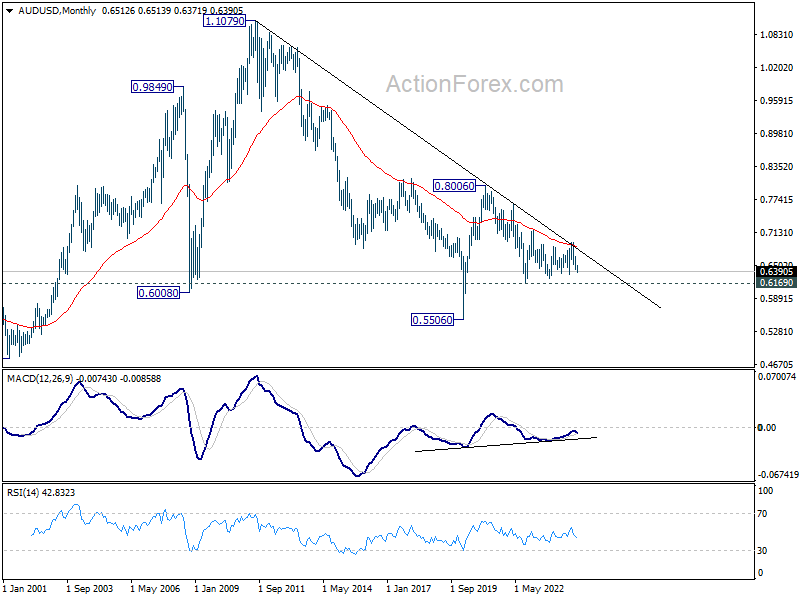
In the long term picture, the down trend from 1.1079 (2011 high) should have completed at 0.5506 (2020 low) already. It's unsure yet whether price actions from 0.5506 are developing into a corrective pattern, or trend reversal. But in either case, fall from 0.8006 is seen as the second leg of the pattern. Hence, even in case of deeper fall, strong support should emerge above 0.5506 to contain downside to bring reversal.
USD/CAD Weekly Outlook
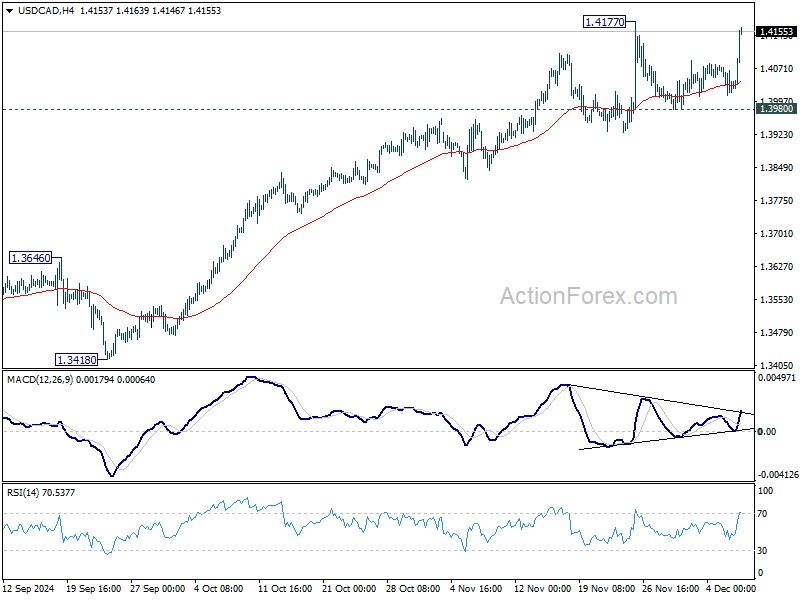
While USD/CAD extended the consolidations from 1.4177 last week, the late surge argues that larger up trend might be ready to resume. Immediate focus is now on 1.4177 resistance this week. Decisive break there will confirm this bullish case and target 1.4391 projection level next. Rejection by 1.4177 will delay the bullish case and bring more consolidations. But outlook will continue to stay bullish as long as 1.3980 support holds.
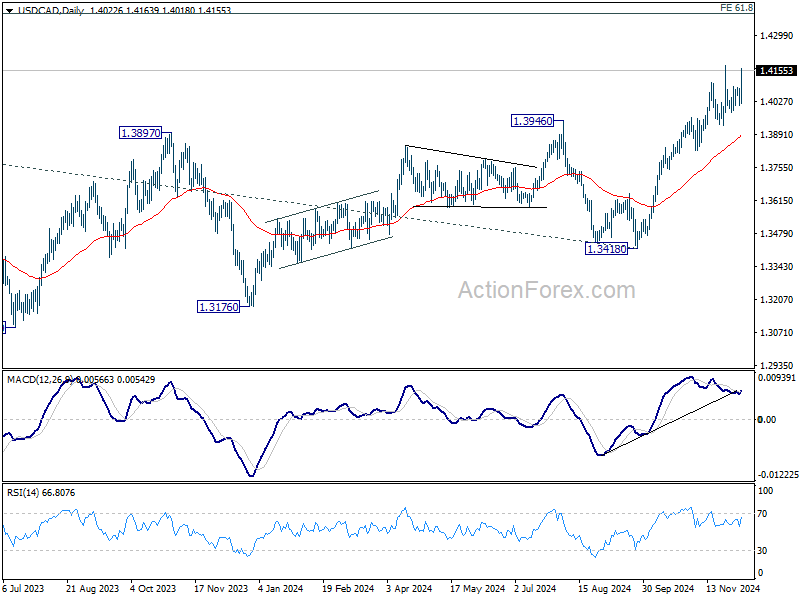
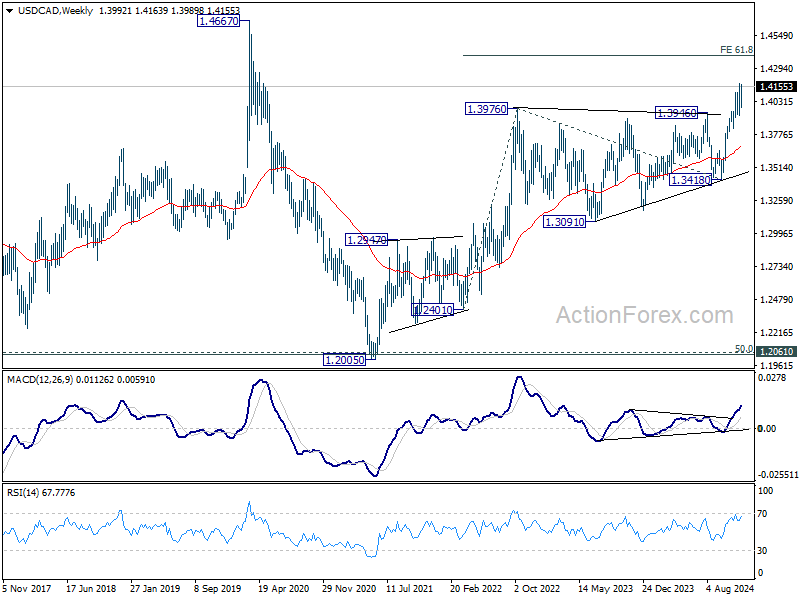
In the bigger picture, up trend from 1.2005 (2021) is in progress. Next target is 61.8% projection of 1.2401 to 1.3976 from 1.3418 at 1.4391. Now, medium term outlook will remain bullish as long as 1.3418 support holds, even in case of deep pullback.
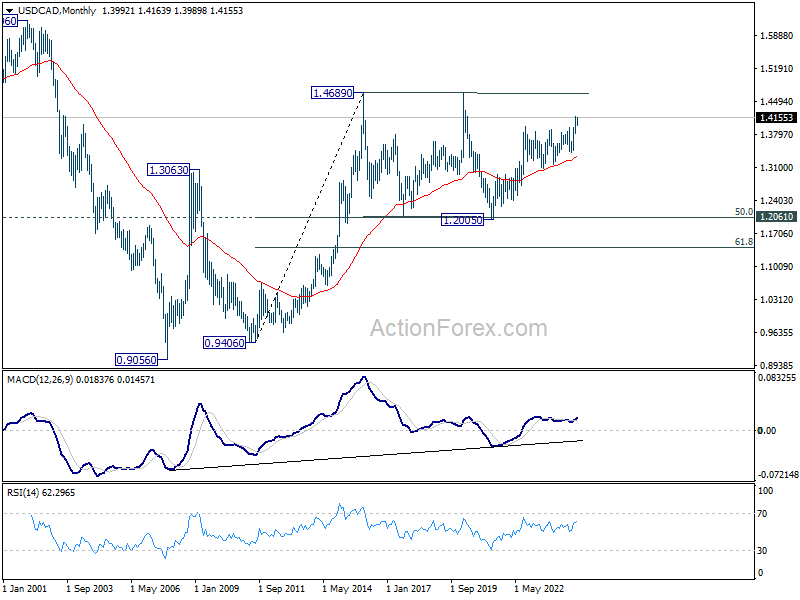
In the longer term picture, price actions from 1.4689 (2016 high) are seen as a consolidation pattern, which might have completed at 1.2005. That is, up trend from 0.9506 (2007 low) is expected to resume at a later stage. This will remain the favored case as long as 1.3418 support holds.
GBP/JPY Weekly Outlook
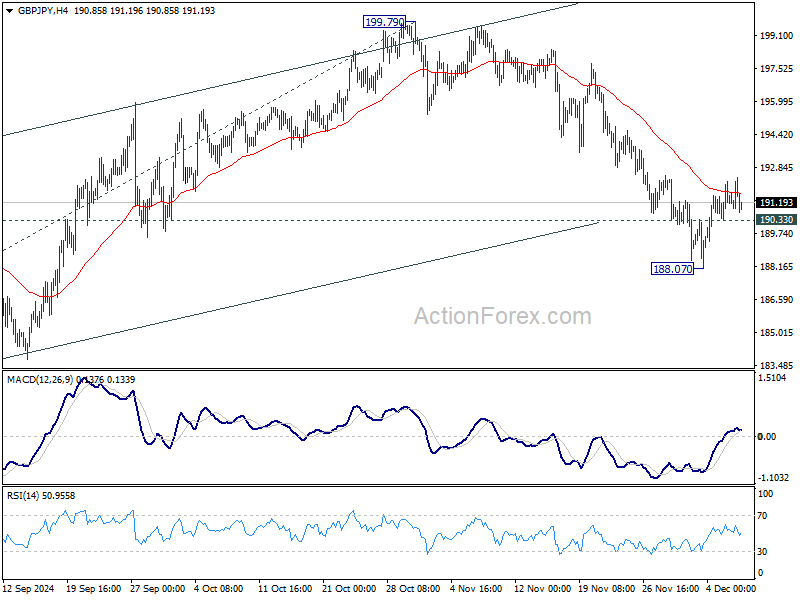
GBP/JPY edged lower to 188.07 last week as fall from 199.71 extended, but recovered since then. Initial bias remains neutral this week first. While further recovery cannot be ruled out, outlook will stay bearish as long as 55 D EMA (now at 194.04) holds. On the downside, below 190.33 minor support will bring retest of 188.07 first. Break there will target 183.70 support next.
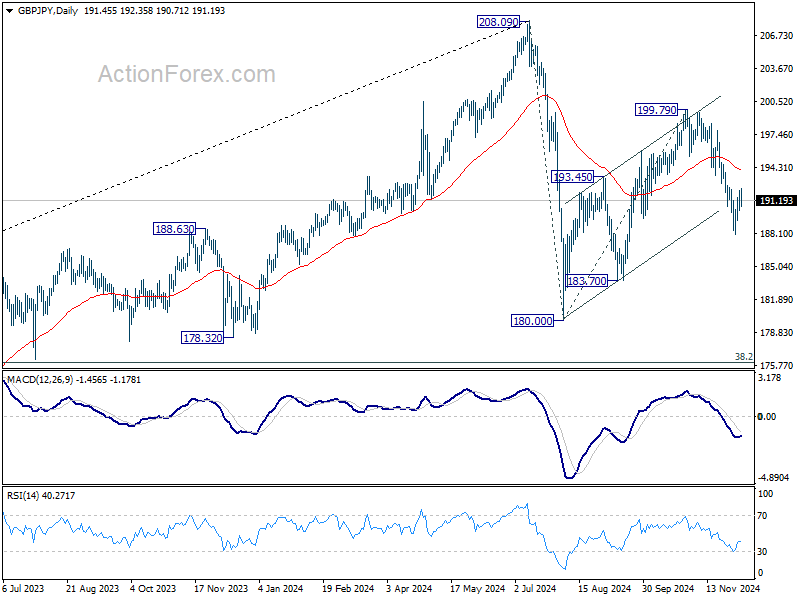
In the bigger picture, price actions from 208.09 are seen as a correction to whole rally from 123.94 (2020 low). The range of consolidation should be set between 38.2% retracement of 123.94 to 208.09 at 175.94 and 208.09. However, decisive break of 175.94 will argue that deeper correction is underway.
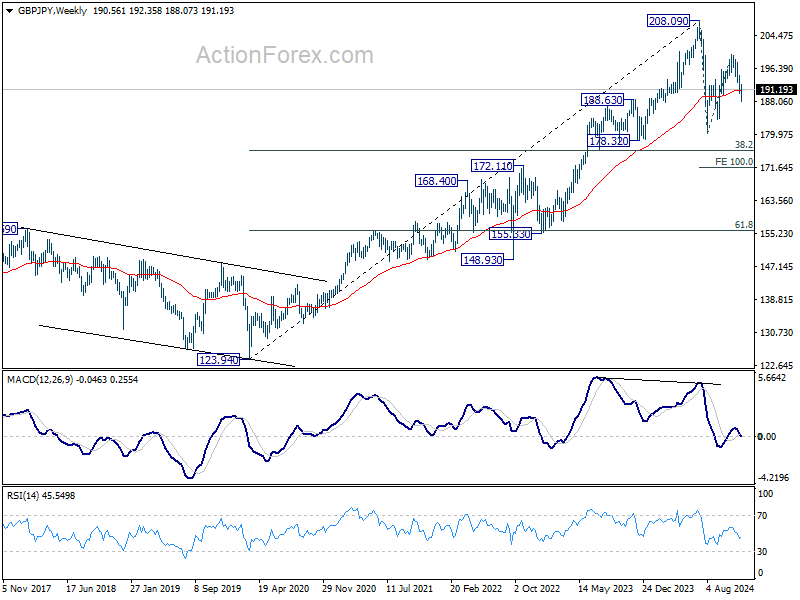
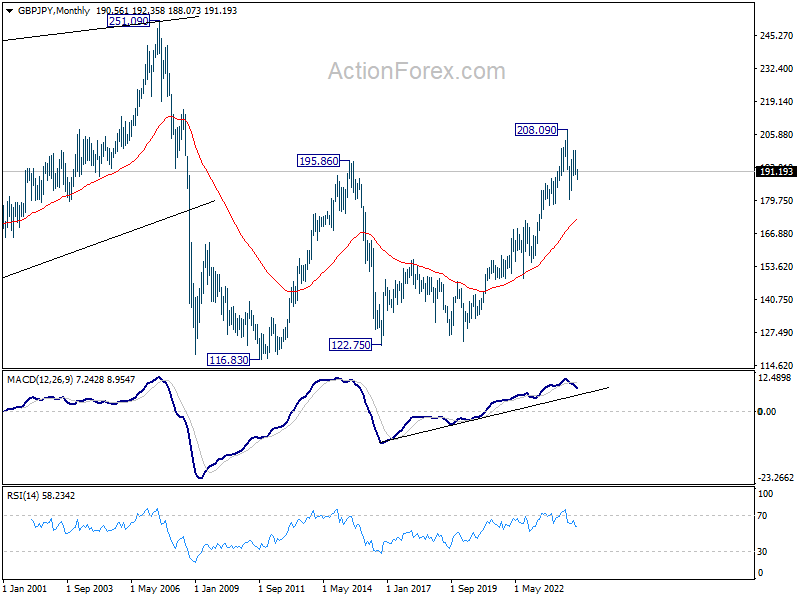
In the longer term picture, considering bearish divergence condition in W MACD, 208.09 is at least a medium term top. It's still early to conclude that the up trend from 122.75 (2016 low) has completed. But it's at least in a medium term corrective phase, with risk of correction to 55 M EMA (now at 172.51).
EUR/JPY Weekly Outlook
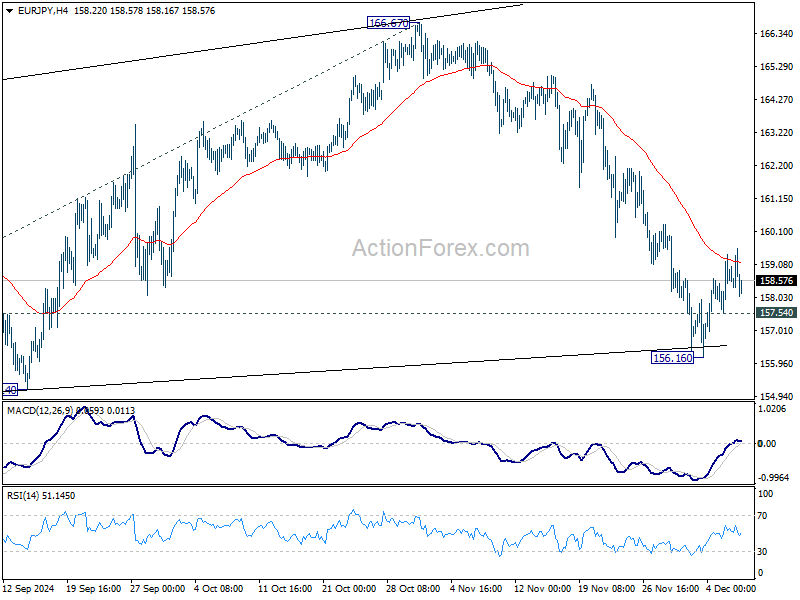
EUR/JPY edged lower to 156.16 last week as fall from 166.67 extended, but recovered since then. Initial bias remains neutral this week first. While further recovery cannot be ruled out, outlook will stay bearish as long as 55 D EMA (now at 162.11) holds. On the downside, below 157.54 minor support will bring retest of 156.16 first. Break there will target 154.40 low next.
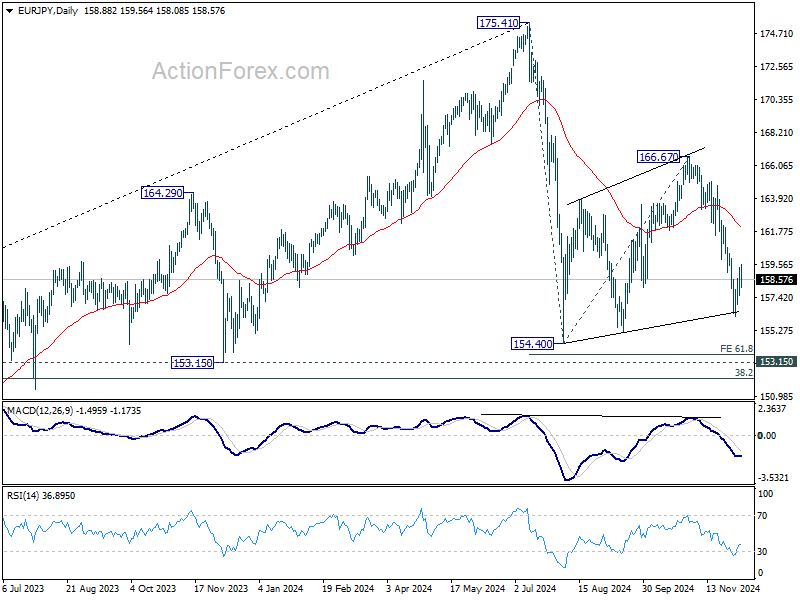
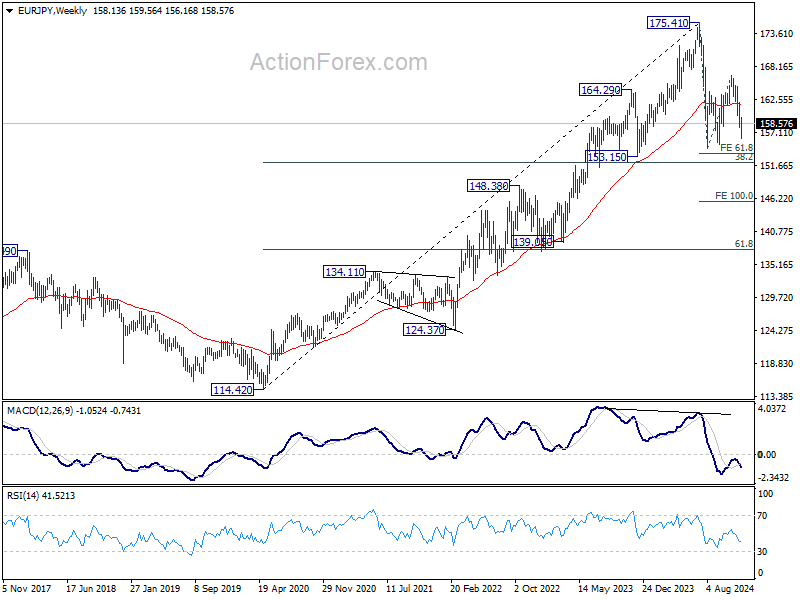
In the bigger picture, price actions from 175.41 are seen as correction to rally from 114.42 (2020 low). The range of consolidation should have been set between 38.2% retracement of 114.42 to 175.41 at 152.11 and 175.41 high. However, decisive break of 152.11 would argue that deeper correction is underway.
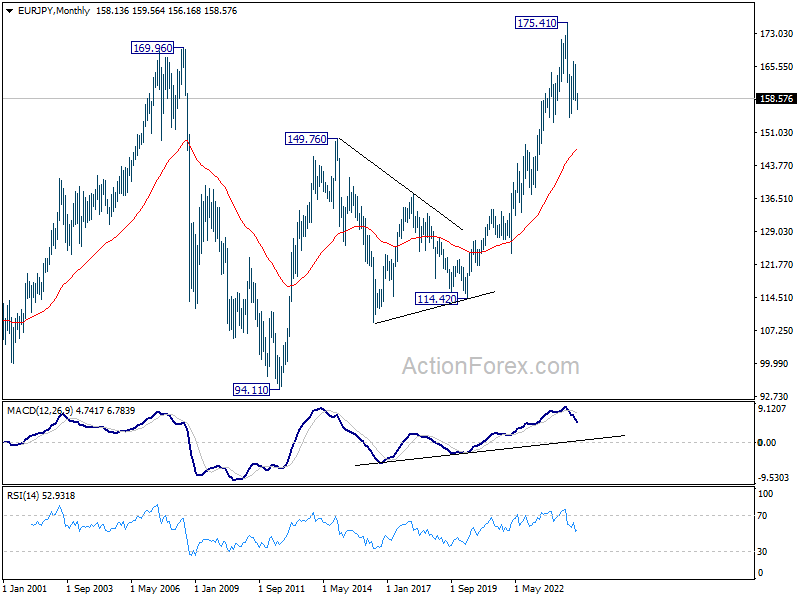
In the long term picture, considering bearish divergence condition in W MACD, 175.41 is at least a medium term top. It's still early to conclude that up trend from 94.11 (2012 low) has completed. But a medium term corrective phase is in progress with risk of deeper fall back to 55 M EMA (now at 147.55).
EUR/GBP Weekly Outlook
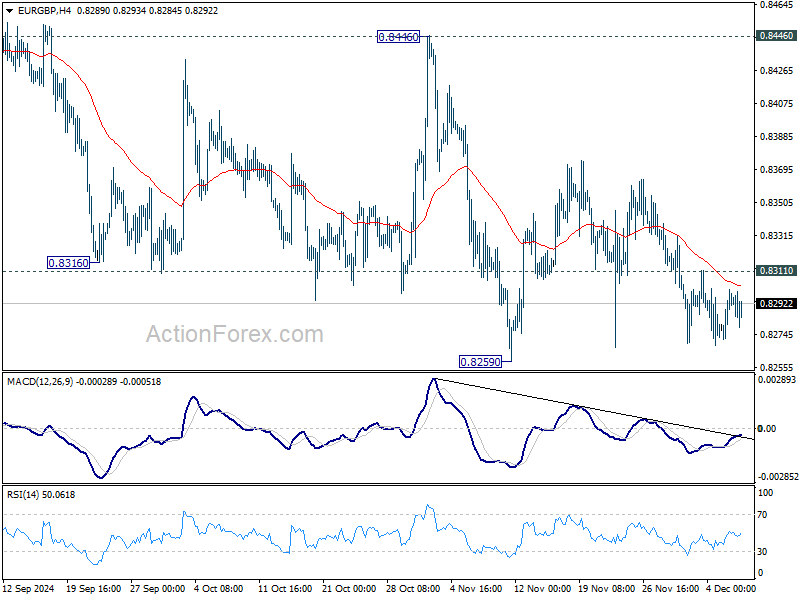
While EUR/GBP decline last week, downside was still contained above 0.8259 support. Initial bias stays neutral this week first. On the downside, decisive break of 0.8259 will resume larger down trend to 0.8201 key support. On the upside, break of 0.8311 minor resistance will turn bias back to the upside for recovery. But still, outlook will stay bearish as long a 0.8446 resistance holds, and downside breakout is expected at a later stage.
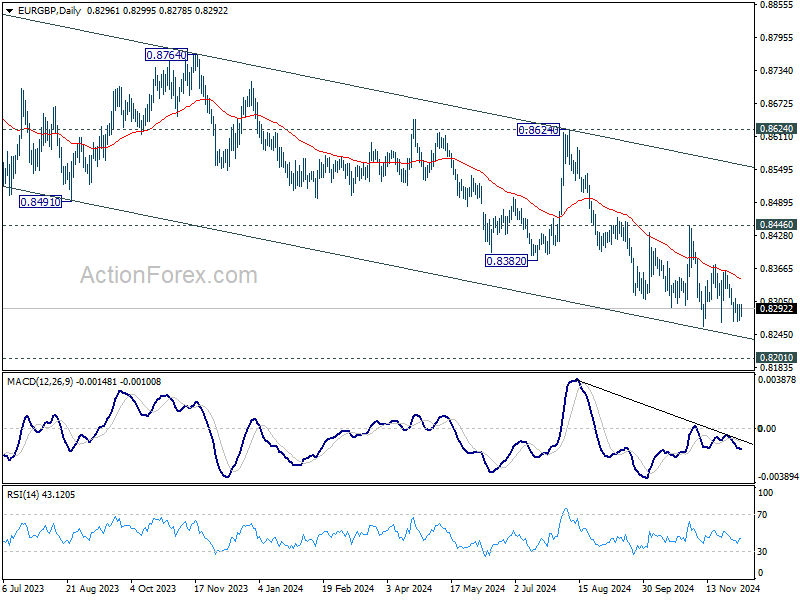
In the bigger picture, down trend from 0.9267 (2022 high) is in progress. Next target is 0.8201 (2022 low), but strong support should be seen there to bring rebound. However, outlook will remain bearish as long as 08.446 resistance holds even in case of strong rebound. Decisive break of 0.8201 will indicate long term bearish reversal.
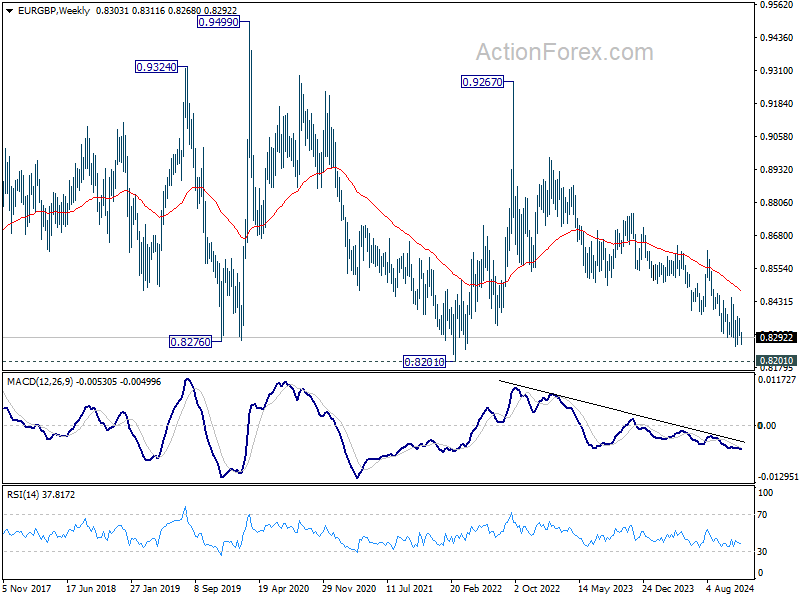
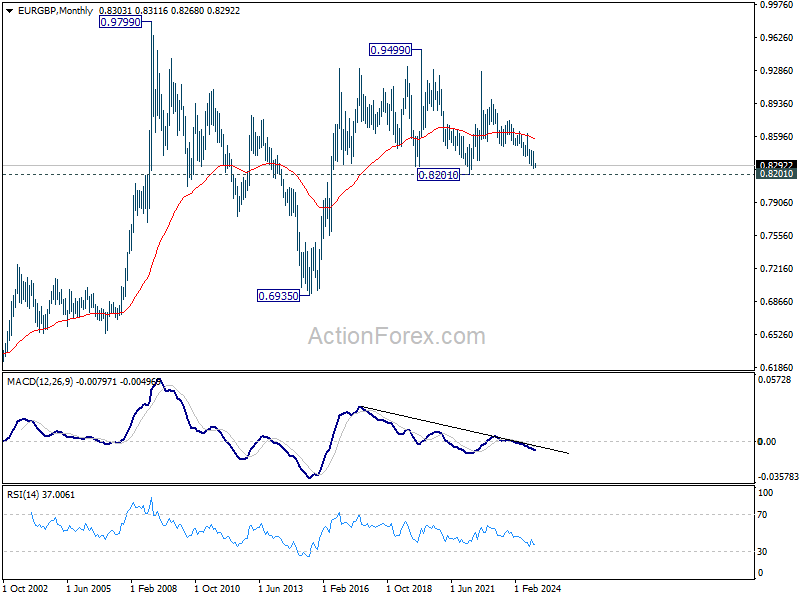
In the long term picture, price action from 0.9499 (2020 high) is seen as part of the long term range pattern from 0.9799 (2008 high). Range trading should continue between 0.8201 and 0.9499, until there is clear signal of imminent breakout.
EUR/AUD Weekly Outlook
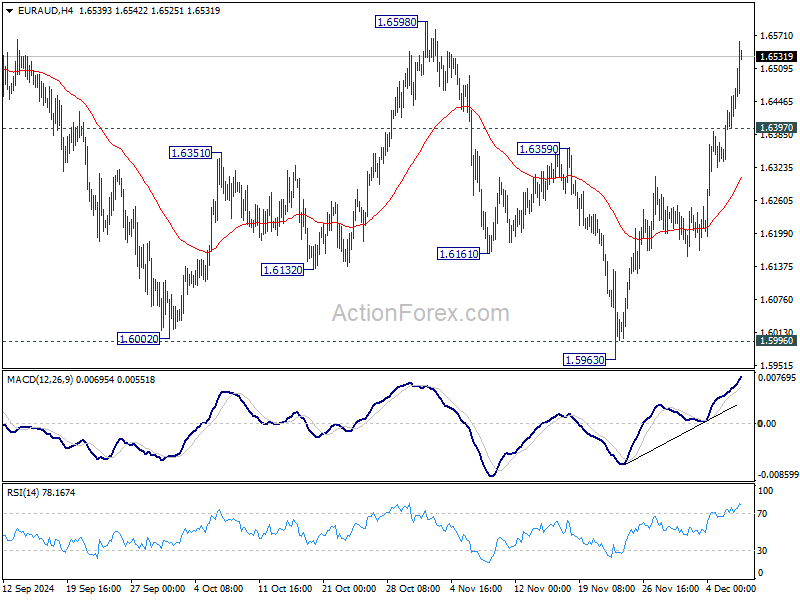
EUR/AUD's strong rally last week argues that the near term trend might be reversing. Initial bias stays on the upside this week for 1.6598 resistance first. Decisive break there will confirm that whole fall from 1.7180 has complete with three waves down to 1.5963, and target a test on 1.7180 next. On the downside, break of 1.6397 minor support will turn intraday bias neutral again first.
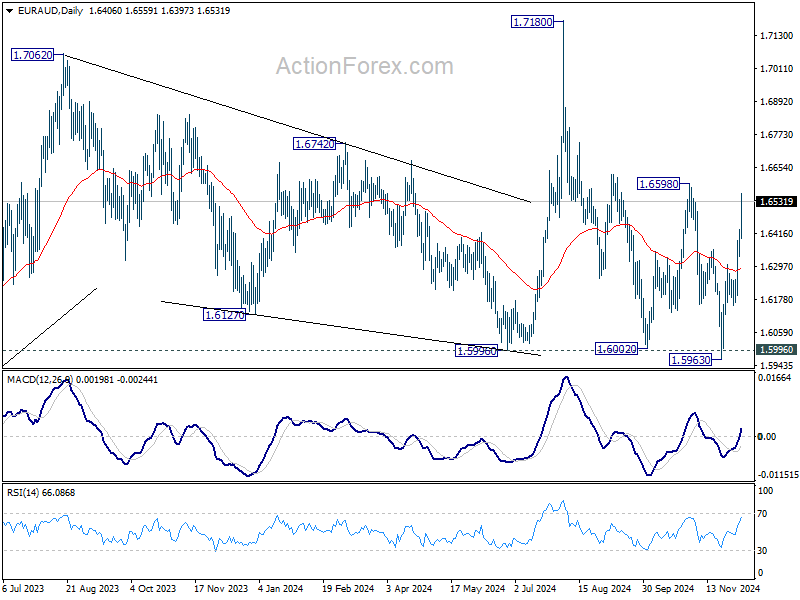
In the bigger picture, EUR/AUD is still holding on to 1.5996 key support despite brief breach. Larger up trend from 1.4281 (2022 low) is still in favor to resume through 1.7180 at a later stage. Nevertheless, sustained break of 1.5995 will indicate that such up trend has completed. Deeper decline would be seen to 61.8% retracement of 1.4281 to 1.7180 at 1.5388, even as a correction.
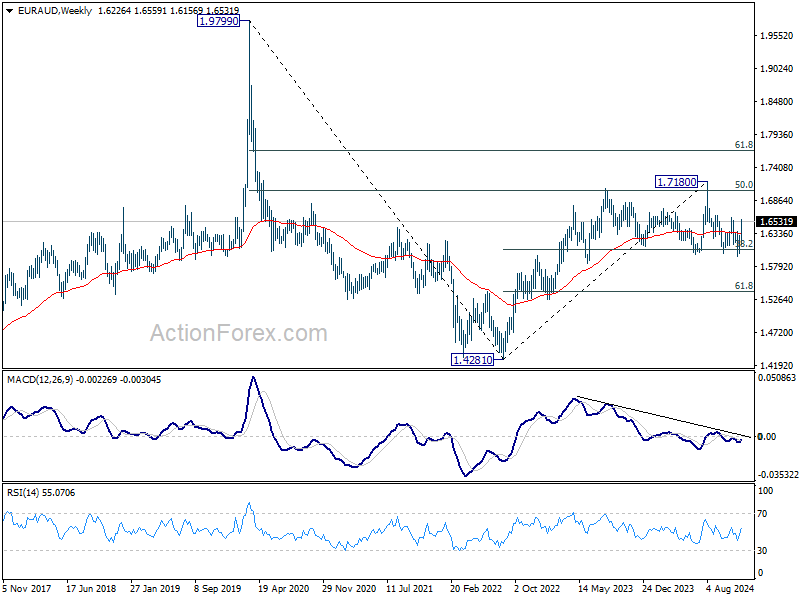
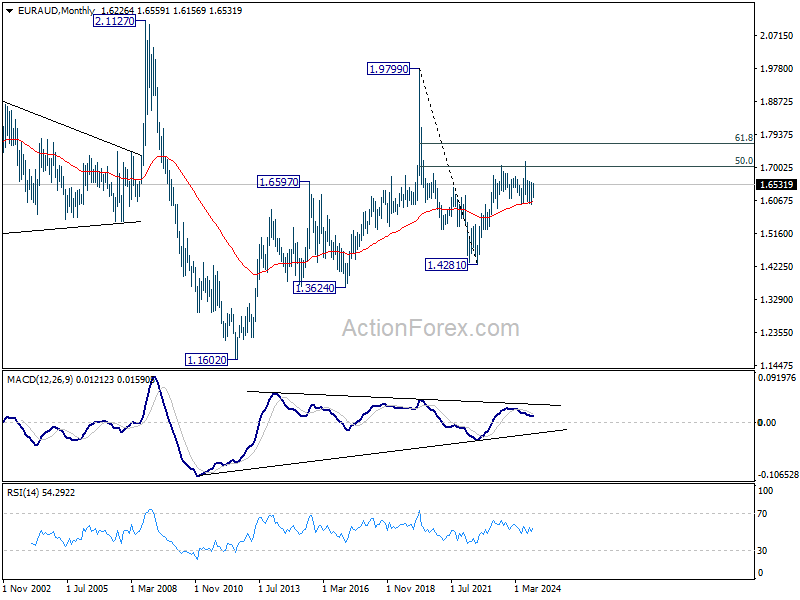
In the longer term picture, rise from 1.4281 is seen as the second leg of the pattern from 1.9799 (2020 high), which is part of the pattern from 2.1127 (2008 high). As long as 55 M EMA (now at 1.6047) holds, this second leg could still extend higher. However, sustained trading below 55 M EMA will open up the bearish case for extending the decline through 1.4281 low.
EUR/CHF Weekly Outlook
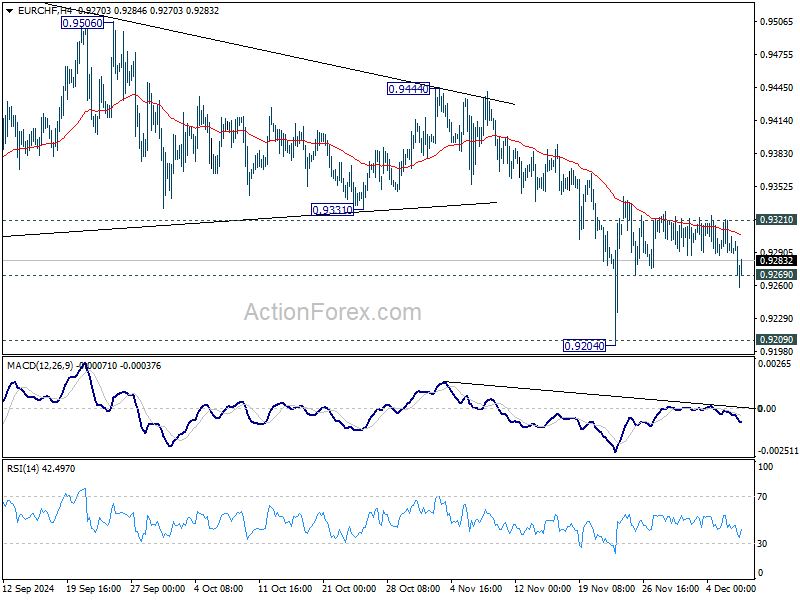
EUR/CHF's late breach of 0.9269 support last week argues that rebound from 0.9204 has completed already, after repeated rejection by falling 55 4H EMA. Initial bias is cautiously on the downside this week. Deeper fall would be seen to retest 0.9204 low. Firm break of 0.9204/9 will indicate larger down trend resumption. Nevertheless, break of 0.9321 resistance will turn bias back to the upside to resume the rebound from 0.9204 instead, and that would be an early sign of bullish reversal for the near term.
In the bigger picture, outlook will now stay bearish as long as 0.9444 resistance holds. Decisive break of 0.9209 low will resume long term down trend to 61.8% projection of 0.9772 to 0.9209 from 0.9444 at 0.9096 next.
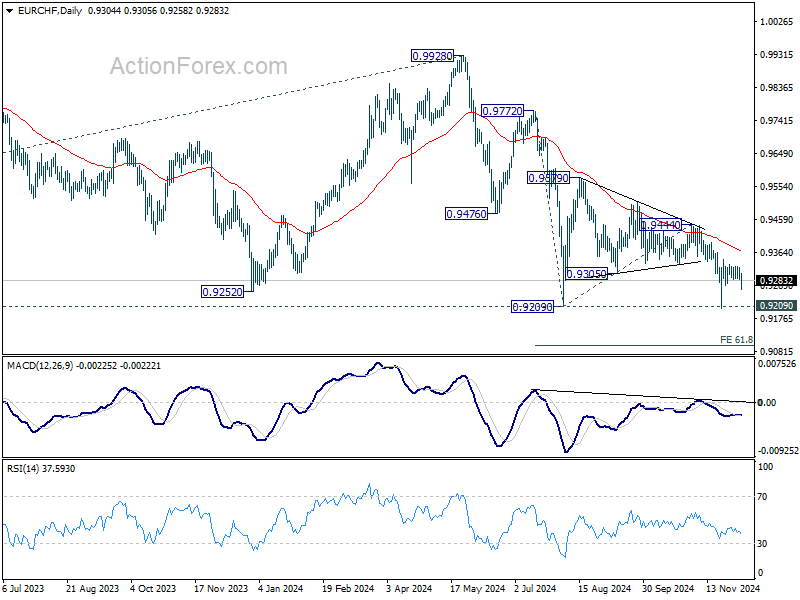
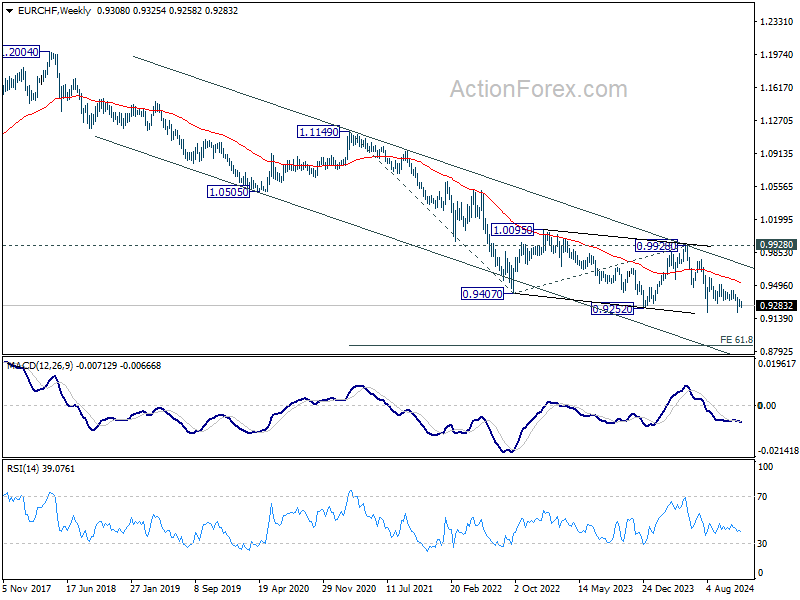
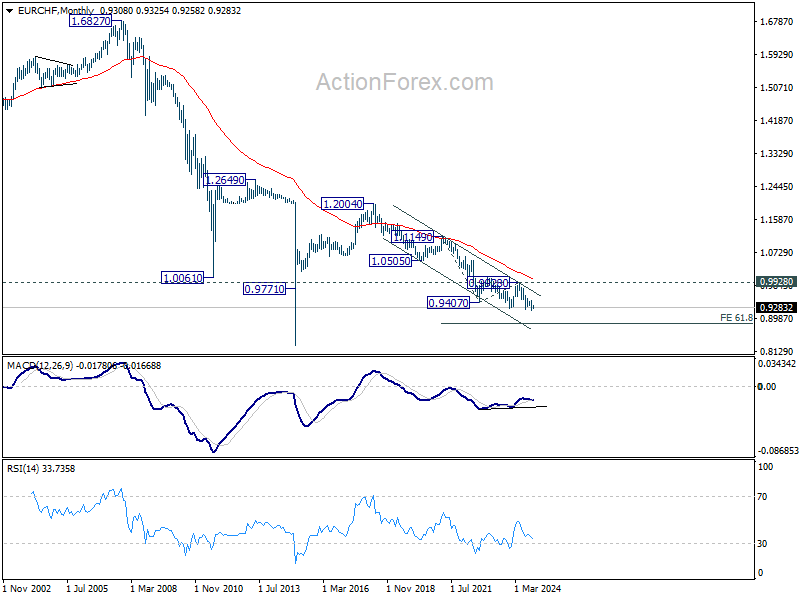
In the long term picture, fall from 1.2004 (2018 high) is part of the multi-decade down trend. Corrective pattern from 0.9407 (2022 low) might have completed with three waves to 0.9928. Decisive break of 0.9252 (2023 low) will confirm long term down trend resumption to 61.8% projection of 1.1149 to 0.9407 from 0.9928 at 0.8851. For now, outlook will stay bearish as long as 0.9928 resistance holds, even in case of strong rebound.
Trump Trade Roars Back, Dollar in Correction, Commodity Currencies Tumble
The resurgence of "Trump Trade" last week reignited optimism across financial markets, driving US stocks to fresh record highs and propelling Bitcoin past the critical 100k psychological level. Investors appeared largely unfazed by a slew of top-tier US economic data and the solidification of expectations for a 25bps Fed rate cut this month. Instead, the market focused on the longer-term implications of President-elect Donald Trump’s pro-business policies, including reduced regulation and a reinvigorated push for US economic dominance.
Dollar saw mixed performance as it extended its correction against European majors but gained strength against commodity-linked currencies. While Fed is widely expected to deliver a 25bs rate cut this month, markets are bracing for a markedly slower pace of easing in 2025. Dollar's underlying strength could resurface soon, bolstered by expectations of policies under Trump that are perceived as supportive of the greenback.
The tariff-related risks, particularly with China, are amplifying uncertainties for commodity-linked currencies. Aussie has emerged as the worst performer among them, plagued by concerns of renewed US-China trade tensions and a lackluster domestic economic outlook. Market chatter about potential material depreciation next year has gained traction, especially as analysts eye a possible acceleration in RBA’s easing cycle.
Meanwhile, European majors have benefited from the Dollar’s correction, but their resilience may be short-lived. Upcoming ECB and SNB meetings could deliver dovish guidance, adding downside risks for Euro and Swiss Franc. Sterling has stood out among European currencies, supported by expectations that BoE will adopt a gradualist approach to policy easing. However, the British currency faces its own challenges, lacking the decisive momentum to break out of its ranges against Euro and Swiss Franc.
Record-Breaking S&P 500 Gains as Fed's December Cut Looks Certain, Yields and Dollar Ease
After a week rich in critical US data, Fed's next move appears increasingly certain. Market expectations for a 25bps rate cut solidified, with Fed fund futures pricing an 86% probability, up from 66% just a week ago. ISM Manufacturing and Services Indexes reflected further softening in the economy, as non-farm payroll report showed slight signs of labor market loosening. While job growth remained robust, it lacked the strength to dissuade Fed from taking another easing step.
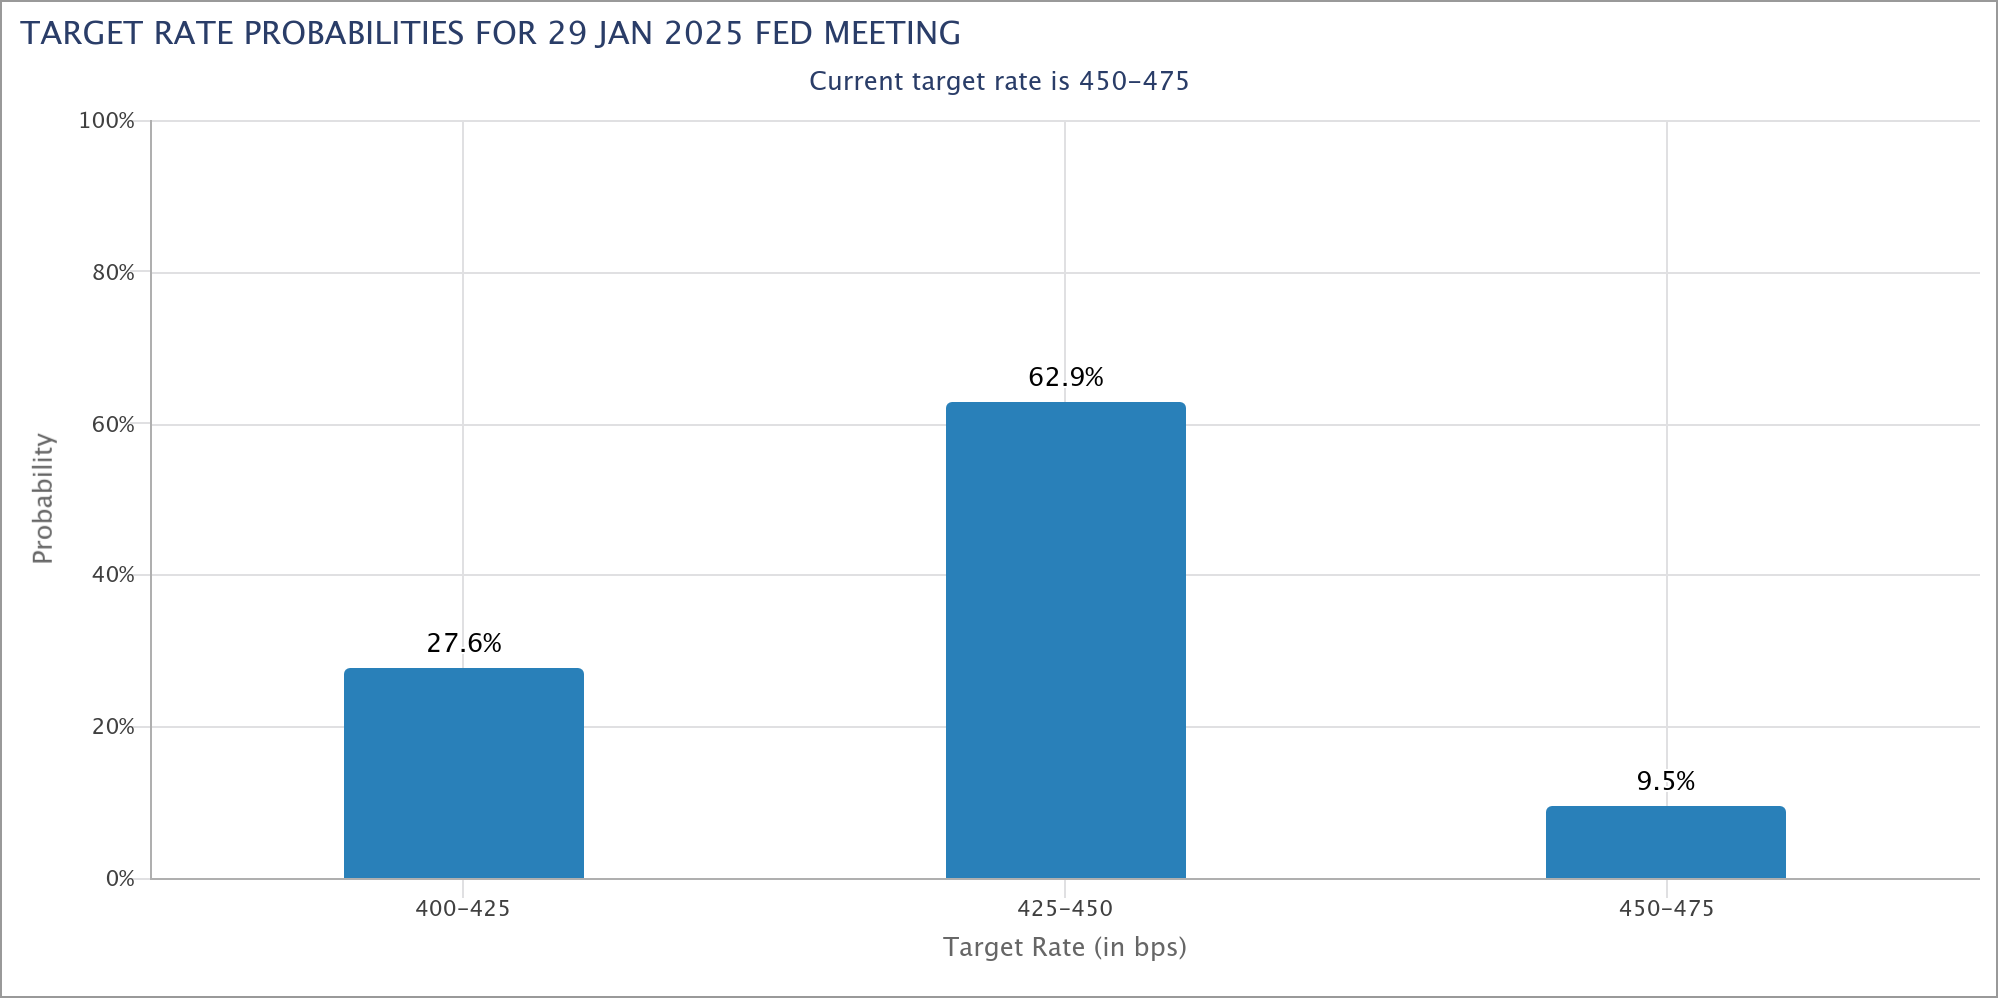
However, attention is pivoting to January, with discussions emerging about a pause in rate reductions, supported by comments from some Fed officials. St. Louis Fed President Alberto Musalem noted the need to "consider slowing the pace of interest rate reductions or pausing," citing the importance of carefully assessing economic conditions and the outlook.
Cleveland Fed President Beth Hammack echoed this cautious approach, suggesting "we are at or near the point where it makes sense to slow the pace of rate reductions", and that "allow us to calibrate policy to the appropriately restrictive level over time given the underlying strength in the economy.”
Reflecting these sentiments, futures markets show only a 27.6% chance of a further 25bps cut in January, compared to a dominant 72.4% expectation for holding rates steady.
The US stock market has embraced the evolving outlook. With the economy demonstrating resilience and Fed pursuing gradual easing, and optimism over the incoming administration’s policies has bolstered sentiment. S&P 500 logged its third consecutive weekly gain, closing at a new record.
Technically, S&P 500 is now entering a resistance zone between 61.8% projection of 4103.78 to 5669.67 from 5119.26 at 6086.98 and medium term rising channel resistance at around 6220. Upside momentum could start to wane in this zone, especially considering that year-end holiday period is approaching.
Nevertheless, outlook will continue to stay bullish as long as 5851.48 support holds. Decisive break of 6080/6220 resistance zone could prompt upside acceleration to 100% projection at 6685.15 in late Q1 or early Q2.
10-year yield extended the decline from 4.505 in reaction to readjusted Fed outlook following NFP. The break of 38.2% retracement of 3.603 to 4.505 at 4.160 suggests that deeper correction is now underway. Further fall is expected as long as 4.281 resistance holds, in case of recovery. TNX would now target 61.8% retracement of 3.603 to 4.505 at 3.947, which is slightly below 4% mark.
The combined environment of risk-on sentiment and falling yields could keep Dollar Index pressured for the near term. Yet, downside would likely be relatively limited considering the slower easing pace of Fed in 2025. Also, the terminal rate of Fed in the current cycle would likely be higher than most of the peers, at least comparing to ECB.
Technically, the structure of the fall from 108.07 is also corrective. So, in case of deeper correction, strong support would likely be seen between 55 D EMA (now at 104.82) and 38.2% retracement of 100.15 to 108.07 at 105.04 to contain downside. Meanwhile, break of 106.72 resistance will indicate that the corrective pattern from 108.07 has already started the second leg back towards this high.
Tech and Crypto Surge as Trump’s Picks Stoke Optimism
The US tech sector and cryptocurrency markets closed the week with significant gains, riding a wave of optimism fueled by the Trump administration’s pro-crypto and tech-focused appointments. Paul Atkins, a well-known advocate for digital innovation, has been nominated to lead the SEC, a move widely interpreted as a green light for regulatory support of the cryptocurrency space. Meanwhile, the naming of former PayPal COO David Sacks as "White House AI & Crypto Czar" added further momentum, energizing both tech and crypto investors. These developments propelled Bitcoin past the 100k milestone and pushed the NASDAQ to new all-time highs.
Technically, NASDAQ's up trend made notable progress by breaking through 61.8% projection of 12543.85 to 18671.06 from 15708.53 at 19366.06. 20k handle is now within reach, but the key hurdle lies in medium term rising channel resistance at around 20300. Decisive break of this level could prompt upside acceleration to 100% projection at 21835.75. In any case, outlook will now stay bullish as long as 18702.37 support holds.
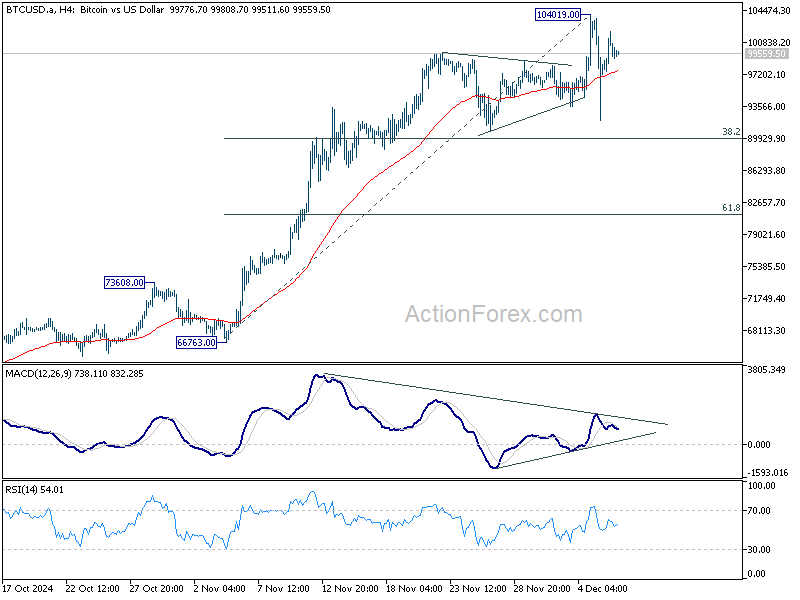
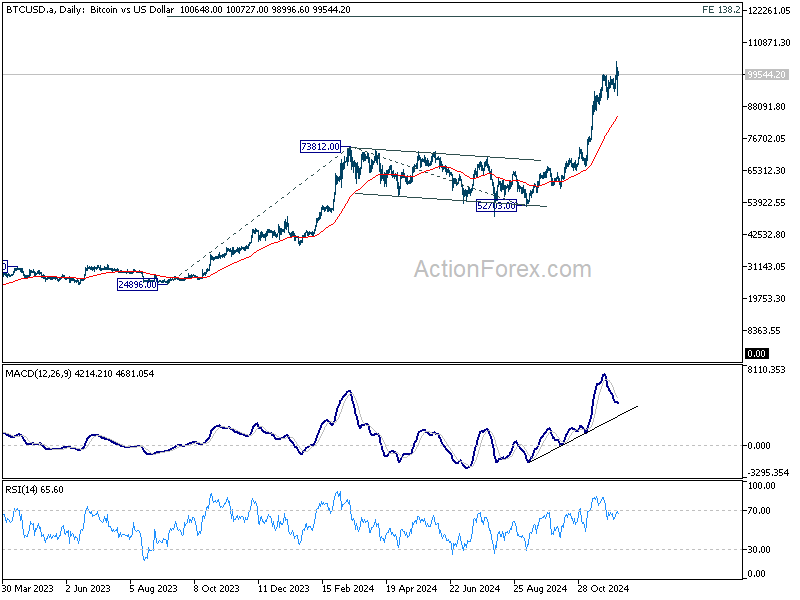
Bitcoin's week was characterized by dramatic volatility. The cryptocurrency achieved a historic high of 104019 before a steep pullback, attributed to a USD 1B liquidation wave within 24 hours of crossing the 100k mark. However, the swift rebound underscored the market's resilience, as bullish sentiment quickly returned.
Technically, while some consolidations could be seen in Bitcoin in the near term, outlook will stay bullish as long as 38.2% retracement of 66763. to 104019 at 89787 holds. Break of 104019 will resume larger up trend towards 138.2% projection of 24896 to 73812 from 52703 at 120304.
The momentum for Bitcoin’s next rally could be significant, particularly if traders who closed long positions during the pullback re-enter the market.
Rapid RBA Policy Shifts Could Trigger Significant Downside for AUD in Coming Year
Commodity-linked currencies were the outliers this week, underperforming despite a broader surge in risk-on sentiment. Persistent fears over a potential tariff war between the U.S., Canada, and China have been a significant drag on currencies like the Australian and Canadian dollars. Adding to the pressure, the U.S. dollar remained resilient as expectations solidified for a slower pace of Fed rate cuts, further weighing on commodity currencies.
Aussie has been particularly vulnerable, with analysts revising their outlooks. The Commonwealth Bank of Australia now anticipates AUD could fall "materially" to as low as 0.60 against USD next year.
RBA remains hesitant to commence monetary easing, with May 2025 still seen as the most likely timing for the first rate cut, not even February. However, weaker-than-expected Q3 GDP data has highlighted the fragility of the Australian economy. The narrative regarding RBA's policy easing could shift if disinflation accelerates significantly in Q1, forcing the central bank to ease faster than originally expected once the cycle commences.
China’s economic sluggishness adds another layer of uncertainty for AUD. Despite stimulus measures, the Chinese economy continues to underperform, compounded by renewed trade tensions with the US. Should these pressures escalate, Australia’s trade-reliant economy could face additional headwinds, amplifying downside risks for its currency.
Technically, one of the various interpretation of the price actions from 0.6169 (2022 low) is that the medium term consolidation pattern from 0.6169 has completed with three waves to 0.6941. That is, the down trend from 0.8006 (2021 high) might be ready to resume. While it's still early to make a conclusion, break of 0.6269 support would support this bearish case. The medium term target could be tentatively set at 61.8% projection of 0.8006 to 0.6169 from 0.6941 at 0.5806.
USD/CAD Weekly Outlook
While USD/CAD extended the consolidations from 1.4177 last week, the late surge argues that larger up trend might be ready to resume. Immediate focus is now on 1.4177 resistance this week. Decisive break there will confirm this bullish case and target 1.4391 projection level next. Rejection by 1.4177 will delay the bullish case and bring more consolidations. But outlook will continue to stay bullish as long as 1.3980 support holds.
In the bigger picture, up trend from 1.2005 (2021) is in progress. Next target is 61.8% projection of 1.2401 to 1.3976 from 1.3418 at 1.4391. Now, medium term outlook will remain bullish as long as 1.3418 support holds, even in case of deep pullback.
In the longer term picture, price actions from 1.4689 (2016 high) are seen as a consolidation pattern, which might have completed at 1.2005. That is, up trend from 0.9506 (2007 low) is expected to resume at a later stage. This will remain the favored case as long as 1.3418 support holds.
Summary 12/9 – 12/13
Monday, Dec 9, 2024
| GMT | Ccy | Events | Consensus | Previous |
|---|---|---|---|---|
| 23:50 | JPY | Bank Lending Y/Y Nov | 2.60% | 2.70% |
| 23:50 | JPY | GDP Q/Q Q3 F | 0.20% | 0.20% |
| 23:50 | JPY | GDP Deflator Y/Y Q3 F | 2.50% | 2.60% |
| 23:50 | JPY | Current Account (JPY) Oct | 2.28T | 1.27T |
| 01:30 | CNY | CPI Y/Y Nov | 0.50% | 0.30% |
| 01:30 | CNY | PPI Y/Y Nov | -2.90% | -2.90% |
| 05:00 | JPY | Eco Watchers Survey: Current Nov | 47.3 | 47.5 |
| 09:30 | EUR | Eurozone Sentix Investor Confidence Dec | -13.1 | -12.8 |
| 15:00 | USD | Wholesale Inventories Oct F | 0.20% | 0.20% |
| 23:50 | JPY | Money Supply M2+CD Y/Y Nov | 1.20% | 1.20% |
| GMT | Ccy | Events | |
|---|---|---|---|
| 23:50 | JPY | Bank Lending Y/Y Nov | |
| Forecast: 2.60% | Previous: 2.70% | ||
| 23:50 | JPY | GDP Q/Q Q3 F | |
| Forecast: 0.20% | Previous: 0.20% | ||
| 23:50 | JPY | GDP Deflator Y/Y Q3 F | |
| Forecast: 2.50% | Previous: 2.60% | ||
| 23:50 | JPY | Current Account (JPY) Oct | |
| Forecast: 2.28T | Previous: 1.27T | ||
| 01:30 | CNY | CPI Y/Y Nov | |
| Forecast: 0.50% | Previous: 0.30% | ||
| 01:30 | CNY | PPI Y/Y Nov | |
| Forecast: -2.90% | Previous: -2.90% | ||
| 05:00 | JPY | Eco Watchers Survey: Current Nov | |
| Forecast: 47.3 | Previous: 47.5 | ||
| 09:30 | EUR | Eurozone Sentix Investor Confidence Dec | |
| Forecast: -13.1 | Previous: -12.8 | ||
| 15:00 | USD | Wholesale Inventories Oct F | |
| Forecast: 0.20% | Previous: 0.20% | ||
| 23:50 | JPY | Money Supply M2+CD Y/Y Nov | |
| Forecast: 1.20% | Previous: 1.20% | ||
Tuesday, Dec 10, 2024
| GMT | Ccy | Events | Consensus | Previous |
|---|---|---|---|---|
| 00:30 | AUD | NAB Business Conditions Nov | 7 | |
| 00:30 | AUD | NAB Business Confidence Nov | 5 | |
| 03:00 | CNY | Trade Balance (USD) Nov | 92.0B | 95.7B |
| 03:30 | AUD | RBA Interest Rate Decision | 4.35% | 4.35% |
| 04:30 | AUD | RBA Press Conference | ||
| 06:00 | JPY | Machine Tool Orders Y/Y Nov P | 9.30% | |
| 07:00 | EUR | Germany CPI M/M Nov F | -0.20% | -0.20% |
| 07:00 | EUR | Germany CPI Y/Y Nov F | 2.20% | 2.20% |
| 11:00 | USD | NFIB Business Optimism Index Nov | 94.2 | 93.7 |
| 13:30 | USD | Nonfarm Productivity Q3 | 2.30% | 2.20% |
| 13:30 | USD | Unit Labor Costs Q3 | 1.80% | 1.90% |
| 21:45 | NZD | Manufacturing Sales Q3 | 0.10% | |
| 23:50 | JPY | PPI Y/Y Nov | 3.40% | 3.40% |
| 23:50 | JPY | BSI Large Manufacturing Index Q4 | 4.5 |
| GMT | Ccy | Events | |
|---|---|---|---|
| 00:30 | AUD | NAB Business Conditions Nov | |
| Forecast: | Previous: 7 | ||
| 00:30 | AUD | NAB Business Confidence Nov | |
| Forecast: | Previous: 5 | ||
| 03:00 | CNY | Trade Balance (USD) Nov | |
| Forecast: 92.0B | Previous: 95.7B | ||
| 03:30 | AUD | RBA Interest Rate Decision | |
| Forecast: 4.35% | Previous: 4.35% | ||
| 04:30 | AUD | RBA Press Conference | |
| Forecast: | Previous: | ||
| 06:00 | JPY | Machine Tool Orders Y/Y Nov P | |
| Forecast: | Previous: 9.30% | ||
| 07:00 | EUR | Germany CPI M/M Nov F | |
| Forecast: -0.20% | Previous: -0.20% | ||
| 07:00 | EUR | Germany CPI Y/Y Nov F | |
| Forecast: 2.20% | Previous: 2.20% | ||
| 11:00 | USD | NFIB Business Optimism Index Nov | |
| Forecast: 94.2 | Previous: 93.7 | ||
| 13:30 | USD | Nonfarm Productivity Q3 | |
| Forecast: 2.30% | Previous: 2.20% | ||
| 13:30 | USD | Unit Labor Costs Q3 | |
| Forecast: 1.80% | Previous: 1.90% | ||
| 21:45 | NZD | Manufacturing Sales Q3 | |
| Forecast: | Previous: 0.10% | ||
| 23:50 | JPY | PPI Y/Y Nov | |
| Forecast: 3.40% | Previous: 3.40% | ||
| 23:50 | JPY | BSI Large Manufacturing Index Q4 | |
| Forecast: | Previous: 4.5 | ||
Wednesday, Dec 11 2024
| GMT | Ccy | Events | Consensus | Previous |
|---|---|---|---|---|
| 13:30 | USD | CPI M/M Nov | 0.20% | 0.20% |
| 13:30 | USD | CPI Y/Y Nov | 2.70% | 2.60% |
| 13:30 | USD | CPI Core M/M Nov | 0.30% | 0.30% |
| 13:30 | USD | CPI Core Y/Y Nov | 3.30% | 3.30% |
| 14:45 | CAD | BoC Interest Rate Decision | 3.25% | 3.75% |
| 15:30 | USD | Crude Oil Inventories | -5.1M |
| GMT | Ccy | Events | |
|---|---|---|---|
| 13:30 | USD | CPI M/M Nov | |
| Forecast: 0.20% | Previous: 0.20% | ||
| 13:30 | USD | CPI Y/Y Nov | |
| Forecast: 2.70% | Previous: 2.60% | ||
| 13:30 | USD | CPI Core M/M Nov | |
| Forecast: 0.30% | Previous: 0.30% | ||
| 13:30 | USD | CPI Core Y/Y Nov | |
| Forecast: 3.30% | Previous: 3.30% | ||
| 14:45 | CAD | BoC Interest Rate Decision | |
| Forecast: 3.25% | Previous: 3.75% | ||
| 15:30 | USD | Crude Oil Inventories | |
| Forecast: | Previous: -5.1M | ||
Thursday, Dec 12, 2024
| GMT | Ccy | Events | Consensus | Previous |
|---|---|---|---|---|
| 00:30 | AUD | Employment Change Nov | 29.6K | 15.9K |
| 00:30 | AUD | Unemployment Rate Nov | 4.20% | 4.10% |
| 08:30 | CHF | SNB Interest Rate Decision | 0.75% | 1.00% |
| 09:00 | CHF | SNB Press Conference | ||
| 13:15 | EUR | ECB Main Refinancing Rate | 3.15% | 3.40% |
| 13:15 | EUR | ECB Deposit Rate | 3.00% | 3.25% |
| 13:30 | USD | PPI M/M Nov | 0.30% | 0.20% |
| 13:30 | USD | PPI Y/Y Nov | 2.50% | 2.40% |
| 13:30 | USD | PPI Core M/M Nov | 0.30% | 0.30% |
| 13:30 | USD | PPI Core Y/Y Nov | 3.30% | 3.10% |
| 13:30 | USD | Initial Jobless Claims (Dec 6) | 221K | 224K |
| 13:30 | CAD | Building Permits M/M Oct | 11.50% | |
| 13:45 | EUR | ECB Press Conference | ||
| 15:30 | USD | Natural Gas Storage | -30B | |
| 21:30 | NZD | Business NZ PMI Nov | 45.8 | |
| 23:50 | JPY | Tankan Large Manufacturing Index Q4 | 13 | 13 |
| 23:50 | JPY | Tankan Large Manufacturing Outlook Q4 | 11 | 14 |
| 23:50 | JPY | Tankan Non - Manufacturing Index Q4 | 33 | 34 |
| 23:50 | JPY | Tankan Non - Manufacturing Outlook Q4 | 28 | 28 |
| 23:50 | JPY | Tankan Large All Industry Capex Q4 | 9.60% | 10.60% |
| GMT | Ccy | Events | |
|---|---|---|---|
| 00:30 | AUD | Employment Change Nov | |
| Forecast: 29.6K | Previous: 15.9K | ||
| 00:30 | AUD | Unemployment Rate Nov | |
| Forecast: 4.20% | Previous: 4.10% | ||
| 08:30 | CHF | SNB Interest Rate Decision | |
| Forecast: 0.75% | Previous: 1.00% | ||
| 09:00 | CHF | SNB Press Conference | |
| Forecast: | Previous: | ||
| 13:15 | EUR | ECB Main Refinancing Rate | |
| Forecast: 3.15% | Previous: 3.40% | ||
| 13:15 | EUR | ECB Deposit Rate | |
| Forecast: 3.00% | Previous: 3.25% | ||
| 13:30 | USD | PPI M/M Nov | |
| Forecast: 0.30% | Previous: 0.20% | ||
| 13:30 | USD | PPI Y/Y Nov | |
| Forecast: 2.50% | Previous: 2.40% | ||
| 13:30 | USD | PPI Core M/M Nov | |
| Forecast: 0.30% | Previous: 0.30% | ||
| 13:30 | USD | PPI Core Y/Y Nov | |
| Forecast: 3.30% | Previous: 3.10% | ||
| 13:30 | USD | Initial Jobless Claims (Dec 6) | |
| Forecast: 221K | Previous: 224K | ||
| 13:30 | CAD | Building Permits M/M Oct | |
| Forecast: | Previous: 11.50% | ||
| 13:45 | EUR | ECB Press Conference | |
| Forecast: | Previous: | ||
| 15:30 | USD | Natural Gas Storage | |
| Forecast: | Previous: -30B | ||
| 21:30 | NZD | Business NZ PMI Nov | |
| Forecast: | Previous: 45.8 | ||
| 23:50 | JPY | Tankan Large Manufacturing Index Q4 | |
| Forecast: 13 | Previous: 13 | ||
| 23:50 | JPY | Tankan Large Manufacturing Outlook Q4 | |
| Forecast: 11 | Previous: 14 | ||
| 23:50 | JPY | Tankan Non - Manufacturing Index Q4 | |
| Forecast: 33 | Previous: 34 | ||
| 23:50 | JPY | Tankan Non - Manufacturing Outlook Q4 | |
| Forecast: 28 | Previous: 28 | ||
| 23:50 | JPY | Tankan Large All Industry Capex Q4 | |
| Forecast: 9.60% | Previous: 10.60% | ||
Friday, Dec 13, 2024
| GMT | Ccy | Events | Consensus | Previous |
|---|---|---|---|---|
| 00:01 | GBP | GfK Consumer Confidence Dec | -18 | |
| 04:30 | JPY | Industrial Production M/M Oct F | 3% | 3% |
| 07:00 | GBP | GDP M/M Oct | -0.10% | |
| 07:00 | GBP | Industrial Production M/M Oct | -0.50% | |
| 07:00 | GBP | Industrial Production Y/Y Oct | -1.80% | |
| 07:00 | GBP | Manufacturing Production M/M Oct | -1% | |
| 07:00 | GBP | Manufacturing Production Y/Y Oct | -0.70% | |
| 07:00 | GBP | Goods Trade Balance (GBP) Oct | -16.3B | |
| 07:00 | EUR | GermanyTrade Balance (EUR) Oct | 15.8B | 17.0B |
| 10:00 | EUR | Eurozone Industrial Production M/M Oct | 0.00% | -2.00% |
| 13:30 | CAD | Manufacturing Sales M/M Oct | -0.50% | |
| 13:30 | CAD | Capacity Utilization Q3 | 79.10% | |
| 13:30 | CAD | Wholesale Sales M/M Oct | 0.80% | |
| 13:30 | USD | Import Price Index M/M Nov | -0.30% | 0.30% |
| GMT | Ccy | Events | |
|---|---|---|---|
| 00:01 | GBP | GfK Consumer Confidence Dec | |
| Forecast: | Previous: -18 | ||
| 04:30 | JPY | Industrial Production M/M Oct F | |
| Forecast: 3% | Previous: 3% | ||
| 07:00 | GBP | GDP M/M Oct | |
| Forecast: | Previous: -0.10% | ||
| 07:00 | GBP | Industrial Production M/M Oct | |
| Forecast: | Previous: -0.50% | ||
| 07:00 | GBP | Industrial Production Y/Y Oct | |
| Forecast: | Previous: -1.80% | ||
| 07:00 | GBP | Manufacturing Production M/M Oct | |
| Forecast: | Previous: -1% | ||
| 07:00 | GBP | Manufacturing Production Y/Y Oct | |
| Forecast: | Previous: -0.70% | ||
| 07:00 | GBP | Goods Trade Balance (GBP) Oct | |
| Forecast: | Previous: -16.3B | ||
| 07:00 | EUR | GermanyTrade Balance (EUR) Oct | |
| Forecast: 15.8B | Previous: 17.0B | ||
| 10:00 | EUR | Eurozone Industrial Production M/M Oct | |
| Forecast: 0.00% | Previous: -2.00% | ||
| 13:30 | CAD | Manufacturing Sales M/M Oct | |
| Forecast: | Previous: -0.50% | ||
| 13:30 | CAD | Capacity Utilization Q3 | |
| Forecast: | Previous: 79.10% | ||
| 13:30 | CAD | Wholesale Sales M/M Oct | |
| Forecast: | Previous: 0.80% | ||
| 13:30 | USD | Import Price Index M/M Nov | |
| Forecast: -0.30% | Previous: 0.30% | ||