Sample Category Title
EUR/CHF Daily Outlook
Daily Pivots: (S1) 0.9259; (P) 0.9289; (R1) 0.9317; More....
Intraday bias in EUR/CHF stays mildly on the downside at this point. Recovery fro 0.9204 could have completed after repeated rejection by falling 55 4H EMA. Deeper fall would be seen to retest 0.9204 low. Firm break of 0.9204/9 will indicate larger down trend resumption. Nevertheless, break of 0.9321 resistance will turn bias back to the upside to resume the rebound from 0.9204 instead, and that would be an early sign of bullish reversal for the near term.
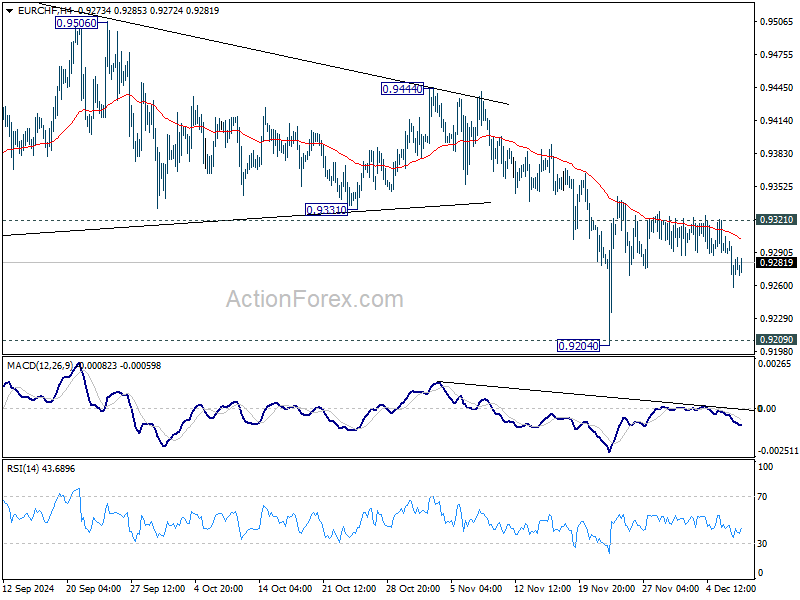
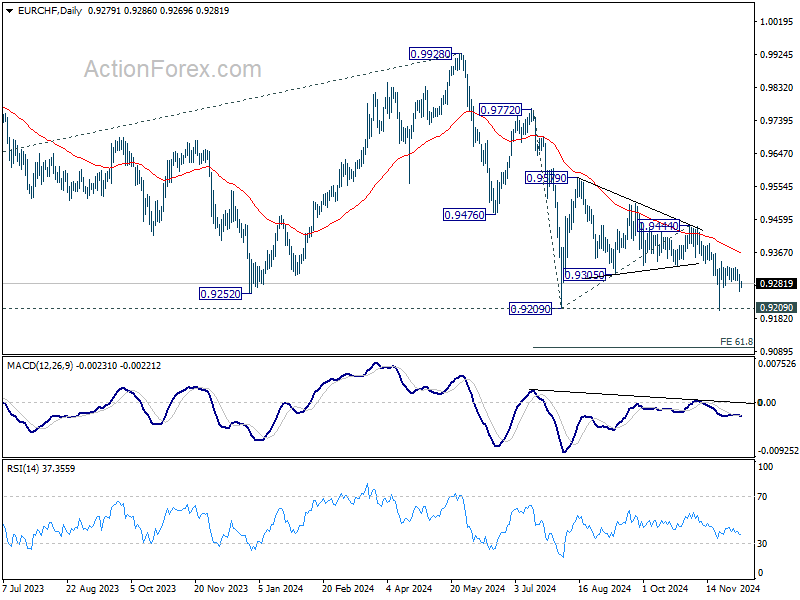
In the bigger picture, outlook will now stay bearish as long as 0.9444 resistance holds. Decisive break of 0.9209 low will resume long term down trend to 61.8% projection of 0.9772 to 0.9209 from 0.9444 at 0.9096 next.
US Treasuries’ Outperformance vs German Bunds Didn’t Help EUR/USD
Markets
US November payrolls cemented the case for a 25 bps rate cut by the Fed. That scenario wasn’t completely discounted (70%) ahead of the numbers. While headline payrolls growth rebounded to 227k (with an additional 56k upward revision to September & October figures), the accompanying household survey made a more grim reading. With a 193k decline in the workforce, a 355k decline in employment, a rise in the unemployment rate from 4.1% to 4.2% and a decline in the participation rate from 62.6% to 62.5%. US Treasuries spiked lower on the headline number, but rapidly looked higher. The move topped out after the release of December University of Michigan consumer confidence. A fifth consecutive increase brings the index at 74 (best since April) with details showing short term inflation expectations (1y) rising from 2.6% to 2.9% and ending the decline from 3.3% in May. Longer-term inflation expectations were broadly stable (3.1% from 3.2%). Fed governor Bowman, who dissented at the September meeting in favour of a smaller 25 bps rate cut, reiterated that she wants to proceed cautiously and gradually in lowering the policy rate as underlying inflation remains uncomfortably above the 2% target. She thinks that the neutral rate moved higher with the current policy rate not being restrictive. The US yield curve eventually bull steepened with yields losing up to 4 bps at the front end of the curve. The US Treasuries’ outperformance vs German Bunds (yields up to 2 bps lower) didn’t help EUR/USD. A brief uptick above 1.06 was rapidly undone with the pair closing at 1.0568. After market close, rating agency Fitch raised the outlook on the Hungarian BBB rating from negative to stable. They cite an easing of policy uncertainty, prudent monetary easing, a moderation of inflation, the balanced primary fiscal position, an improvement in the current account and a projected fall in debt as key reasons. At EUR/HUF 413.50, the forint remains weak.
The fall of Syrian president al-Assad’s government is omnipresent this morning. If any, it triggers some minor safe haven flows at the start of the trading week given uncertainty over how the power vacuum will be solved and what it will mean for the wider region. Both the dollar and US Treasuries eke out small gains. Today’s eco calendar is empty, suggesting that risk sentiment will continue dominating broader markets. The agenda turns more interesting later this week with US CPI numbers (Wednesday) and central bank meetings in Australia (tomorrow), Canada (Wednesday), Switzerland and EMU (both Thursday).
News & Views
Chinese consumer inflation unexpectedly eased from 0.3% to 0.2% y/y in November. Slowing food prices were among the key forces weighing down on the numbers. The 0.9% m/m increase came after a +/- 2% jump over the past few months which reflected the impact of heavy rain in the summer on food production. Core inflation picked up for a second month straight, be it to a very low 0.3% y/y still. Producer prices eased 2.5%, extending the deflation streak in place since October 2022. It was, however, a smaller drop than in October (-2.9%) and than expected (-2.8%). The inflation numbers suggest the range of stimulus measures have yet to show a significant impact on the economy. They raise the stakes for Wednesday’s Central Economic Work Conference. The meeting behind closed doors will be to discuss next year’s growth target, probably the same as 2024’s (+/- 5%) and additional stimulus measures to get it done. China’s yuan loses marginal ground this morning towards USD/CNY 7.28.
Rating agency Fitch said that the French government collapse threatens the country’s necessary fiscal consolidation efforts. It said the recently ousted Barnier’s 5% target for next year is now “very unlikely”. The developments also put serious question marks to France’s medium-term plan to reduce the deficit over an EC-approved 7-year term. Fitch now expects fiscal gaps above 5% to lead to a steep rise in government debt towards 118.5% of GDP by 2028, adding that the lack of a “credible medium-term fiscal consolidation plan that would lead to a stabilization of debt in the medium term is one of the main downgrade sensitivities for France’s ratings.” The rating agency recently lowered France’s growth forecasts from 1.2% to 0.9% and noted that slowing growth could hamper the fiscal tightening. While France faces no serious financing challenges, Fitch says, the political crisis has raised its borrowing costs. If permanently, these will further compound the challenges.
A Big Week for Central Banks
Bashar al-Assad's regime fell over the weekend, Korean lawmakers prepare another impeachment attempt against their President who narrowly avoided removal after briefly imposing martial law last week, and France remains without a new presidential nominee.
As such, the US Dollar is stronger on safety demand and crude Oil is better bid on renewed political uncertainty in the Middle East. But the Syrian news will unlikely reverse the bearish oil trend. Although the Syrian uncertainty could temporarily hit their oil exports, the country exports less than 100K barrels per day, down from 600K in 2011. Therefore, developments in Syria would more likely than not bring more barrels to the market and add to the global supply in the coming months.
Data and central bank decisions
The latest economic data from China has failed to impress, as consumer deflation deepened last month. While the pace of deflation in producer prices slowed, it was not enough to draw conclusions about the effectiveness of China's recent stimulus measures.
Consequently, the data boosts the expectation that the Chinese government would announce more fiscal support this week when the officials meet at the Central Economic Work Conference. But given the government’s unwillingness to announce a massive fiscal stimulus package, the arm wrestle between the authorities—who speak of a big stimulus but fall short of naming a figure—and investors, who are determined to hear one, will continue. The CSI 300 is downbeat this Monday.
In the FX, the US dollar is better bid this morning, probably due to a certain appetite for safety in the middle of a global political jungle, but fundamentally, the Federal Reserve (Fed) news are soothing – and supportive of a softer US dollar if we filter out the safety inflows. Released last Friday, the US official jobs data sat near the sweetest possible spot for the Fed watchers. The NFP printed a strong 227K new nonfarm job additions last month, but was widely disregarded due to the disruptions from hurricanes and strikes of the month before. All eyes were on the unemployment number that came in slightly higher than expected. The data would be just perfect if the wages growth didn’t print a higher than expected number. The US dollar first fell than rebounded on the data but the Fed doves remained in a mood to bet for a Xmas rate cut from the Fed and buy more of the S&P500 and Nasdaq stocks. The US 2-year yield extended a decline, the S&P500 printed its 57th record high this week – meaning that the S&P500 printed a record high every four trading days so far this year – and Nasdaq 100 closed at a fresh record high as well. The Dow Jones continued to diverge negatively from its tech-heavy peers. The probability of a 25bp cut from the Fed in December shot up to 83% from around 70%.
This week’s CPI data will be the last piece of the puzzle before the Fed meets next week. The CPI number is expected to print a small uptick in November, but should not compromise a December Fed cut. January however will probably be a close call.
Elsewhere, the week will be packed with central bank decision. The European Central Bank (ECB), the Bank of Canada (BoC), the Reserve Bank of Australia (RBA) and the Swiss National Bank (SNB) will announce their latest policy verdict throughout this week and all – except the RBA – are expected to lower their rates. The BoC is expected to cut by 50bp while the SNB and the ECB are expected to announce a 25bp cut. Some investors are convinced that the ECB could announce more than a 25bp cut. Either it could go bigger with a 50bp cut, or cut by 25bp but shift their focus from inflation to economic growth. I believe that the second option is more plausible. If that’s the case, we should not see a significant selloff in the euro post-decision.
An Eventful Week Ahead
In focus today
In the euro area, the Sentix indicator will give us the first indication of the European investor confidence in December.
Overnight, the Reserve Bank of Australia (RBA) will have a monetary policy meeting. We expect an unchanged rate decision, which is the clear base case by consensus as well. Markets price in a very slim (10%) chance of RBA initiating its rate cutting cycle.
The rest of the week will be eventful with several key releases. In China, the top leadership will meet on Wednesday and Thursday to discuss the economic priorities for the coming year. Wednesday's star of the show is the US CPI for November, and Bank of Canada also announces its rate decision on the same day. On Thursday, the Swedish inflation is out in the morning, followed by the SNB's monetary policy decision. The ECB announces their deposit rate on Thursday afternoon. Early on Friday, the BoJ's extensive quarterly Tankan Business survey is released.
Economic and market news
What happened overnight
In China, inflation for November was weaker than expected printing 0.2% y/y (cons: 0.5%), and -0.6% m/m (cons: -0.4%). Lower fresh food prices and continued factory deflation contributed to the weaker inflation.
What happened since Friday
In the US, the job market rebounded on Friday after the impact of hurricanes and strikes. Non-farm payrolls for November came in higher than expected at 227k (cons: 200k). Additionally, September and October numbers were revised up by a total of 56k. The unemployment rate, less affected by one-offs, crept up to 4.2% in November. At the same time, labour force participation edged down to 62.5%, contrasting with the stronger-than-expected job growth. Wage growth was unchanged at 0.4% m/m (cons: 0.3% m/m). The uptick in the unemployment rate supports our call for a 25bp cut at next week's meeting.
After the release, various Fed policymakers shared their views. The SF Fed President Daly (a hawk and a voting member) said the labour market is strong and indicated no objection to a December rate cut. However, she called for a more cautious approach as the policy rate near its settling point. The Fed Governor Bowman (a hawk and a voting member) and the Cleveland Fed President Hammack (a voting member) echoed a gradual, cautious stance amid the still-elevated inflation and sound labour market. Lastly, the Chicago President Goolsbee (a dove and a non-voting member) mentioned that he expects rates to come lower over the next year and noted that an unexpected jump in inflation or a surprise tightening of the job market could alter the Fed's course.
The University of Michigan's consumer sentiment survey showed that the consumer sentiment rose for the fifth straight month in December, climbing to 74. Consumers' inflation expectations were more mixed, as 1-year expectations increased to 2.9% (prior: 2.6%), whereas 5-year expectations declined slightly to 3.1% (prior: 3.2%).
In the euro area, compensation per employee, the ECB's preferred wage growth measure, declined to 4.4% y/y in Q3 - much in line with their September staff projection estimate of 4.5%. With quarterly growth at 0.9% q/q SA, momentum is also easing, supporting the view of underlying inflation converging towards the 2% target.
The labour market remained resilient in Q3 with employment up 0.2% q/q. However, hours worked were unchanged at 0.0% q/q indicating that more people are working on short-term schemes, and the overall labour market is stagnant. That said, there were marked differences across countries, with employment rising in Spain, but declining in Germany. While we expect the labour market to cool further in the year ahead, the overall labour market should remain strong in a historical context, which will support private consumption.
Lastly, GDP data revealed surprisingly strong domestic demand with investments rising 2.0% q/q (cons: -0.5%) and household consumption up 0.7% q/q (cons: 0.6%). While these dynamics bode well for growth, as domestic demand is projected to be the main growth driver next year, we remain cautious since data is volatile on a quarterly basis. In fact, we have revised down our forecast for growth in H1 due to continued struggle in the manufacturing sector, cautious consumers and the weak German economy. For more details, please see Research euro area - Still breathing, 5 December.
In Germany, industrial production for October surprised to the downside, printing -1.0% m/m SA (cons: 1.2%), reflecting the struggling German manufacturing sector.
In Norway, manufacturing production came in at -1.6% m/m, taking the 3M/3M to -0.6 %. Hence, it seems like the strong momentum in the manufacturing sector during Q3 is fading, in line with the signals from leading indicators. The slowdown is based on both mainland exports and oil-related industries. For now, the manufacturing sector will add some downside during Q4.
In the Middle East, President Bashar al-Assad's regime collapsed as Syrian rebels seized the capital, Damascus. Assad and his family are reportedly in Moscow, where they have been offered asylum. The ending of the Assad family's iron-fisted rule is yet another loss for the Russia-Iran axis, and a victory for Turkey who has been long supporting Syrian opposition. The new regime may struggle to rebuild the nation's foreign relations. The main armed opposition group - Hayat Tahrir Al-Sham (HTS), originally an offshoot of Al-Qaeda, is designated a terrorist group by both the US and the EU. The Gulf states also oppose HTS. Hence, uncertainty prevails.
In South Korea, President Yoon Suk Yeol survived the impeachment on Saturday, as members of his party, People Power party (PPP), boycotted the vote. PPP has announced that Yoon will be excluded from his duties, also saying that they would find a "more orderly, responsible" way to negotiate Yoon's exit.
Equities: Global equities were higher on Friday, with the MSCI world index ending last week 1.5% higher. Cyclicals outperformed defensives by 1% on Friday and a total of almost 4% last week. This is extraordinary, especially considering that 7 out of 10 sectors were lower last week. Hence, we currently have a very narrowly led market, particularly by the three heavyweight sectors: technology, consumer discretionary, and communications services. The AI, growth, and technology-led rally also resulted in large caps outperforming small caps last week. That said, looking outside the news catching US, we had Stoxx 600 outperforming the S&P500 last week and European markets showing broad-based sector gains. With the NFP data coming in benign on Friday, the VIX took another leg lower, down to 12.6. In the US on Friday: Dow -0.3%, S&P 500 +0.3%, Nasdaq +0.8%, and Russell 2000 +0.5%. Asian markets are mostly lower this morning, led by South Korea, with the government crisis continuing. US and European markets show very little change this morning, and financial markets are barely taking notice of the Syrian news over the weekend.
FI: It has been an eventful week in the financial markets on the back of the political turmoil in France, where the French government bond market has showed strong resilience against the political turmoil and the spread between 10Y OATs relative to Bunds has tightened.
FX: The USD opened steady following the collapse of the Syrian government, entering a week marked by US CPI data and monetary policy decisions from the ECB, SNB, RBA, and BoC. EUR/USD remained largely stable after Friday's consensus-aligned jobs report, trading within the 1.05-1.06 range. USD/JPY eased to around the 150 level, reflecting lower US yields post-NFP. EUR/CHF is trading just below 0.9290, with markets turning attention to Thursday's SNB meeting. Meanwhile, EUR/SEK saw upward momentum on Friday, hovering near 11.55. NOK struggled at the end of last week, with EUR/NOK rising from the low 11.60s to just below 11.80.
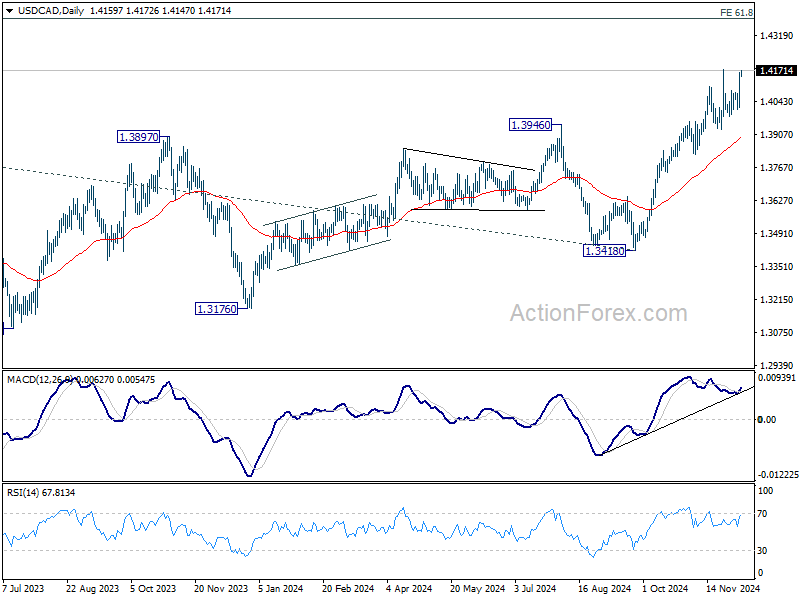
USD/CAD Daily Outlook
Daily Pivots: (S1) 1.4057; (P) 1.4111; (R1) 1.4211; More...
Focus stays on 1.4177 resistance in USD/CAD. Decisive break there will resume larger up trend. Next target is 1.4391 projection level. Rejection by 1.4177 will delay the bullish case and bring more consolidations. But outlook will continue to stay bullish as long as 1.3980 support holds.
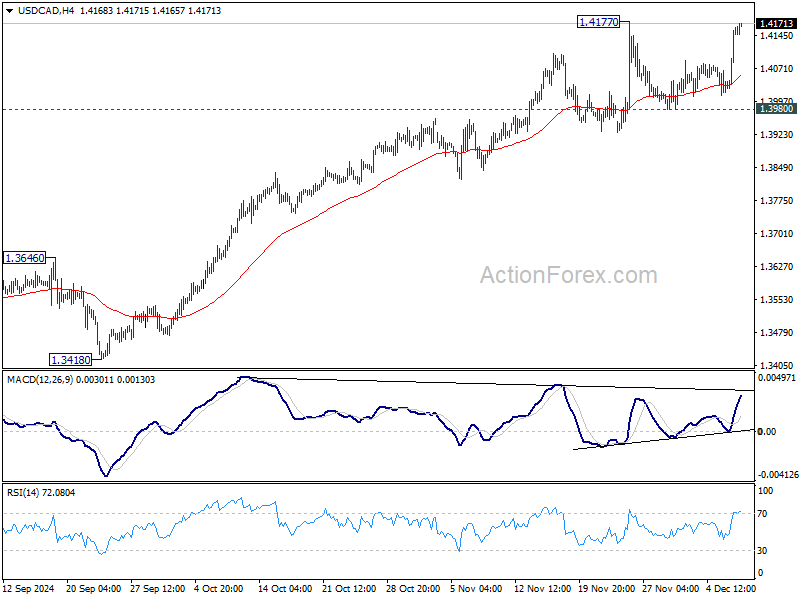
In the bigger picture, up trend from 1.2005 (2021) is in progress. Next target is 61.8% projection of 1.2401 to 1.3976 from 1.3418 at 1.4391. Now, medium term outlook will remain bullish as long as 1.3418 support holds, even in case of deep pullback.
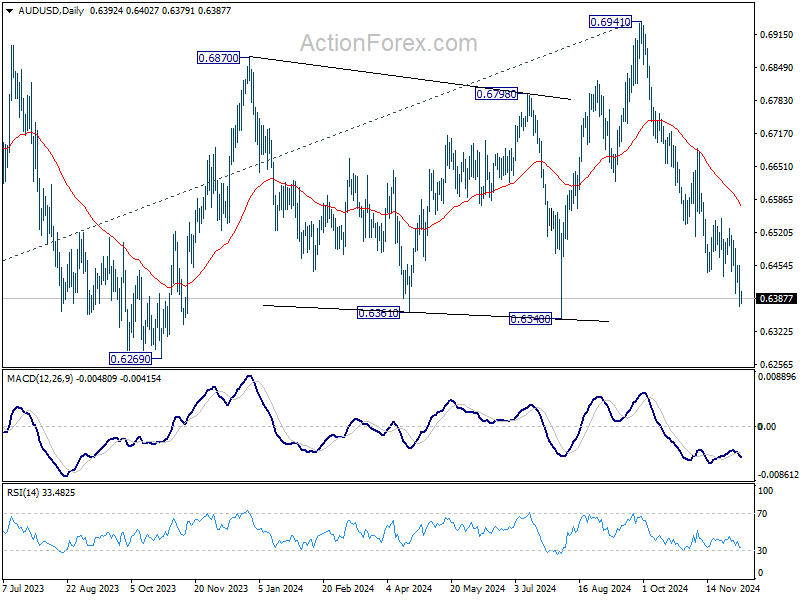
AUD/USD Daily Report
Daily Pivots: (S1) 0.6356; (P) 0.6407; (R1) 0.6441; More...
Intraday bias in AUD/USD stays neutral a this point. Current fall from 0.6941 is in progress for 0.6348 support. Firm break there will target 0.6269 support next. On the upside, above 0.6455 minor resistance will turn intraday bias neutral and bring consolidations first, before staging another fall.
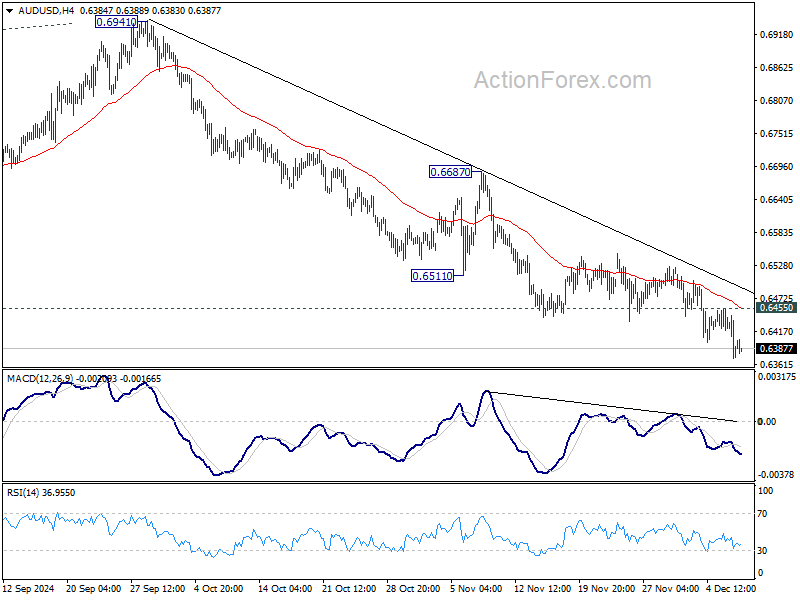
In the bigger picture, price actions from 0.6169 (2022 low) are seen as a medium term consolidation to the down trend from 0.8006. More sideway trading could be seen above 0.6169, but overall outlook will stay bearish as long as 0.6941 resistance holds. Firm break of 0.6169 will resume the down trend to 61.8% projection of 0.8006 to 0.6169 from 0.6941 at 0.5806 next.
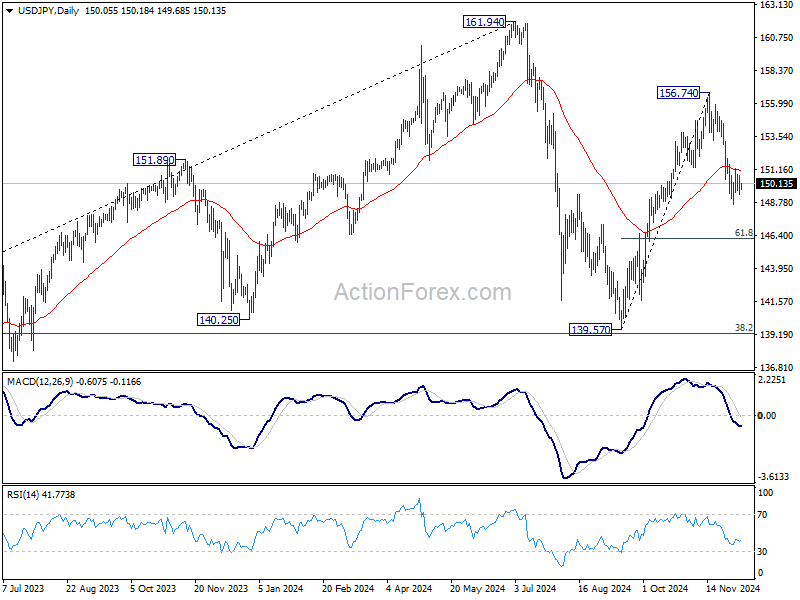
USD/JPY Daily Outlook
Daily Pivots: (S1) 149.33; (P) 150.01; (R1) 150.66; More...
USD/JPY is staying in consolidation from 148.64 and intraday bias stays neutral. Further fall is in favor as long as 151.94 resistance holds. On the downside, below 148.64 will strengthen the case that rise from 139.57 has already completed at 156.754. Deeper fall should then be seen to 61.8% retracement of 139.57 to 156.74 at 146.12 next. Nevertheless, firm break of 151.94 resistance will revive near term bullishness and bring retest of 156.74 high.
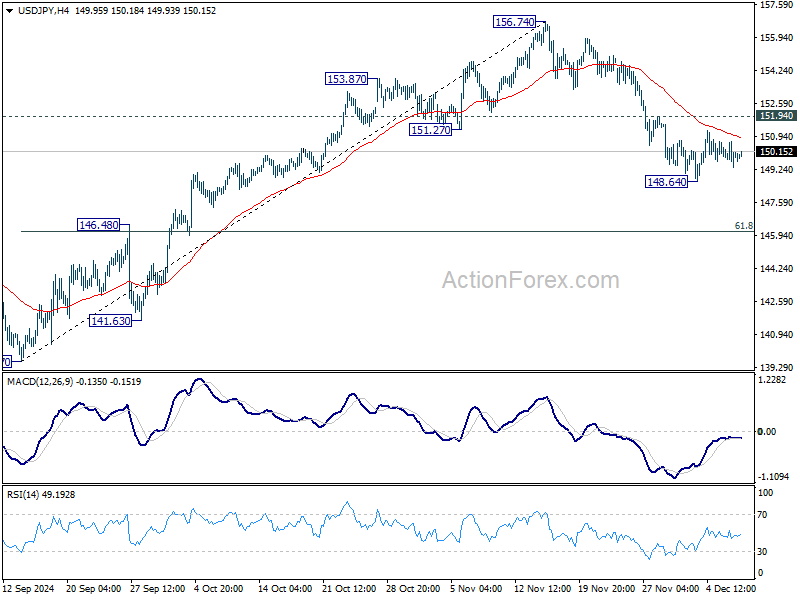
In the bigger picture, price actions from 161.94 are seen as a corrective pattern to rise from 102.58 (2021 low). The range of medium term consolidation should be set between 38.2% retracement of 102.58 to 161.94 at 139.26 and 161.94. Nevertheless, sustained break of 139.26 would open up deeper medium term decline to 61.8% retracement at 125.25.
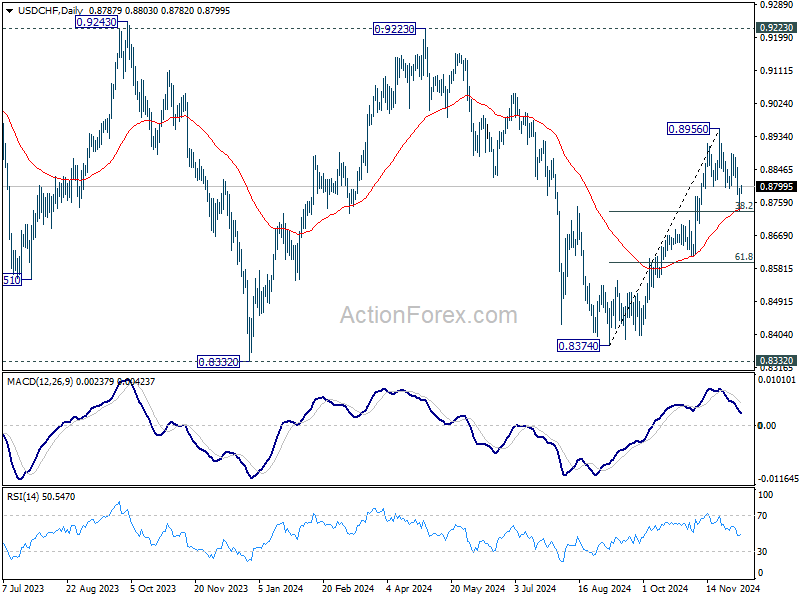
USD/CHF Daily Outlook
Daily Pivots: (S1) 0.8743; (P) 0.8781; (R1) 0.8825; More…
Breach of 0.8796 support turned resistance suggests that USD/CHF's corrective pullback from has completed at after drawing support from 55 D EMA (now at 0.8738). Intraday bias is back on the upside for retesting 0.8956 high. However, considering head and shoulder top pattern, firm break of the EMA will argue that whole rise from 0.8401 might have completed, and bring deeper decline to 61.8% retracement of 0.8401 to 0.8956 at 0.8613 next.
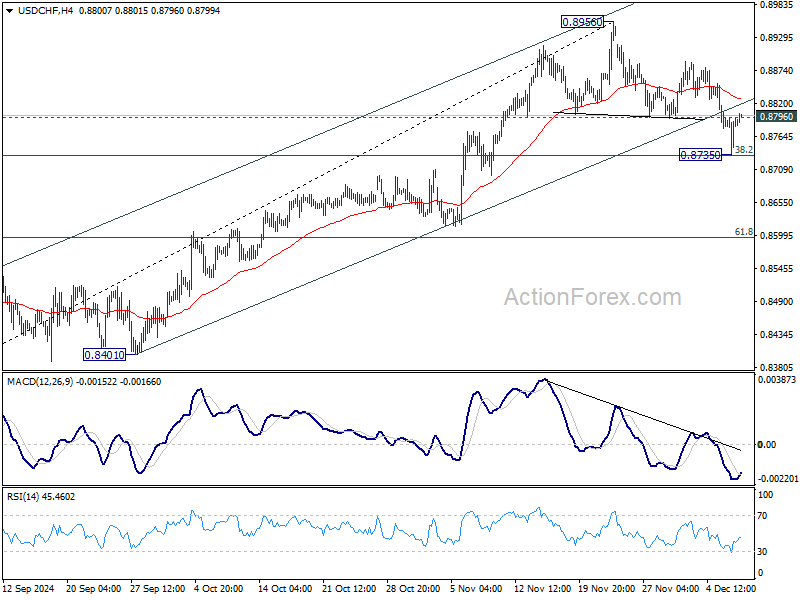
In the bigger picture, price actions from 0.8332 (2023 low) are currently seen as a medium term corrective pattern, with rise from 0.8374 as the third leg. Overall outlook will continue to stay bearish as long as 0.9223 resistance holds. Break of 0.8332 low is in favor at a later stage when the consolidation completes.
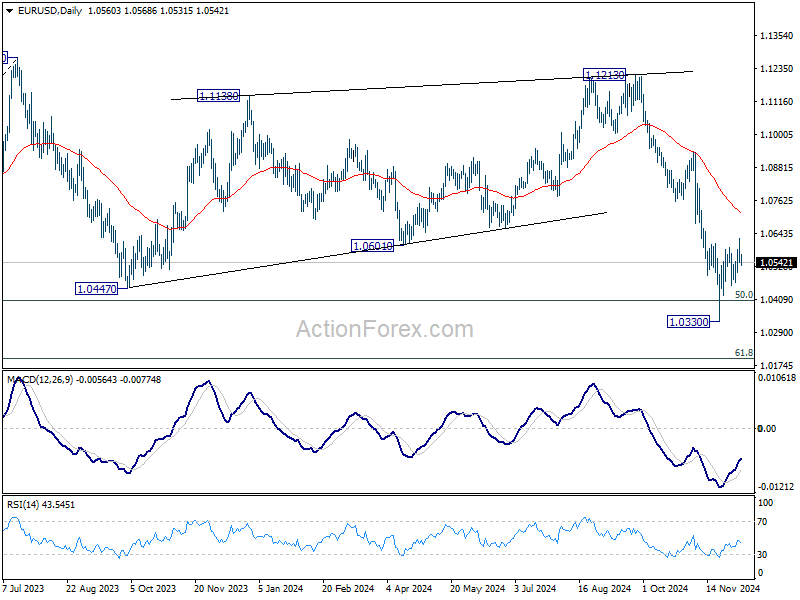
EUR/USD Daily Outlook
Daily Pivots: (S1) 1.0530; (P) 1.0580; (R1) 1.0618; More...
Intraday bias in EUR/USD is turned neutral again with current retreat. Rebound from 1.0330 short term bottom could still extend higher. But outlook will remain bearish as long as 55 D EMA (now at 1.0717) holds. On the downside, break of 1.0471 minor support will turn bias to the downside for retesting 1.0330 low. Firm break of 1.0330 will resumed the decline from 1.1213, and sustained trading below 1.0404 key fibonacci level will carry larger bearish implication.
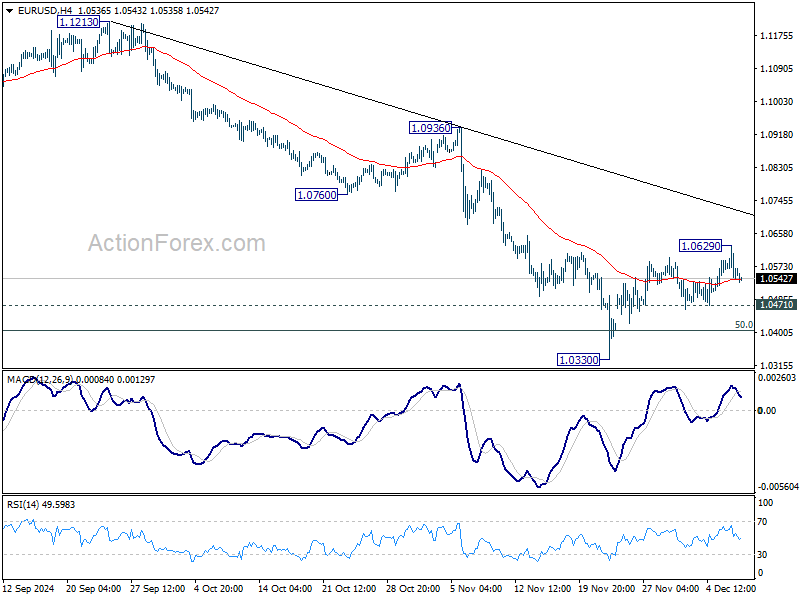
In the bigger picture, focus stays on 50% retracement of 0.9534 (2022 low) to 1.1274 at 1.0404. Strong rebound from this level will keep price actions from 1.1273 (2023 high) as a medium term consolidation pattern only. However, sustained break of 1.0404 will raise the chance that whole up trend from 0.9534 has reversed. That would pave the way to 61.8% retracement at 1.0199 first. Firm break there will target 0.9534 low again.
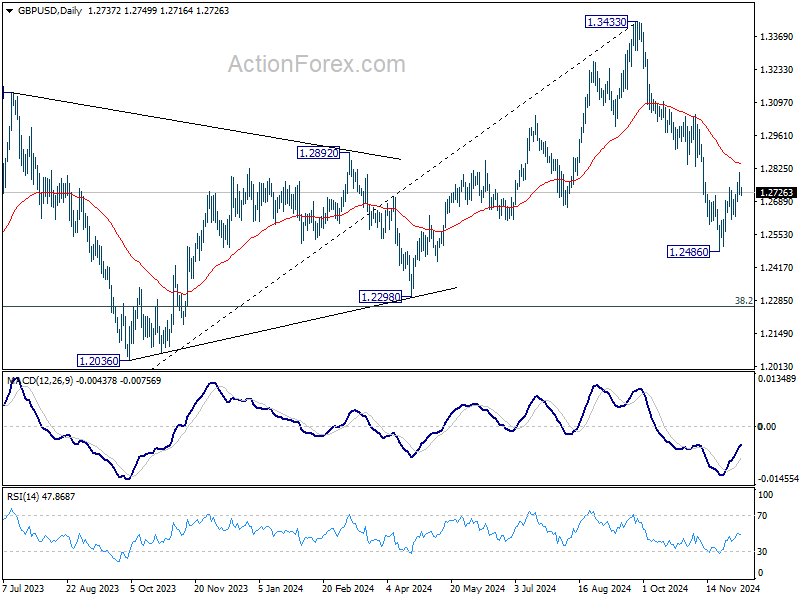
GBP/USD Daily Outlook
Daily Pivots: (S1) 1.2704; (P) 1.2758; (R1) 1.2793; More...
Intraday bias in GBP/USD is turned neutral again with current retreat. Rebound from 1.2486 short term bottom could still extend higher. But outlook will stay bearish as long as 55 D EMA (now at 1.2846) holds. On the downside, below 1.2615 minor support will bring retest of 1.2486 first. Firm break there will target 1.2298 cluster support zone. However, sustained break of 55 D EMA will argue that the near term trend has reversed, and targets 1.3047 resistance for confirmation.
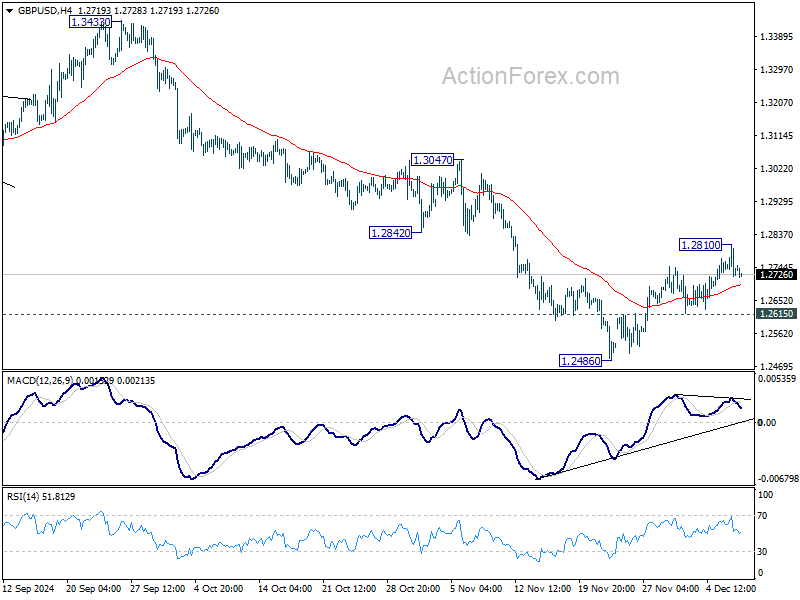
In the bigger picture, price actions from 1.3433 medium term are seen as correcting whole up trend from 1.0351 (2022 low). Deeper decline could be seen to 38.2% retracement of 1.0351 to 1.3433 at 1.2256, which is close to 1.2298 structural support. But strong support is expected there to bring rebound to extend the corrective pattern.