Sample Category Title
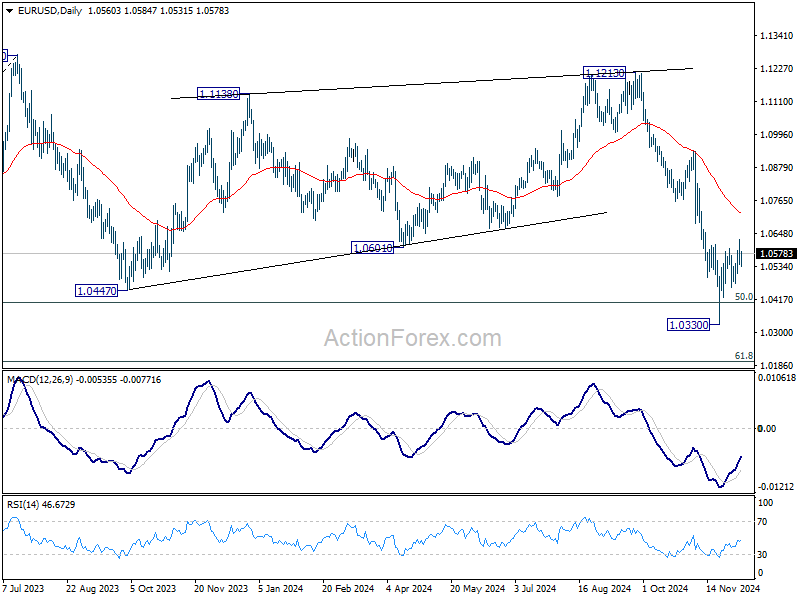
EUR/USD Mid-Day Outlook
Daily Pivots: (S1) 1.0530; (P) 1.0580; (R1) 1.0618; More...
Intraday bias in EUR/USD remains neutral first. Rebound from 1.0330 short term bottom could still extend higher. But outlook will remain bearish as long as 55 D EMA (now at 1.0717) holds. On the downside, break of 1.0471 minor support will turn bias to the downside for retesting 1.0330 low. Firm break of 1.0330 will resumed the decline from 1.1213, and sustained trading below 1.0404 key fibonacci level will carry larger bearish implication.
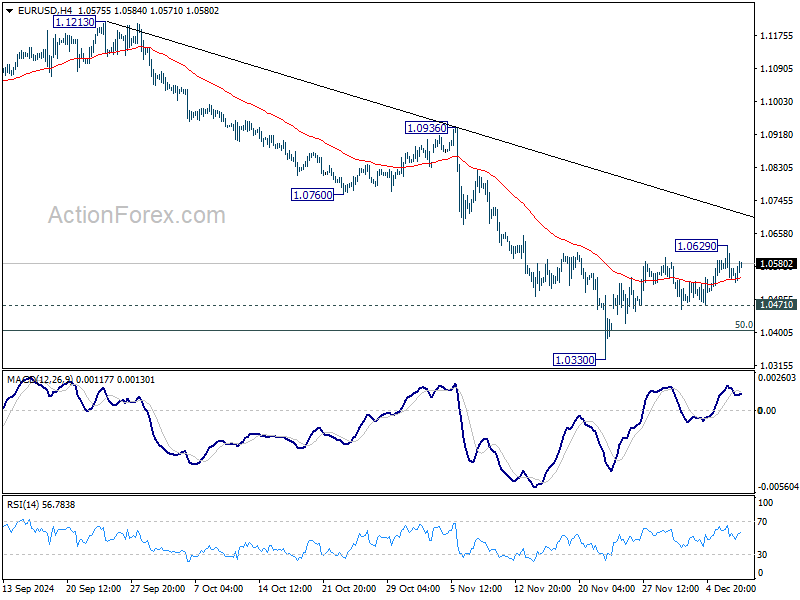
In the bigger picture, focus stays on 50% retracement of 0.9534 (2022 low) to 1.1274 at 1.0404. Strong rebound from this level will keep price actions from 1.1273 (2023 high) as a medium term consolidation pattern only. However, sustained break of 1.0404 will raise the chance that whole up trend from 0.9534 has reversed. That would pave the way to 61.8% retracement at 1.0199 first. Firm break there will target 0.9534 low again.
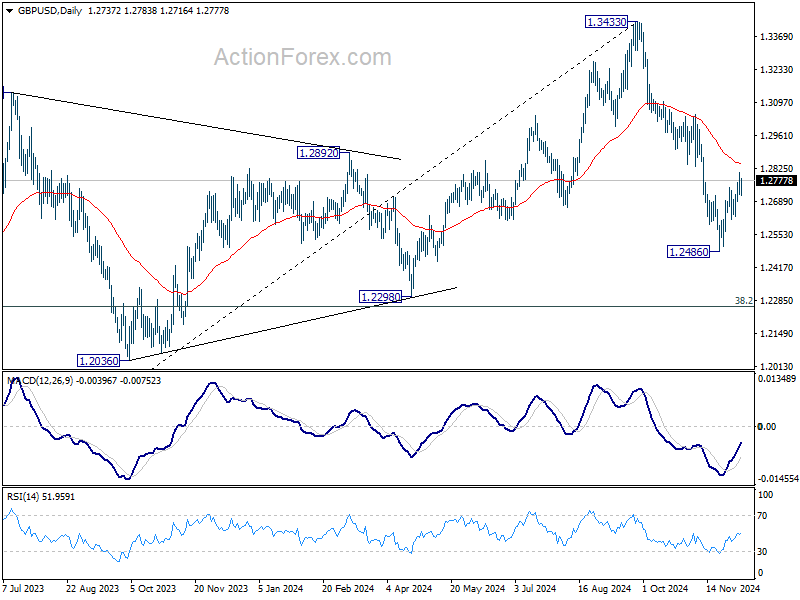
GBP/USD Mid-Day Outlook
Daily Pivots: (S1) 1.2704; (P) 1.2758; (R1) 1.2793; More...
Intraday bias in GBP/USD remains neutral for the moment. Rebound from 1.2486 short term bottom could still extend higher. But outlook will stay bearish as long as 55 D EMA (now at 1.2846) holds. On the downside, below 1.2615 minor support will bring retest of 1.2486 first. Firm break there will target 1.2298 cluster support zone. However, sustained break of 55 D EMA will argue that the near term trend has reversed, and targets 1.3047 resistance for confirmation.
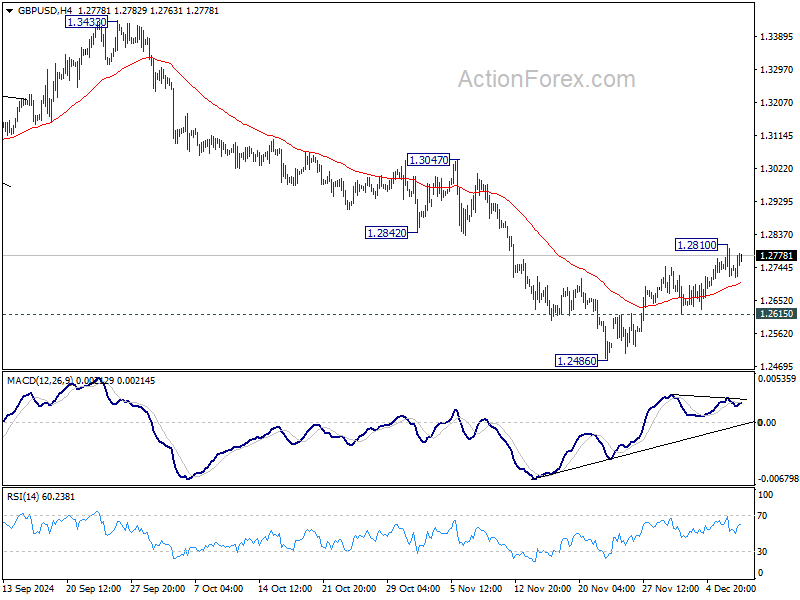
In the bigger picture, price actions from 1.3433 medium term are seen as correcting whole up trend from 1.0351 (2022 low). Deeper decline could be seen to 38.2% retracement of 1.0351 to 1.3433 at 1.2256, which is close to 1.2298 structural support. But strong support is expected there to bring rebound to extend the corrective pattern.
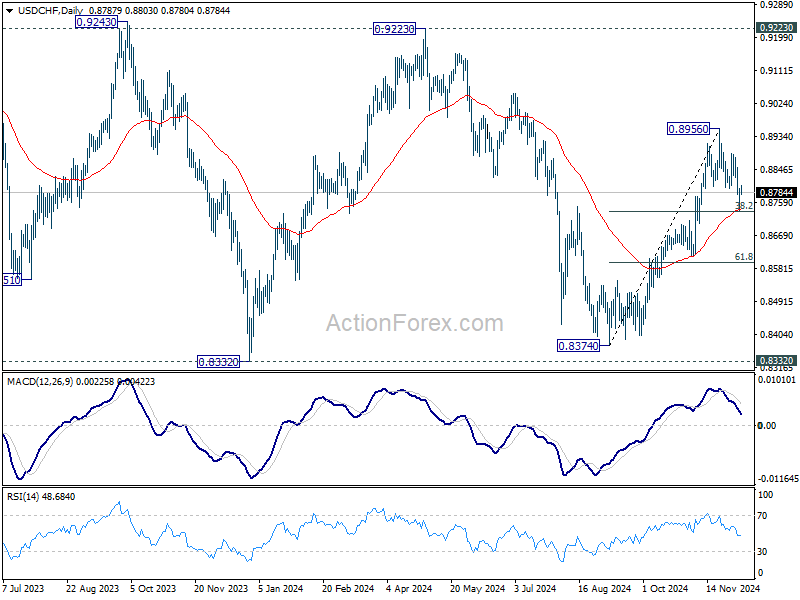
USD/CHF Mid-Day Outlook
Daily Pivots: (S1) 0.8743; (P) 0.8781; (R1) 0.8825; More…
Intraday bias in USD/CHF stays mildly on the upside at this point. Corrective pullback from 0.8956 could have completed at 0.8735, after drawing support from 55 D EMA (now at 0.8738). Further rise would be seen for retesting 0.8956 high. However, considering head and shoulder top pattern, firm break of the EMA will argue that whole rise from 0.8401 might have completed, and bring deeper decline to 61.8% retracement of 0.8401 to 0.8956 at 0.8613 next.
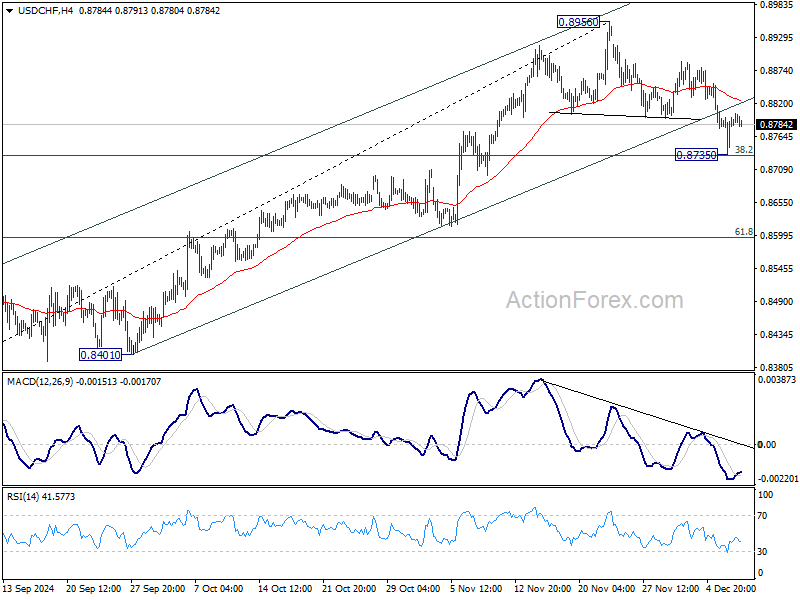
In the bigger picture, price actions from 0.8332 (2023 low) are currently seen as a medium term corrective pattern, with rise from 0.8374 as the third leg. Overall outlook will continue to stay bearish as long as 0.9223 resistance holds. Break of 0.8332 low is in favor at a later stage when the consolidation completes.
USD/JPY Mid-Day Outlook
Daily Pivots: (S1) 149.33; (P) 150.01; (R1) 150.66; More...
No change in USD/JPY's outlook as consolidation continues above 148.64. Intraday bias stays neutral and further decline is in favor as long as 151.94 resistance holds. On the downside, below 148.64 will strengthen the case that rise from 139.57 has already completed at 156.754. Deeper fall should then be seen to 61.8% retracement of 139.57 to 156.74 at 146.12 next. Nevertheless, firm break of 151.94 resistance will revive near term bullishness and bring retest of 156.74 high.
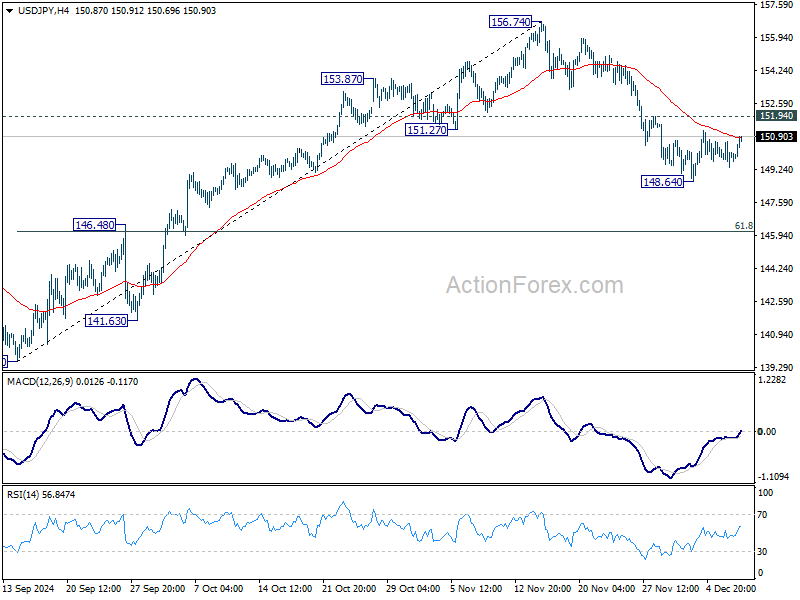
In the bigger picture, price actions from 161.94 are seen as a corrective pattern to rise from 102.58 (2021 low). The range of medium term consolidation should be set between 38.2% retracement of 102.58 to 161.94 at 139.26 and 161.94. Nevertheless, sustained break of 139.26 would open up deeper medium term decline to 61.8% retracement at 125.25.

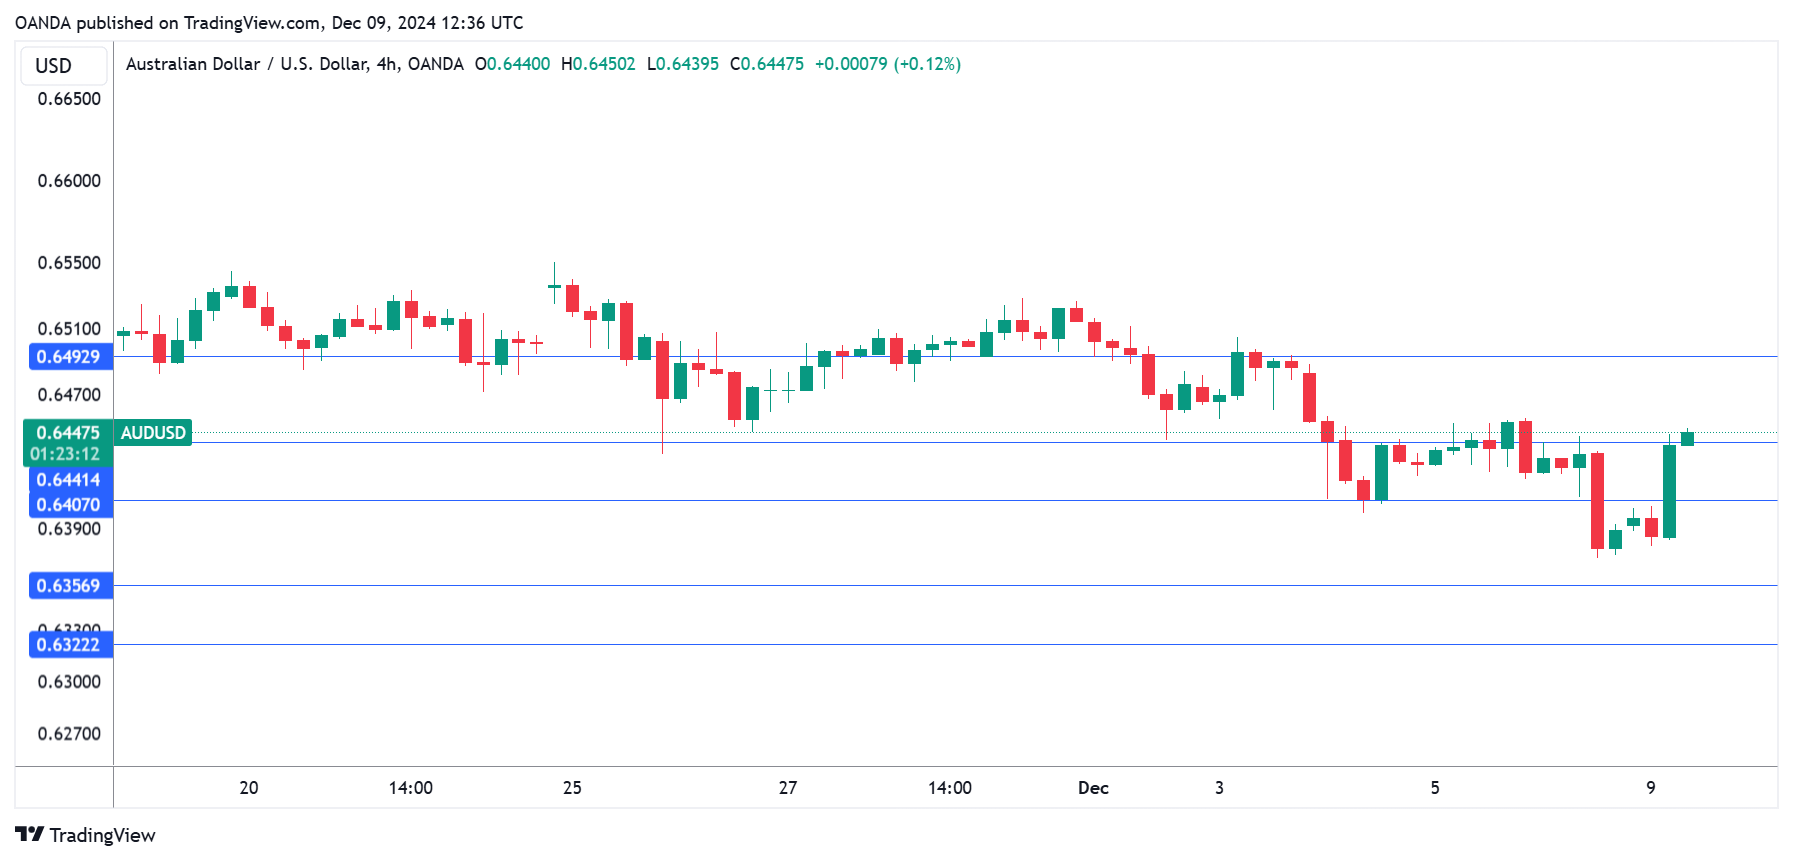
AUD/USD Mid-Day Report
Daily Pivots: (S1) 0.6356; (P) 0.6407; (R1) 0.6441; More...
A temporary low should be in place at 0.6371 with today's rebound and intraday bias is turned neutral first. Some consolidations would be seen but further decline is expected as long as 0.6511 support turned resistance holds. On the downside, below 0.6371 will resume the fall from 0.6941 to 0.6348 support, and then 0.6269. Nevertheless, considering bullish convergence condition in 4H MACD, firm break of 0.6511 will confirm short term bottoming, and turn bias back to the upside for 55 D EMA (now at 0.6575) next.
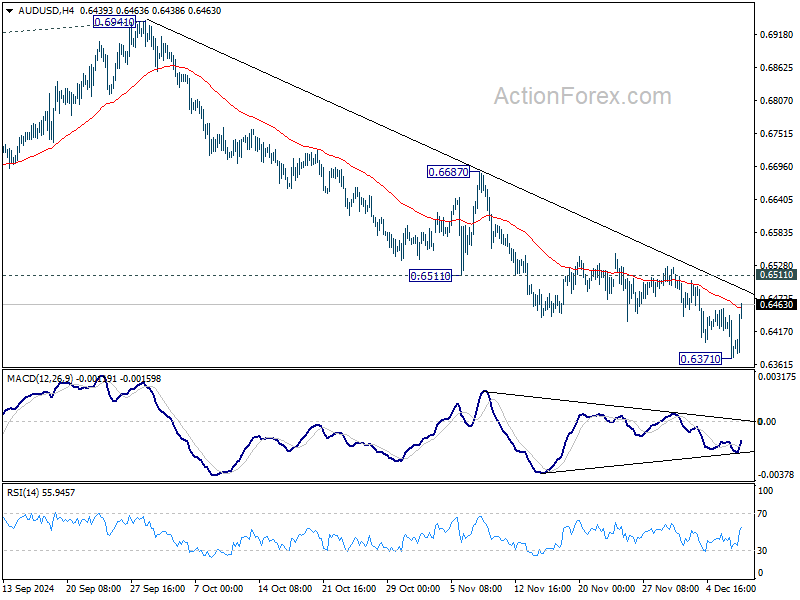
In the bigger picture, price actions from 0.6169 (2022 low) are seen as a medium term consolidation to the down trend from 0.8006. More sideway trading could be seen above 0.6169, but overall outlook will stay bearish as long as 0.6941 resistance holds. Firm break of 0.6169 will resume the down trend to 61.8% projection of 0.8006 to 0.6169 from 0.6941 at 0.5806 next.
Aussie and HSI Gains Ignited by China’s Policy Pledges Again
Commodity currencies found significant support today after China pledged to intensify its economic stimulus efforts, aiming to secure next year’s growth targets. Australian Dollar led the charge, followed by New Zealand Dollar and Canadian Dollar, as risk-sensitive assets reacted positively to the news. Meanwhile, Hong Kong’s HSI surged, reflecting optimism in the region, though gains were just modest in Chinese Yuan.
China’s announcement comes just ahead of the Central Economic Work Conference, an annual meeting that sets the nation’s key policy priorities for the year ahead. State media highlighted President Xi Jinping’s directive for “full preparation” to meet economic targets for 2025, emphasizing the need to tackle “uncertainties and challenges.” Xi also promised “proactive” fiscal measures and “moderately loose” monetary policy, complemented by enhanced counter-cyclical adjustments. However, markets were left waiting for concrete details, which are unlikely to surface before the parliamentary session in March.
The market reaction was pronounced, with risk-sensitive currencies outperforming while traditional safe havens like the Japanese Yen, Swiss Franc, and Euro lagged. Yen, in particular, is the day’s weakest performer so far, reflecting a shift away from defensive positioning. Dollar and British Pound are mixed in the middle.
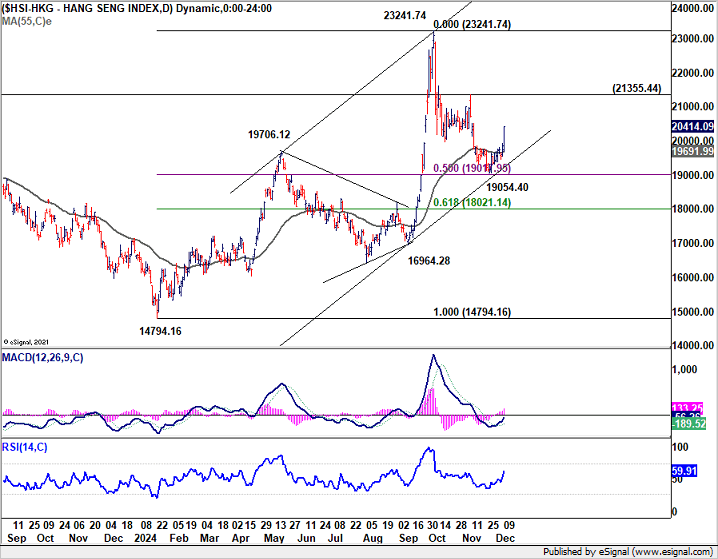
On the technical front, Hong Kong HSI's strong rebound today now supports that case that corrective fall from 23241.74 has completed with three waves down to 19054.40. That came after drawing support form 50% retracement of 14794.16 to 23241.74 at 19054.40, as well as medium term rising channel. Next target is 21355.44 resistance. Firm break there will argue that the up trend form 14794.16 is ready to resume. If realized, the bullish development in HSI could help floor AUD/USD's decline above 0.6169 key support (2022 low).
In Europe at the time of writing, FTSE is up 0.56%. DAX is down -0.08%. CAC is up 0.52%. UK 10-year yield is down -0.021 at 4.259. Germany 10-year yield is down -0.015 at 2.099. Earlier in Asia, Nikkei rose 0.18%. Hong Kong HSI rose 2.76%. China Shanghai SSE fell -0.05%. Singapore Strait Times fell -0.03%. Japan 10-year JGB yield fell -0.0111 to 1.042.
Eurozone Sentix plunges to -17.5 amid economic and political turmoil
Investor sentiment in the Eurozone deteriorated sharply in December, with the Sentix Investor Confidence Index dropping to -17.5 from -12.8, significantly below expectations of -13.1. This marks the weakest reading since November 2023. Current Situation Index fell to -28.5, the lowest since November 2022, while Expectations Index slipped to -5.8 from -3.8. .
Germany remains a key drag, with its Current Situation Index sinking to -50.8, the lowest since June 2020, reflecting the persistence of recessionary pressures. The announcement of new Bundestag elections failed to inspire optimism, while France's ongoing government crisis has added another layer of economic uncertainty. Sentix highlighted that “the two largest countries in the Eurozone are dragging down the EU economy.”
ECB faces increasing pressure as investors expect stronger monetary support for the faltering economy. However, inflation concerns persist, with Sentix's inflation barometer holding at -12 points, signaling continued unease. This dual challenge highlights a conflict for ECB as it balances the need for economic stimulus with inflationary risks.
China's CPI falls to 0.2% yoy in Nov, PPI down -2.5% yoy, deflation pressures persist
China's CPI decelerated from 0.3% yoy to 0.2% yoy in November, below market expectations of 0.5% yoy, and marking its lowest level in five months. Persistent deflationary pressures highlight the urgency for stronger fiscal measures to reinvigorate the economy.
Food prices was the primary driver of inflation, surging by 1% yoy, with notable increases in vegetable and pork prices at 10% yoy and 13.7% yoy, respectively. However, core inflation, which excludes volatile food and energy prices, edged up only marginally to 0.3% yoy from 0.2% yoy.
Meanwhile, PPI improved, registering a -2.5% yoy decline in November compared to -2.9% in October, beating expectations of -2.9% yoy. While this marked the 26th consecutive month of negative readings, the moderation was attributed to a combination of existing and incremental policy measures alongside a recovery in domestic demand for industrial goods.
AUD/USD Mid-Day Report
Daily Pivots: (S1) 0.6356; (P) 0.6407; (R1) 0.6441; More...
A temporary low should be in place at 0.6371 with today's rebound and intraday bias is turned neutral first. Some consolidations would be seen but further decline is expected as long as 0.6511 support turned resistance holds. On the downside, below 0.6371 will resume the fall from 0.6941 to 0.6348 support, and then 0.6269. Nevertheless, considering bullish convergence condition in 4H MACD, firm break of 0.6511 will confirm short term bottoming, and turn bias back to the upside for 55 D EMA (now at 0.6575) next.
In the bigger picture, price actions from 0.6169 (2022 low) are seen as a medium term consolidation to the down trend from 0.8006. More sideway trading could be seen above 0.6169, but overall outlook will stay bearish as long as 0.6941 resistance holds. Firm break of 0.6169 will resume the down trend to 61.8% projection of 0.8006 to 0.6169 from 0.6941 at 0.5806 next.
Year Ahead – Will Wounded Commodity Currencies Heal in 2025?
- Commodity currencies came under pressure towards the end of 2024
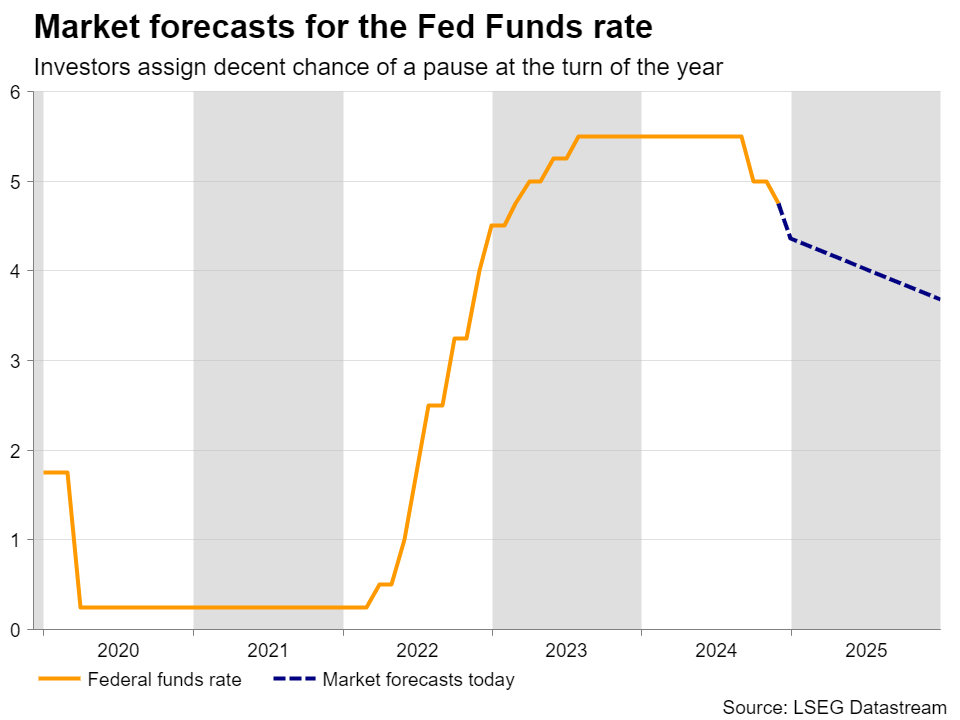
- Bets of a Fed pause at the turn of the year turbo-charge the dollar
- Tariff fears and frustration about China’s policies also main drivers
- Monetary policy could prove decisive in the battle among them
Aussie, kiwi, loonie surrender to stronger US dollar
As 2024 approaches the finish line, the risk-linked currencies – the Australian dollar, the New Zealand dollar, and the Canadian dollar – also known as the commodity currencies, have been seen weakening notably, despite Wall Street conquering fresh record highs.
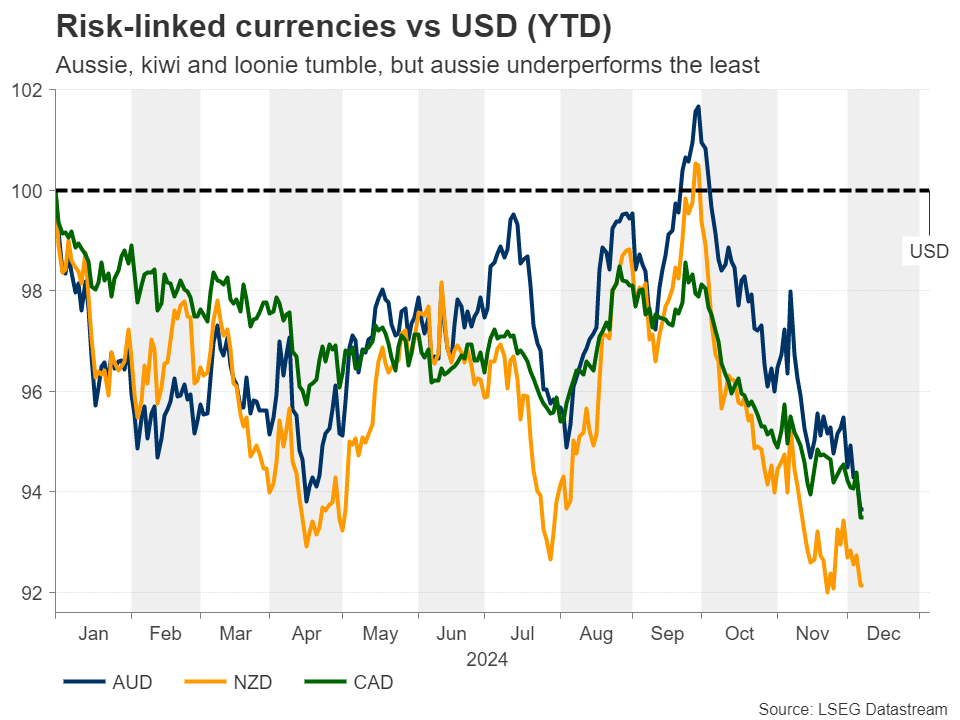
Although the Australian and New Zealand dollars outperformed their US counterpart in terms of year-to-date performance at some point in late September, October proved to be a dark month due to upbeat US data lessening the need for aggressive easing by the Fed, and due to investors remaining unsatisfied by the massive liquidity injections of the People’s Bank of China to shore up economic activity.
Fed and tariffs the biggest drivers
Alongside the already wounded loonie, all three currencies accelerated their slides after Republican candidate Donald Trump won the US election. Trump’s policies are seen as fueling inflation and thereby forcing the Fed to proceed even slower with easing, and even skip some rate cuts at its upcoming meetings. With several Fed officials, including Fed Chair Powell, noting recently that they are in no rush to further lower borrowing costs, investors are now assigning a strong chance for the Committee to take the sidelines as soon as at the first meeting of 2025, in January.
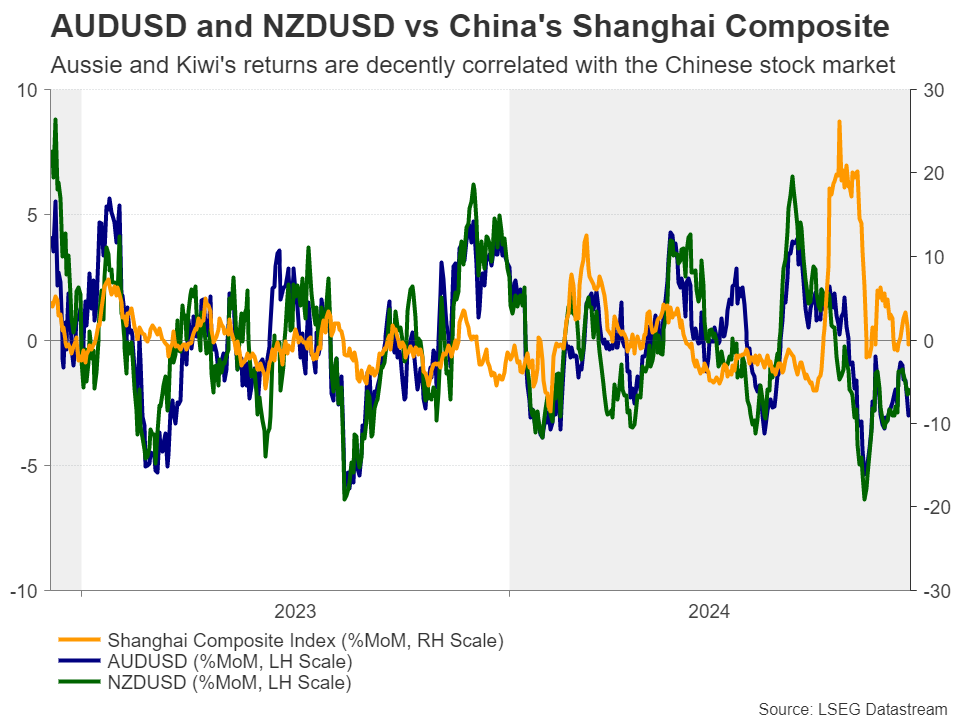
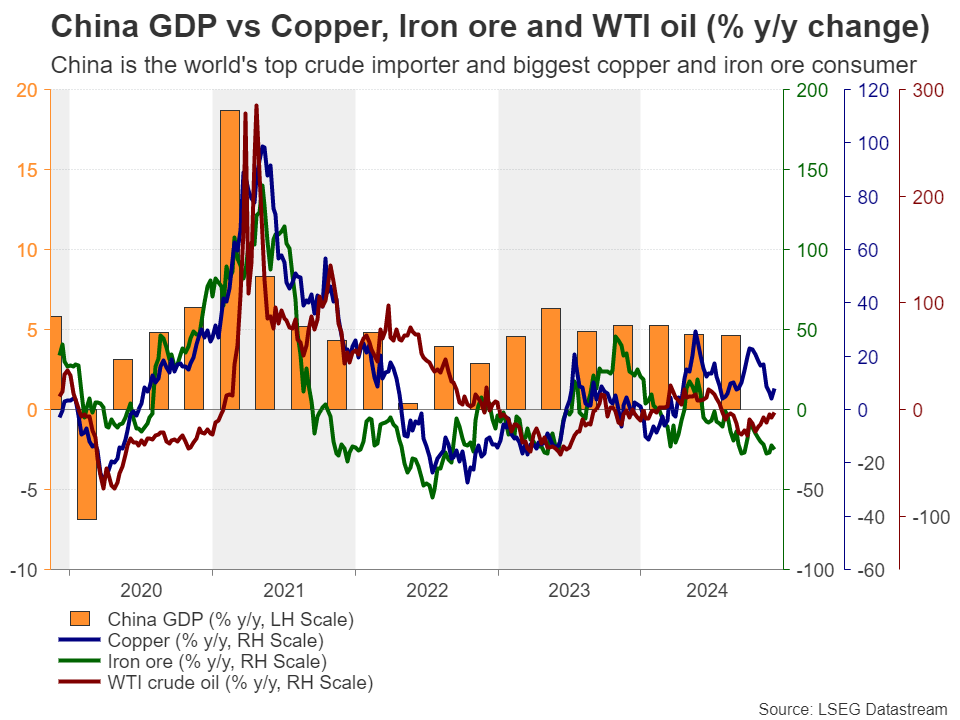
Having said that, Trump’s victory is not hurting the commodity-linked currencies only through the Fed-policy channel. His promises about massive tariffs on Chinese goods are translating into fears about a second trade war and deeper economic wounds for the biggest trading partner of Australia and New Zealand. Those fears could also result in lower commodity prices, as the world’s second largest economy is also the world’s top crude oil importer and the biggest copper and iron ore consumer. Trump has also threatened Canada and Mexico, as well as the BRICS countries, while there is nervousness about how he will proceed with Europe.
Thus, the outlook for the commodity currencies remains blurry, at least for the first half of the year, especially if US data continue to support the idea that the Fed may need to proceed with more rate-cut breaks down the road.
What about monetary policy?
But what happens if we remove the US dollar from the equation? Which of these three risk-linked currencies will perform best and which worst? The answer may lie down to the divergence in monetary policy strategies and expectations of the RBA, the RBNZ and the BoC.
Among the three central banks, the only one that hasn’t hit the rate cut button yet is the RBA, with market participants projecting its first 25bps reduction in April and almost another two by the end of 2025. This is largely due to underlying inflation remaining elevated. The Bank itself has pointed out that as measured by the trimmed mean, core inflation remains some way from the 2.5% midpoint of their inflation target range.
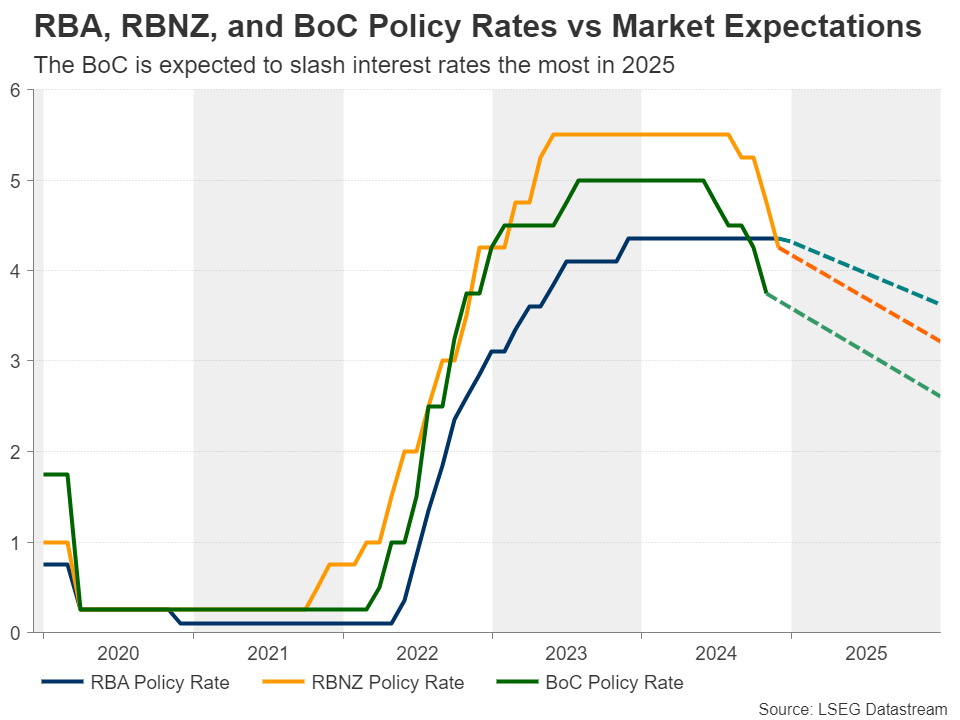
Both the BoC and the RBNZ reduced interest rates by equal amounts until now, but the one expected to continue cutting slightly more aggressively moving forward is the BoC.
The battle between the three
Thus, entering 2025, the aussie may continue to be the best performer among the three, while the loonie could be the laggard. But this could change once the RBA begins its own rate-cut cycle, as very dovish rate paths by the BoC and the RBNZ are already discounted and data coming out of Canada and New Zealand may not be bad enough to warrant so many basis points worth of reductions in 2025. Therefore, the aussie could run out of fuel at some point and take the last place.
As for the best performer during the second half of the year, it may be the Canadian dollar. Yes, the loonie suffered more on Trump’s first remarks about tariffs, but let’s not forget that he has pledged to proceed with a more aggressive policy against China, something that could weigh more on the aussie and kiwi.
AUD/USD Soars as China’s Inflation Dips
The Australian dollar continues to takes traders on a roller-coaster. AUD/USD has surged 0.85% on Monday, recovering most of the 1% decline on Friday. In the European session, the Australian dollar is trading at 0.6443 at the time of writing.
The week ended with a rebound from US nonfarm payrolls. In November, nonfarm payrolls climbed by
227 thousand, above the market estimate of 200 thousand. This followed a very weak October report, which was revised upwards to 36 thousand from 12 thousand. The unemployment rate ticked higher to 4.2% as expected, up from 4.1% in October. The employment data has raised expectations of a quarter-point hike at the Dec. 18 meeting, with the odds currently at 87%, up sharply from 62% a week ago.
The Australian dollar took a tumble after the strong nonfarm payroll numbers, but has quickly recovered after China’s inflation was lower than expected. In November, CPI eased to 0.2% y/y, down from 0.3% in October and short of the market estimate of 0.5%. Monthly, CPI declined by 0.6%, down from -0.3% in October and lower than the market estimate of -0.6%.
The weak Chinese inflation data has raised expectations that China’s central bank will respond by lowering interest rates. That would help boost the economy and increase demand for Australian exports and the Australian dollar has responded with sharp gains today.
The Reserve Bank of Australia meets on Dec. 10 and is widely expected to maintain the cash rate at 4.35%, where it has been for over a year. The markets aren’t expecting a rate cut before May 2025, although a surprise decline in inflation in the coming months could push the central bank to lower rates in Q1 2025.
AUD/USD Technical
- AUD/USD has pushed above resistance at 0.6407 and is testing resistance at 0.6492. Above, there is resistance at 0.6492
- 0.6356 and 0.6322 are the next support lines
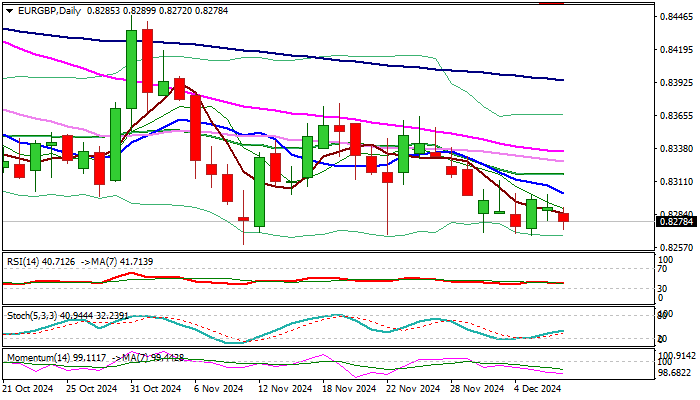
EURGBP – Larger Bears Hold Grip and Eye Key 0.8200 Support Zone
EURGBP stands at the back foot on Monday and retraces more of Thursday’s jump, signaling that near-term correction (off 0.8260 low) might be over.
Larger downtrend remains intact, with firmly bearish daily studies (MA’s in full bearish configuration, 14-d momentum moved into negative territory since late Nov) maintaining downside pressure.
Immediate targets lay at 0.8267/60 (Dec 5 / 2024 low posted on Nov 11 ) guarding more significant supports at 0.8211/02 (50% retracement of larger 0.6924/0.9489 uptrend / March 2022 low), break of which to signal continuation of broader downtrend.
Falling 10DMA (0.8301) which closely tracks the price in past over one week, should cap upticks and keep larger bears intact.
Res: 0.8301; 0.8316; 0.8336; 0.8355
Sup: 0.8267; 0.8260; 0.8211; 0.8202
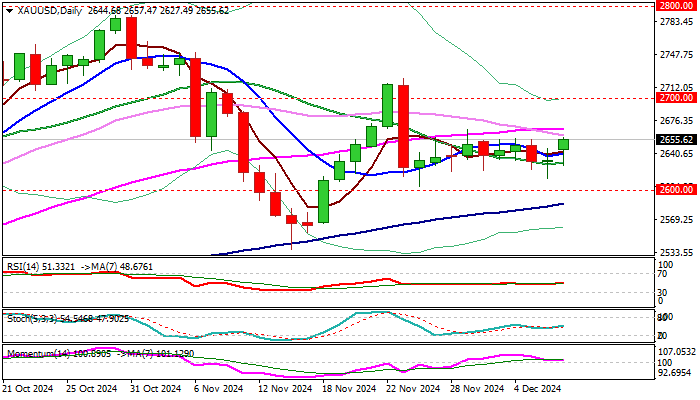
Gold Outlook: Price Rises on Geopolitics/Fresh Purchases from China
Gold price edged higher in early Monday trading following a $10 gap-higher opening, lifted by heated geopolitical situation and fresh demand.
Traders shifted into safer mode after Syrian rebels seized capital Damascus and took control over the country, with growing uncertainty about the near future, supporting gold price.
Another key driver of the yellow metal this morning was fresh demand from China, as PBOC resumed purchasing gold after a pause of six months.
Technical picture on daily chart improved (although still lacking clearer direction signal) as the price rose towards the top of near-term range ($2666, also 50% retracement of $2721/$2605 bear-leg, reinforced by 55DMA).
Persisting bullish momentum and rise above 10/20DMA’s develop initial positive signal, which will look for confirmation on sustained break through range ceiling, to open way for extension towards targets at $2677/93 (Fibo 61.8% & 76.4% respectively) and $2700 (psychological).
Holding and close above broken 10DMA ($2640) to keep fresh near term bulls intact, with larger bullish bias seen above daily cloud base ($2630).
Res: 2666; 2677; 2693; 2700.
Sup: 2640; 2630; 2613; 2605.