Sample Category Title
Crypto Market Spooked by Another Bitcoin Pullback Below 100K
Market Picture
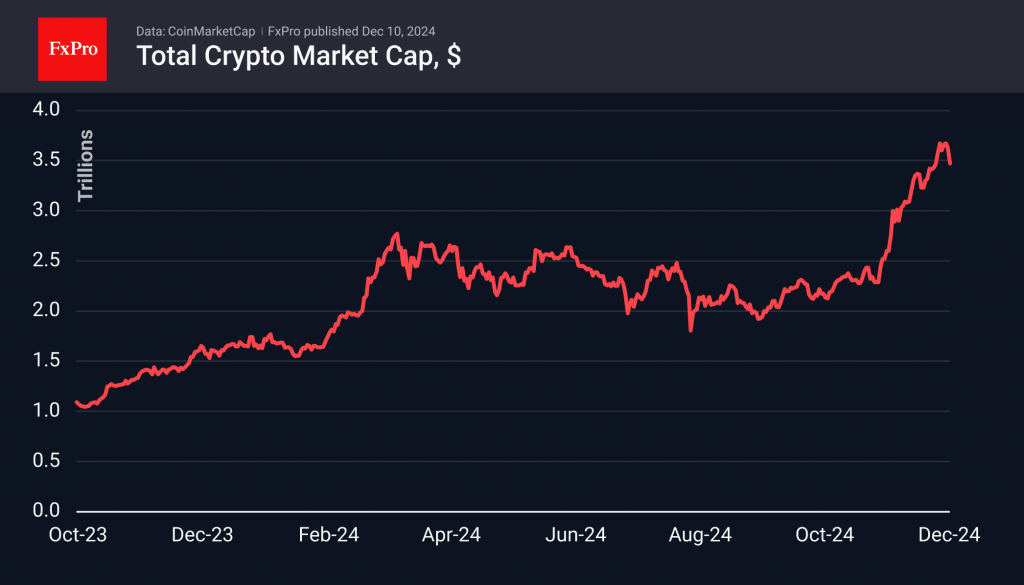
Crypto market capitalisation has fallen 4% in the last 24 hours to 3.4 trillion, taking a hit from another failed attempt by Bitcoin to break above 100k. As one would expect, the failure of the leading coin to grow is sparking hesitation among supporters of smaller and more volatile coins.
The Cryptocurrency Fear and Greed Index is at 78 (extreme greed), as it was the day before, but it now looks like a lagging indicator that doesn’t account for the latest dip.
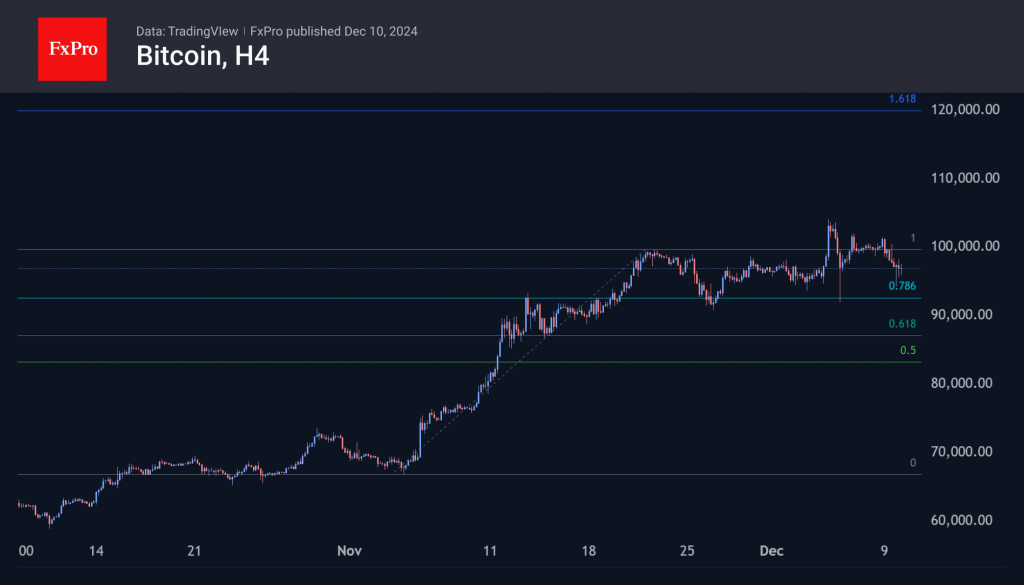
The bulls in Bitcoin once again failed to consolidate above 100K on Monday, which was followed by an impressive sell-off, bringing the price to 94K at the lowest point. There is still a wall of orders clearly visible intraday, keeping the price below 95K for a long time, but the interest in selling above 100K remains unsatisfied until the end.
We still see the potential for the first cryptocurrency to rise into the 120K area once it overcomes resistance at 100k.
News Background
According to CoinShares, global investment in crypto funds rose to an all-time high of $3.851bn last week, renewing the record set two weeks ago. The positive trend continued for the ninth consecutive week. Bitcoin investments rose by $2.546 billion; Ethereum rose to an all-time high of $1.16 billion; XRP rose by a record $134 million; and Solana fell by $14 million.
MicroStrategy bought an additional 21,550 BTC for $2.1 billion at an average price of $98,783, founder Michael Saylor said. MicroStrategy now owns 423,650 BTC, purchased for $25.6 billion at an average price of $60,324 per coin.
Since 8 November, long-term investors have reduced their positions by 827,783 BTC (~$81.2 billion), which was only 30% offset by MicroStrategy and spot ETF purchases. The rest was bought up by short-term holders who are actively leveraged and vulnerable to falling quotes.
BlackRock highlighted Bitcoin’s potential as a new diversification tool alongside gold in its Global Outlook 2025. The limited supply of coins and growing investor demand drive BTC’s potential.
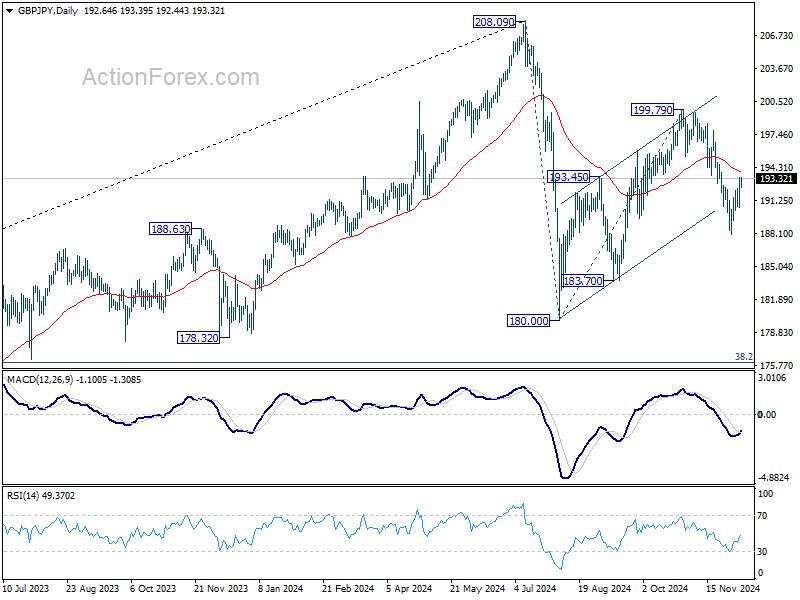
GBP/JPY Daily Outlook
Daily Pivots: (S1) 191.15; (P) 192.28; (R1) 193.96; More...
Intraday bias in GBP/JPY stays neutral for the moment. Recovery from 188.07 might extend higher. But outlook will stay bearish as long as 55 D EMA (now at 193.97) holds. On the downside, below 190.59 minor support will bring retest of 188.07 first. Break there will target 183.70 support next.
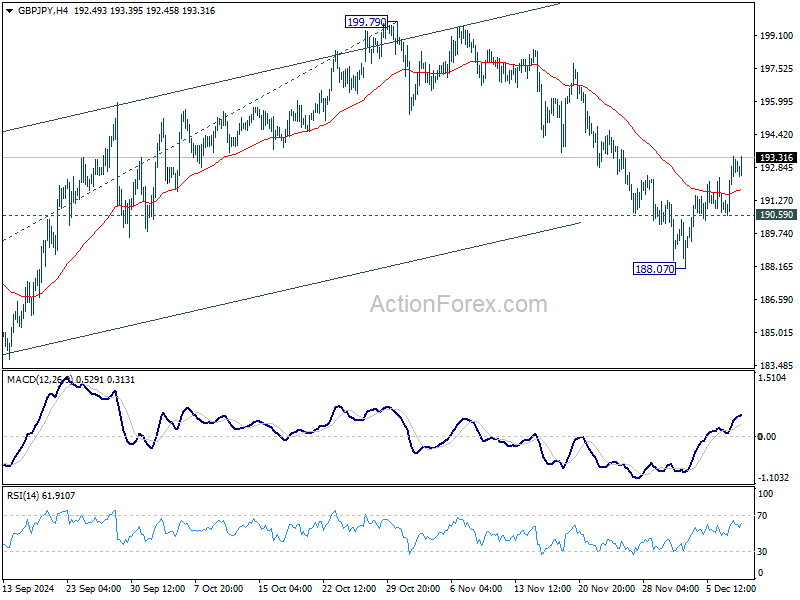
In the bigger picture, price actions from 208.09 are seen as a correction to whole rally from 123.94 (2020 low). The range of consolidation should be set between 38.2% retracement of 123.94 to 208.09 at 175.94 and 208.09. However, decisive break of 175.94 will argue that deeper correction is underway.
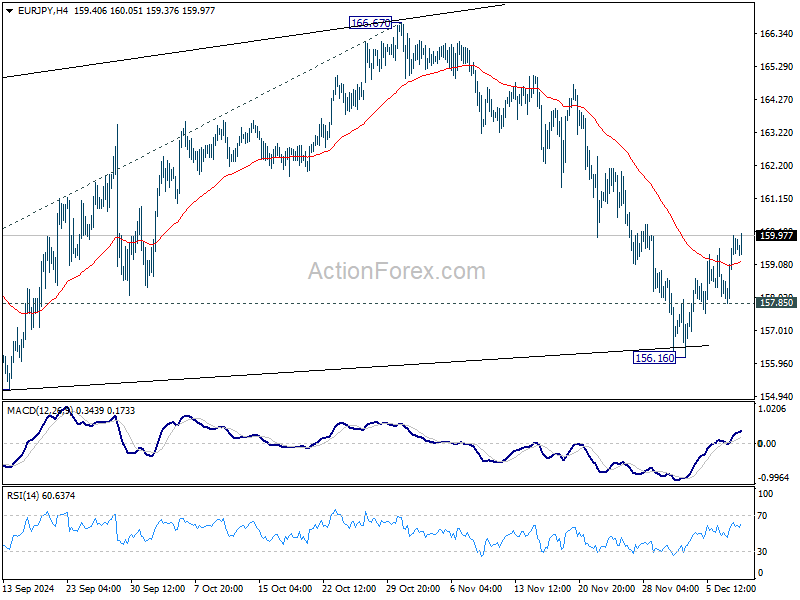
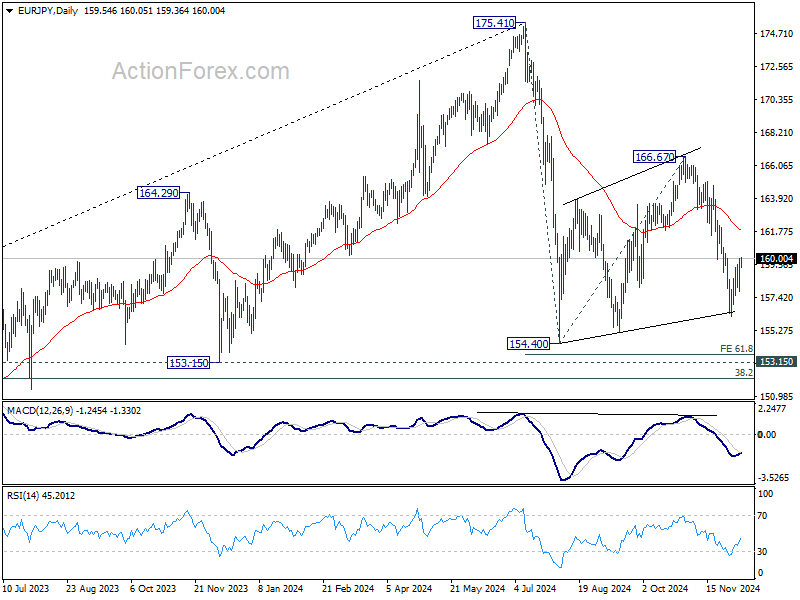
EUR/JPY Daily Outlook
Daily Pivots: (S1) 158.31; (P) 159.16; (R1) 160.44; More...
Intraday bias in EUR/JPY stays neutral at this point. While recovery from 156.16 could extend higher, outlook will stay bearish as long as 55 D EMA (now at 161.83) holds. On the downside, below 157.85 minor support will bring retest of 156.16 first. Break there will target 154.40 low next.
In the bigger picture, price actions from 175.41 are seen as correction to rally from 114.42 (2020 low). The range of consolidation should have been set between 38.2% retracement of 114.42 to 175.41 at 152.11 and 175.41 high. However, decisive break of 152.11 would argue that deeper correction is underway.
EUR/GBP Daily Outlook
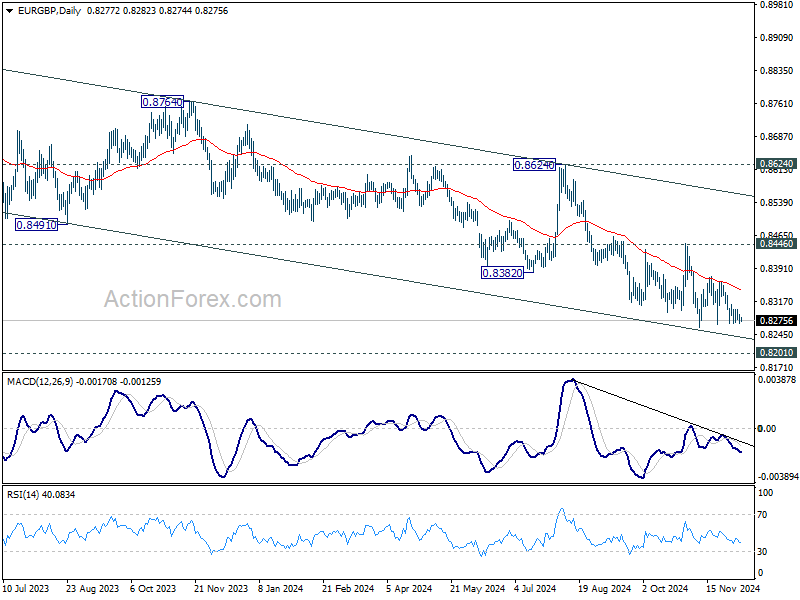
Daily Pivots: (S1) 0.8267; (P) 0.8279; (R1) 0.8290; More...
EUR/GBP is staying in sideway consolidations and intraday bias remains neutral. On the downside, decisive break of 0.8259 will resume larger down trend to 0.8201 key support. On the upside, break of 0.8311 minor resistance will turn bias back to the upside for recovery. But still, outlook will stay bearish as long a 0.8446 resistance holds, and downside breakout is expected at a later stage.
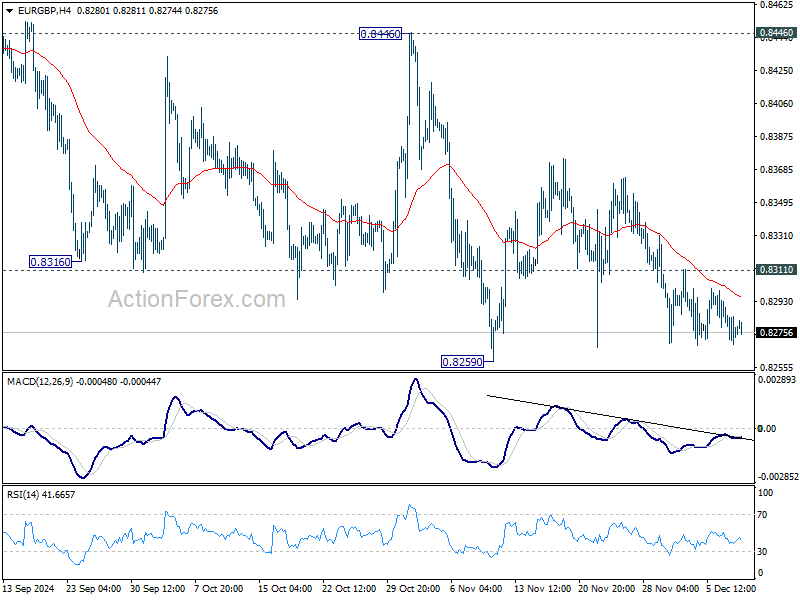
In the bigger picture, down trend from 0.9267 (2022 high) is in progress. Next target is 0.8201 (2022 low), but strong support should be seen there to bring rebound. However, outlook will remain bearish as long as 0.8624 resistance holds even in case of strong rebound. Decisive break of 0.8201 will indicate long term bearish reversal.
EUR/AUD Daily Outlook
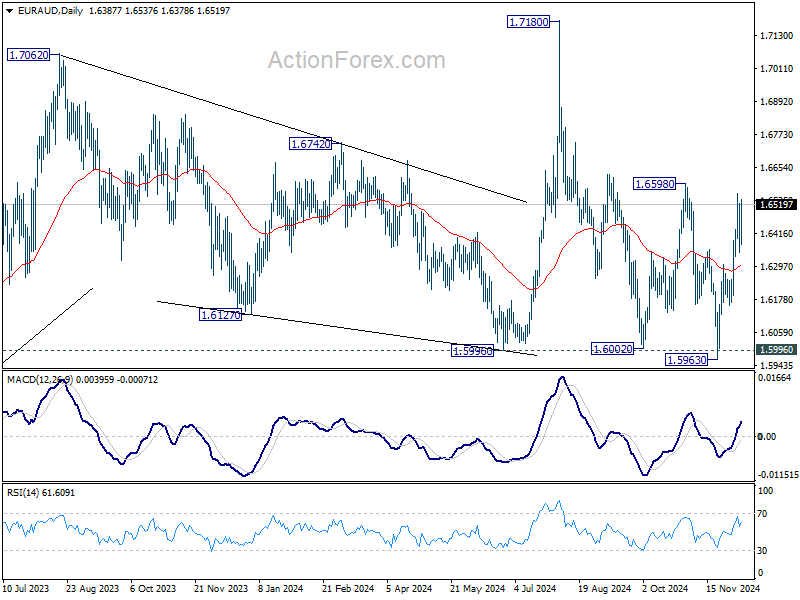
Daily Pivots: (S1) 1.6316; (P) 1.6422; (R1) 1.6492; More...
Intraday bias in EUR/AUD remains neutral first, and further rally is expected as long as 1.6305 resistance turned support holds. Above 1.6559 will resume the rise from 1.5963 to 1.6598 key resistance. Decisive break there will confirm that whole fall from 1.7180 has complete with three waves down to 1.5963, and target a test on 1.7180 next.
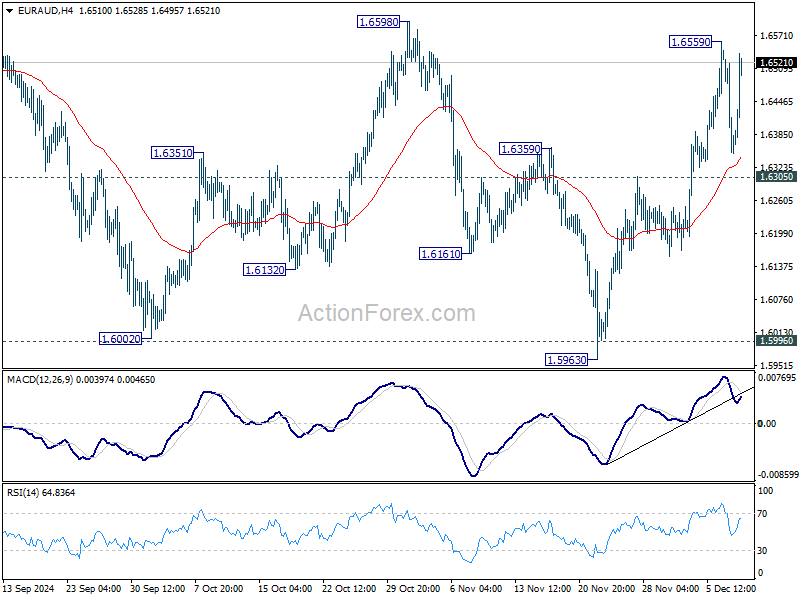
In the bigger picture, EUR/AUD is still holding on to 1.5996 key support despite brief breach. Larger up trend from 1.4281 (2022 low) is still in favor to resume through 1.7180 at a later stage. Nevertheless, sustained break of 1.5995 will indicate that such up trend has completed. Deeper decline would be seen to 61.8% retracement of 1.4281 to 1.7180 at 1.5388, even as a correction.
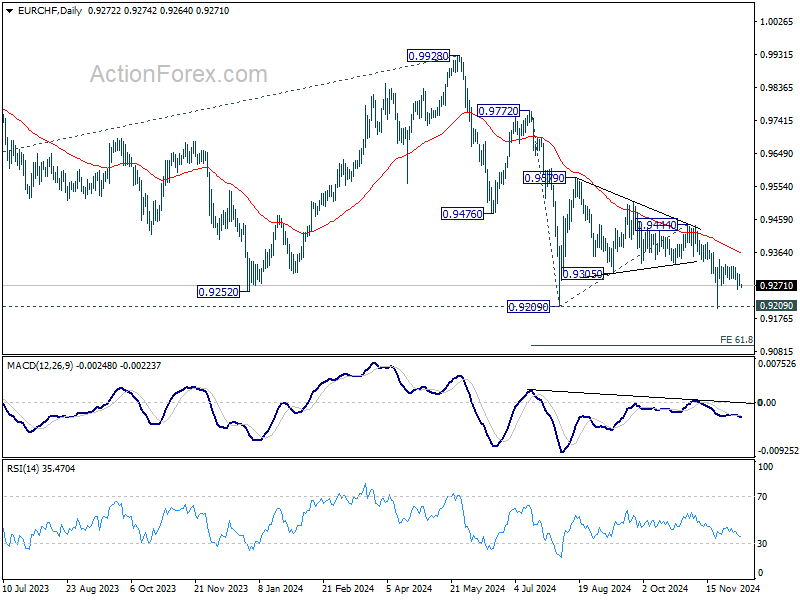
EUR/CHF Daily Outlook
Daily Pivots: (S1) 0.9262; (P) 0.9282; (R1) 0.9296; More....
No change in EUR/CHF's outlook and intraday bias stays mildly on the downside. Recovery from 0.9204 could have completed after repeated rejection by falling 55 4H EMA. Deeper fall would be seen to retest 0.9204 low. Firm break of 0.9204/9 will indicate larger down trend resumption. Nevertheless, break of 0.9321 resistance will turn bias back to the upside to resume the rebound from 0.9204 instead, and that would be an early sign of bullish reversal for the near term.
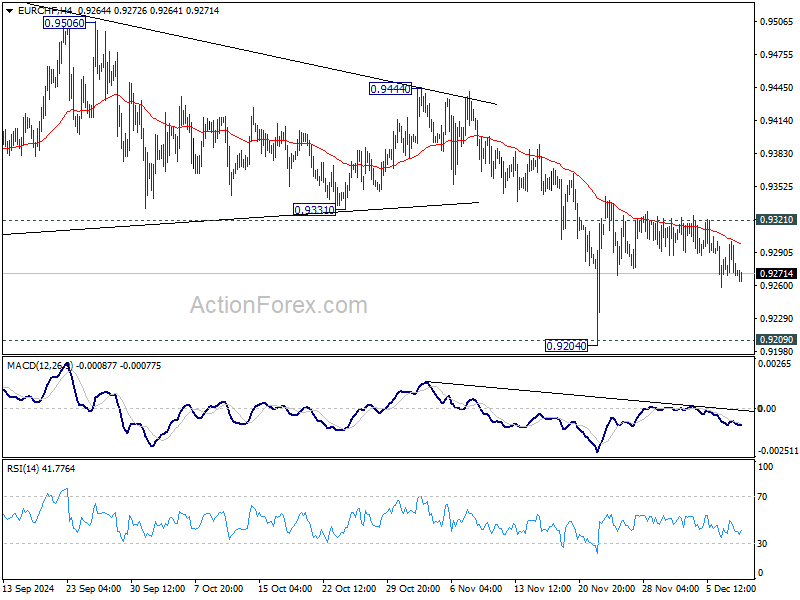
In the bigger picture, outlook will now stay bearish as long as 0.9444 resistance holds. Decisive break of 0.9209 low will resume long term down trend to 61.8% projection of 0.9772 to 0.9209 from 0.9444 at 0.9096 next.
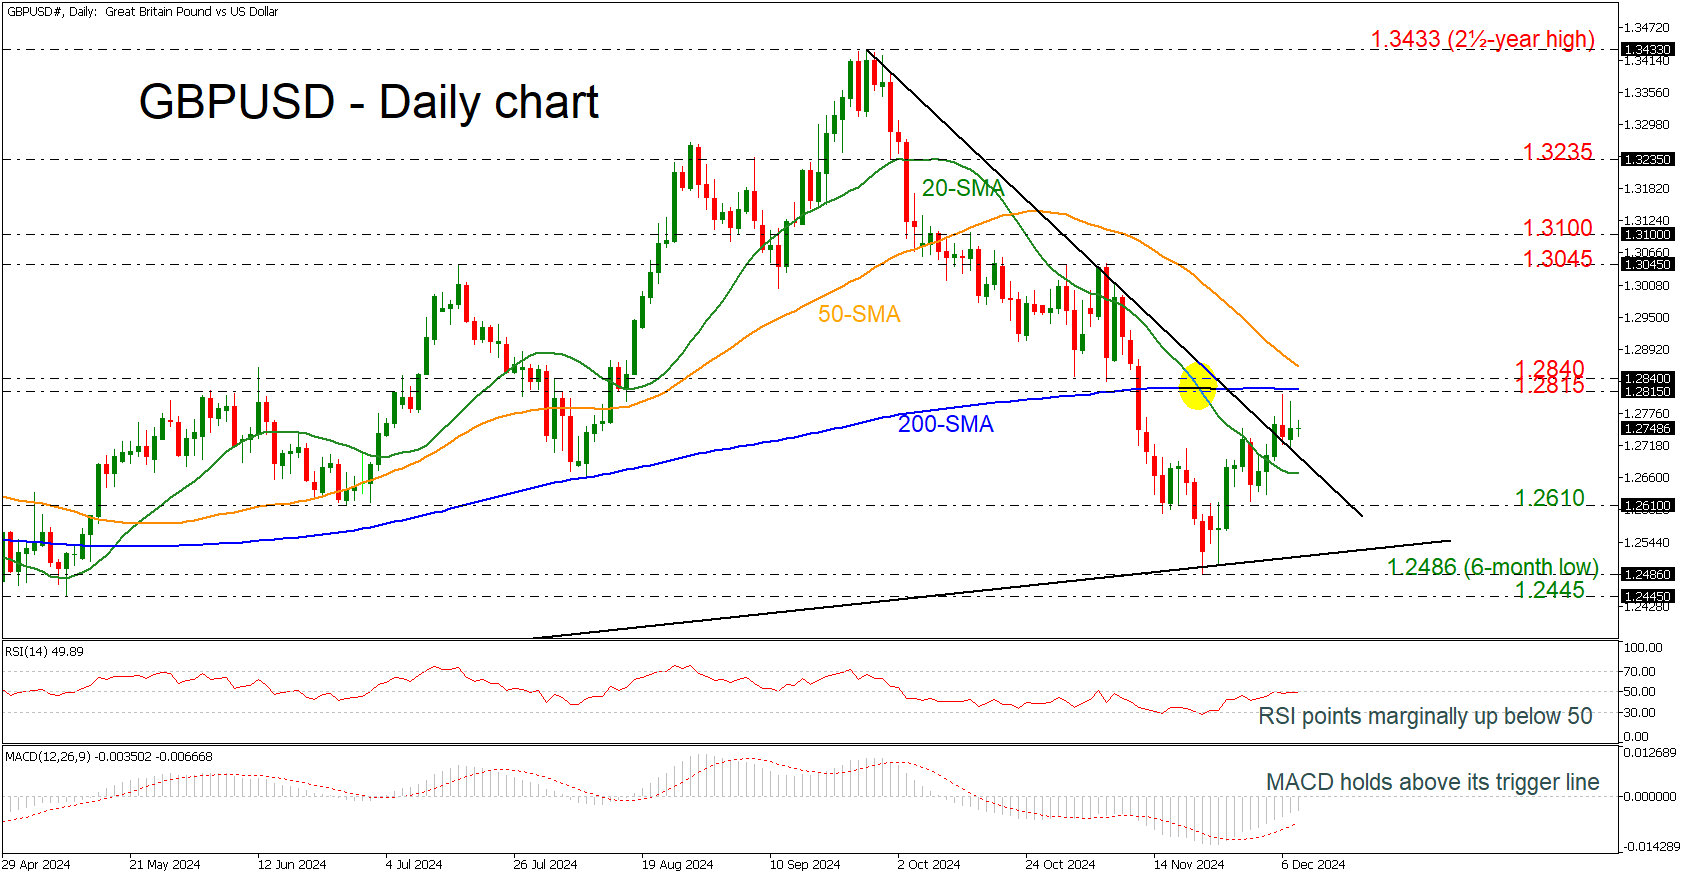
GBPUSD Capped By 200-Day SMA
- GBPUSD remains in negative area
- But holds beyond the downtrend line
- RSI and MACD give some optimistic views
GBPUSD is experiencing a new bullish attempt to remain above the short-term descending trend line, but the 200-day simple moving average (SMA) at 1.2815 appears to be a tough obstacle for traders.
If the market overcomes the aforementioned barrier, then immediate resistance would come from the inside swing lows at 1.2840. Should the price move above the 50-day SMA at 1.2870, it could spark optimism among the bulls. The 1.3045 and the 1.3100 resistance levels may endorse the bullish retracement in the short-term view.
On the other hand, a drop below the downtrend line again would endorse the negative structure, testing the 20-day SMA at 1.2670 before meeting the previous low near 1.2610.
The technical oscillators show some optimism for further increases. The RSI is battling with the neutral threshold of 50, while the MACD remains well above its trigger line below the zero level.
All in all, GBPUSD is still in bearish territory, especially after the failed attempt to surpass the 200-day SMA.
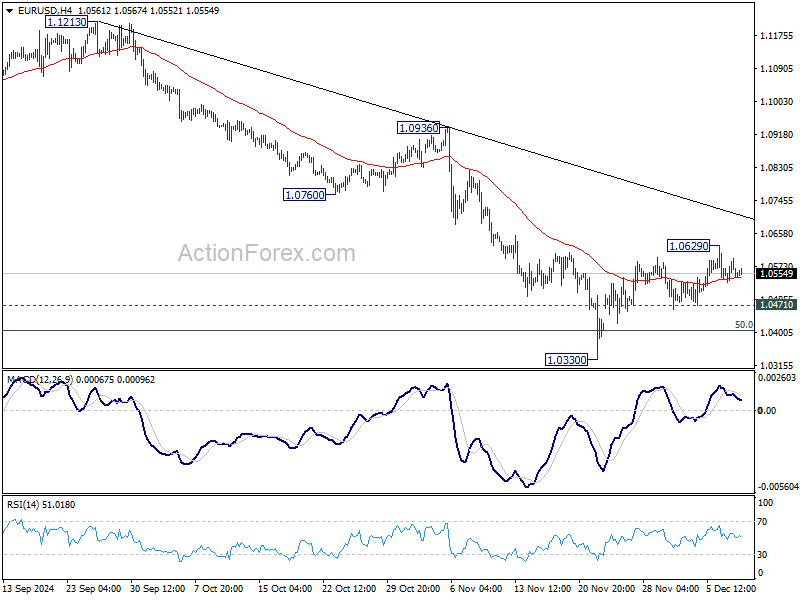
EUR/USD Daily Outlook
Daily Pivots: (S1) 1.0526; (P) 1.0560; (R1) 1.0589; More...
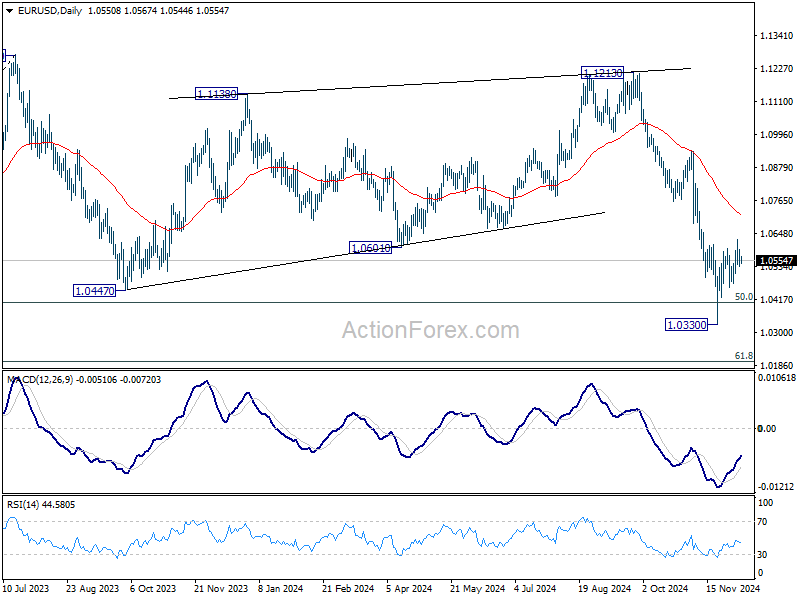
Intraday bias in EUR/USD remains neutral for the moment. Rebound from 1.0330 short term bottom could still extend higher. But outlook will remain bearish as long as 55 D EMA (now at 1.0711) holds. On the downside, break of 1.0471 minor support will turn bias to the downside for retesting 1.0330 low. Firm break of 1.0330 will resumed the decline from 1.1213, and sustained trading below 1.0404 key fibonacci level will carry larger bearish implication.
In the bigger picture, focus stays on 50% retracement of 0.9534 (2022 low) to 1.1274 at 1.0404. Strong rebound from this level will keep price actions from 1.1273 (2023 high) as a medium term consolidation pattern only. However, sustained break of 1.0404 will raise the chance that whole up trend from 0.9534 has reversed. That would pave the way to 61.8% retracement at 1.0199 first. Firm break there will target 0.9534 low again.
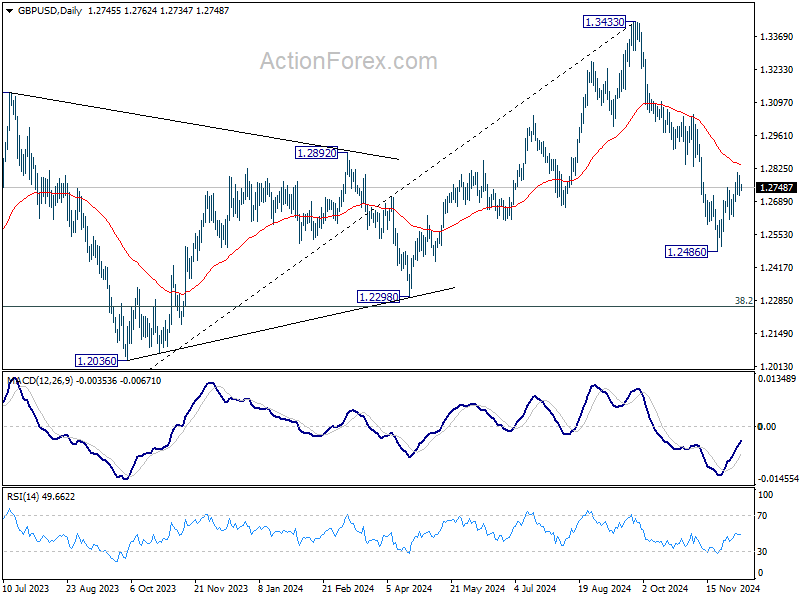
GBP/USD Daily Outlook
Daily Pivots: (S1) 1.2712; (P) 1.2756; (R1) 1.2794; More...
Intraday bias in GBP/USD remains neutral for the moment. Rebound from 1.2486 short term bottom could still extend higher. But outlook will stay bearish as long as 55 D EMA (now at 1.2839) holds. On the downside, below 1.2615 minor support will bring retest of 1.2486 first. Firm break there will target 1.2298 cluster support zone. However, sustained break of 55 D EMA will argue that the near term trend has reversed, and targets 1.3047 resistance for confirmation.
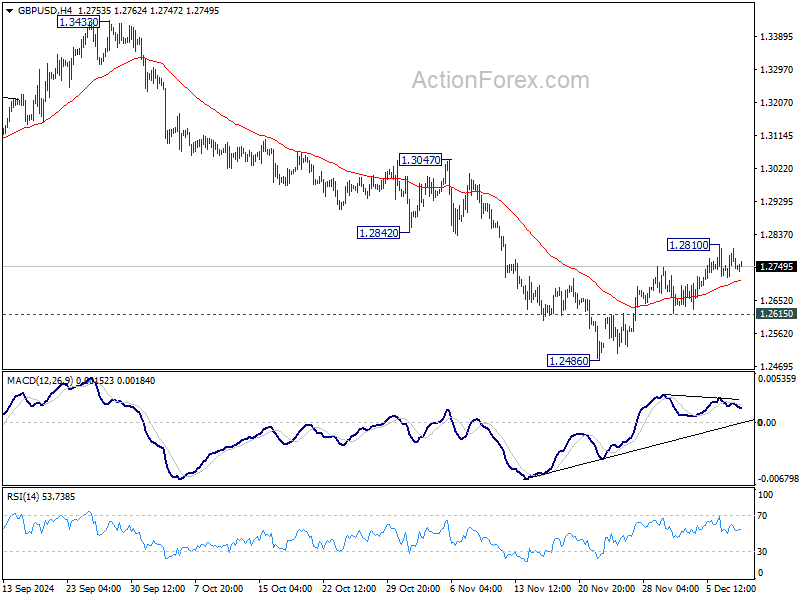
In the bigger picture, price actions from 1.3433 medium term are seen as correcting whole up trend from 1.0351 (2022 low). Deeper decline could be seen to 38.2% retracement of 1.0351 to 1.3433 at 1.2256, which is close to 1.2298 structural support. But strong support is expected there to bring rebound to extend the corrective pattern.
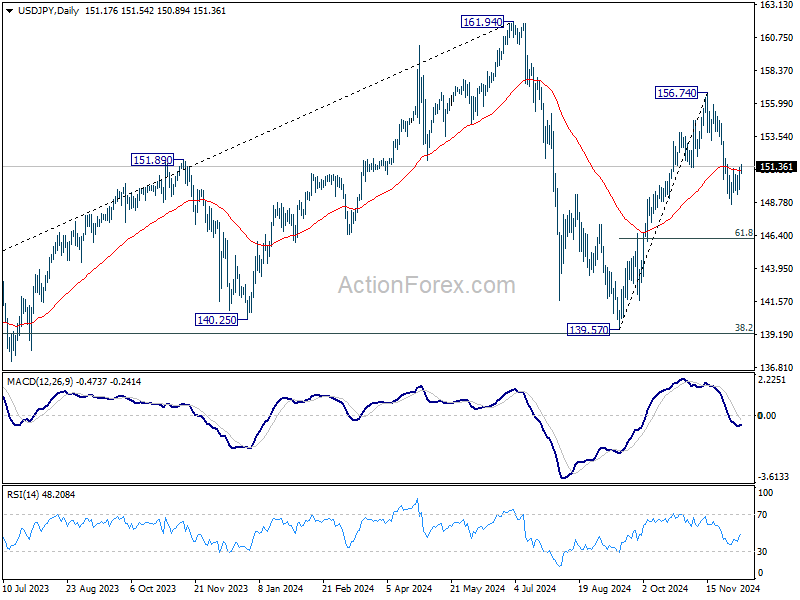
USD/JPY Daily Outlook
Daily Pivots: (S1) 150.16; (P) 150.76; (R1) 151.82; More...
Intraday bias in USD/JPY stays neutral and further decline is in favor as long as 151.94 resistance holds. On the downside, below 148.64 will strengthen the case that rise from 139.57 has already completed at 156.754. Deeper fall should then be seen to 61.8% retracement of 139.57 to 156.74 at 146.12 next. Nevertheless, firm break of 151.94 resistance will revive near term bullishness and bring retest of 156.74 high.
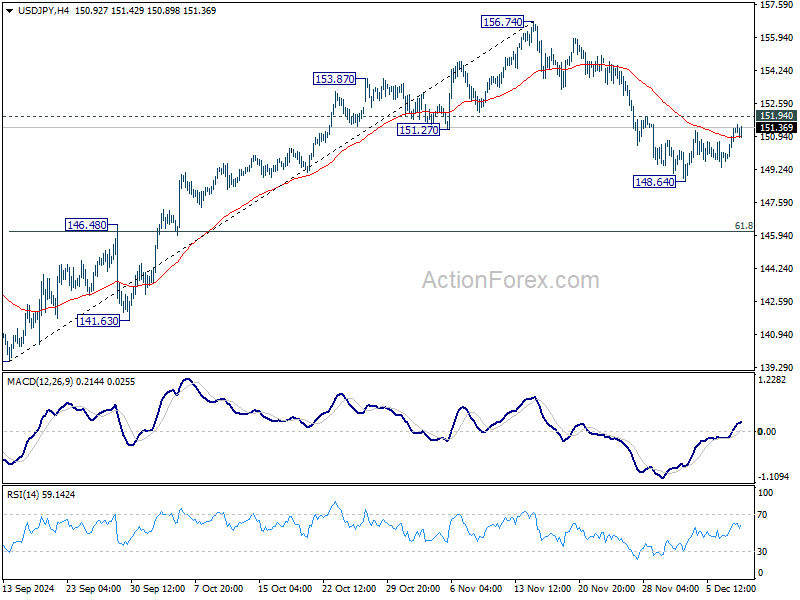
In the bigger picture, price actions from 161.94 are seen as a corrective pattern to rise from 102.58 (2021 low). The range of medium term consolidation should be set between 38.2% retracement of 102.58 to 161.94 at 139.26 and 161.94. Nevertheless, sustained break of 139.26 would open up deeper medium term decline to 61.8% retracement at 125.25.