
Sample Category Title
Aussie Slumps on Yuan Depreciation Speculation; US CPI and BoC Loom
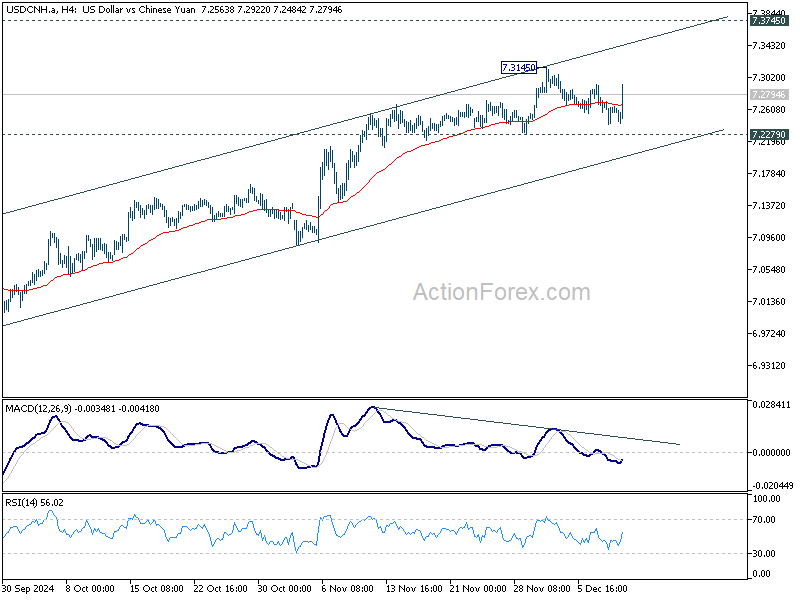
Australian Dollar continued its decline today as speculation mounted that China might allow Yuan to weaken in 2025 to counteract the economic impact of increased US trade tariffs under the incoming Trump administration. While no official announcement has been made, Beijing appears to ready to signal greater reliance on market-driven currency valuation. Also, according to a Reuters report, Chinese officials might tolerate depreciation of Yuan from its current level of 7.3 against Dollar to 7.5 if trade tensions intensify.
Technically, USD/CNH also bounces on the news but stays below 7.3145 short term top. Nevertheless, further rally is expected as long as 7.2279 support holds. Rise from 6.9709 is expected to continue. Break of 7.3145 will pave the way to 7.3745 key resistance (2022 high). The next rally is USD/CNH could give extra drag on AUD/USD.
Overall for the week so far, however, Yen is currently the worst performer, followed by Kiwi, and then Euro. Sterling is the best, followed by Dollar, and then Canadian. Swiss Franc and Aussie are mixed in the middle. The markets are now looking into today's US CPI and BoC rate decision for the next big moves.
BoC to flash rates by 50bps again in quick path to neutral
BoC is widely anticipated to lower its overnight rate by another 50bps at today’s meeting, reducing the policy rate to 3.25%. This follows a similar move in October, aimed at addressing a cooling economy where inflation has been at or below 2% for three months already, and core measures remain slightly above target. Last week’s data showing unemployment rate jumping to 6.8% from 6.5% solidified expectations of a significant rate reduction.
A recent Reuters poll highlighted this expectation, with 21 of 27 respondents predicting a 50bps cut and the remainder forecasting a more modest 25bps reduction. The primary argument for aggressive easing centers on the need to return interest rates to a neutral range, estimated between 2.25% and 3.25%. Following today's expected cut, rates would align with the upper bound of neutral, still potentially exerting a mildly restrictive effect on the economy.
However, there is an opposing view that recent resilience in consumer spending, inflation, and labor market data could justify a slower pace of easing. This argument suggests that BoC could take a more measured approach, affording time to assess the economy’s response to October’s 50bps cut before making further moves.
Regardless, the debate now shifts to determining the eventual terminal rate, with clarity likely, hopefully, to emerge only in January's Monetary Policy Report.
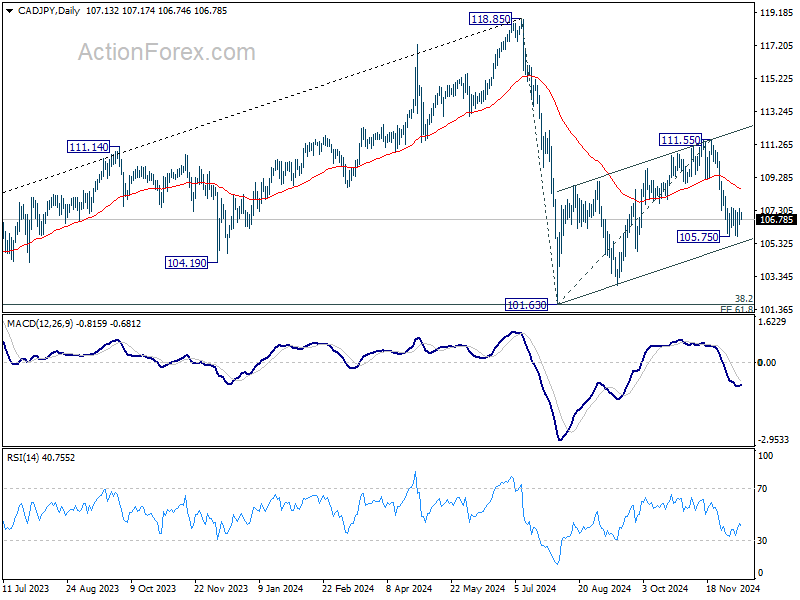
Technically, similar to other Yen crosses, CAD/JPY's corrective rebound from 101.63 should have completed with three waves up to 111.55. Further decline is expected as long as 55 D EMA (now at 108.65) holds. Break of last week's low at 105.75 will resume the fall from 111.55 towards 101.63 low, and possibly through it to resume the larger decline from 118.85. However, the speed of the decline could more hinge on the development in Yen than Loonie.
US CPI sets to drive EUR/USD for downside breakout
The spotlight today is firmly on the release of US CPI data for November. Expectations are for headline inflation to tick up from 2.6% to 2.7%, continuing its rebound from the September low of 2.4%. Meanwhile, core CPI is forecast to hold steady at 3.3%, staying in the 3.2%-3.2% range it has maintained since June.
Unless today’s data deviates significantly from expectations, it is unlikely to deter Fed from delivering a widely anticipated 25bps rate cut next week, bringing the federal funds rate to 4.25-4.50%. Fed fund futures currently reflect an 86% probability of this move.
But more critically, today’s readings could solidify the case for a pause in January, supported by futures pricing nearly 80% probability of such an outcome.
A pause would allow policymakers to digest the inflationary implications of upcoming fiscal and trade policies under President-elect Donald Trump. Current Treasury Secretary Janet Yellen cautioned that Trump’s tariffs pose a dual risk of "derail the progress" on inflation and have "adverse consequences on growth", creating a potential headache for Fed as it balances these challenges.
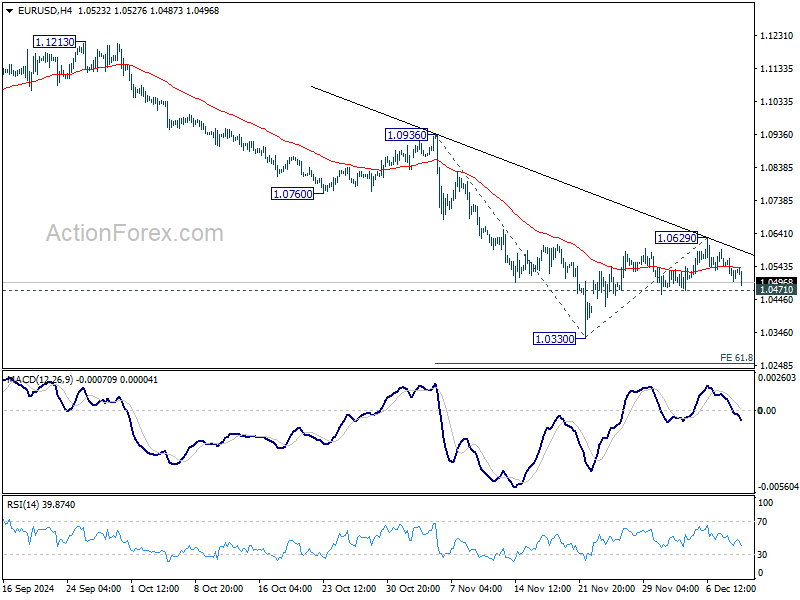
Technically, EUR/USD would be a key to watch in reaction to US CPI. Recovery from 1.0330 short term bottom is seen as a corrective move, might could have completed at 1.0629 already. Break of 1.0471 support will suggest that fall from 1.1213 is ready to resume through 1.0330. Next target will be 61.8% projection of 1.0936 to 1.0330 from 1.0629 at 1.0254.
AUD/USD Daily Report
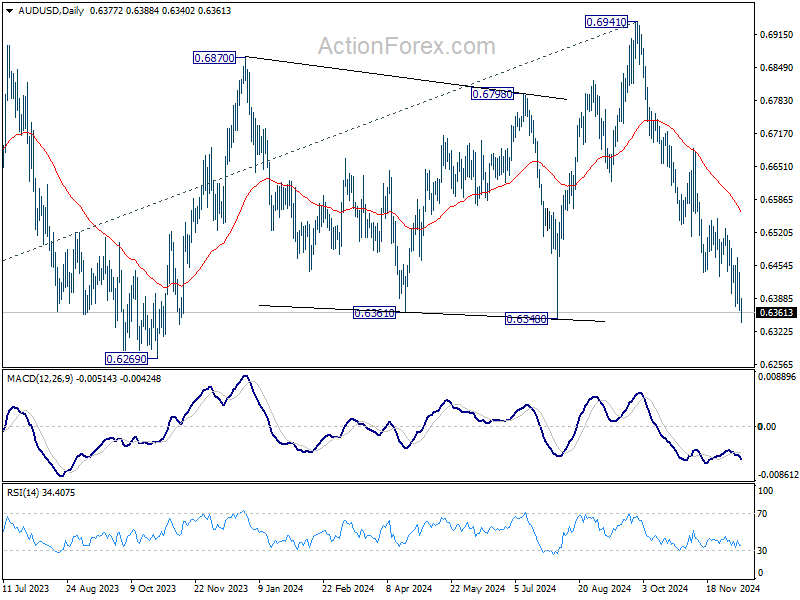
Daily Pivots: (S1) 0.6347; (P) 0.6395; (R1) 0.6426; More...
AUD/USD's break of 0.6371 temporary low indicates resumption of whole fall from 0.6941. Intraday bias is back on the downside for 0.6348 support, and then 0.6269. On the upside, above 0.6470 resistance will turn intraday bias neutral first. But outlook will stay bearish as long as 55 D EMA (now at 0.6559) holds, in case of recovery.
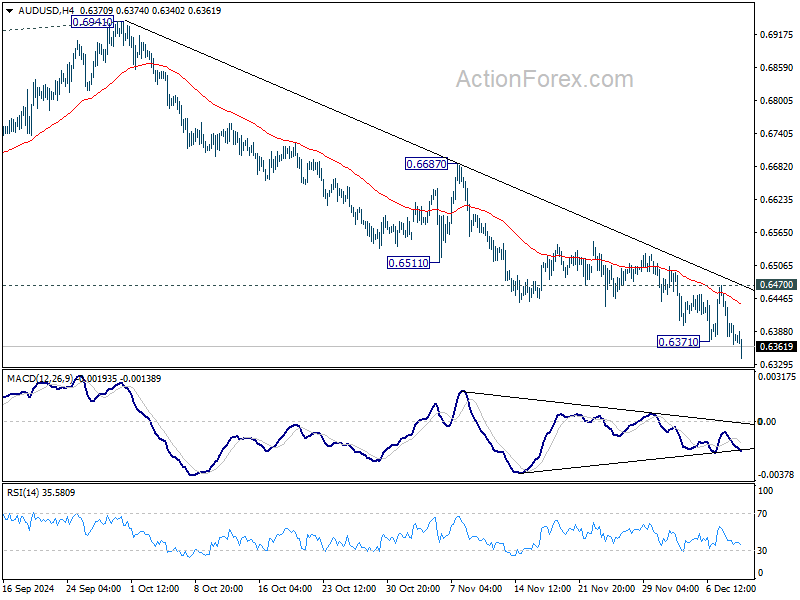
In the bigger picture, price actions from 0.6169 (2022 low) are seen as a medium term consolidation to the down trend from 0.8006. More sideway trading could be seen above 0.6169, but overall outlook will stay bearish as long as 0.6941 resistance holds. Firm break of 0.6169 will resume the down trend to 61.8% projection of 0.8006 to 0.6169 from 0.6941 at 0.5806 next.
USDJPY Battles With 200-Day SMA Near 152.00
- USDJPY remains below short-term uptrend line
- Bullish doji candle proved true
- Stochastic rallies occur in overbought area; RSI flattens
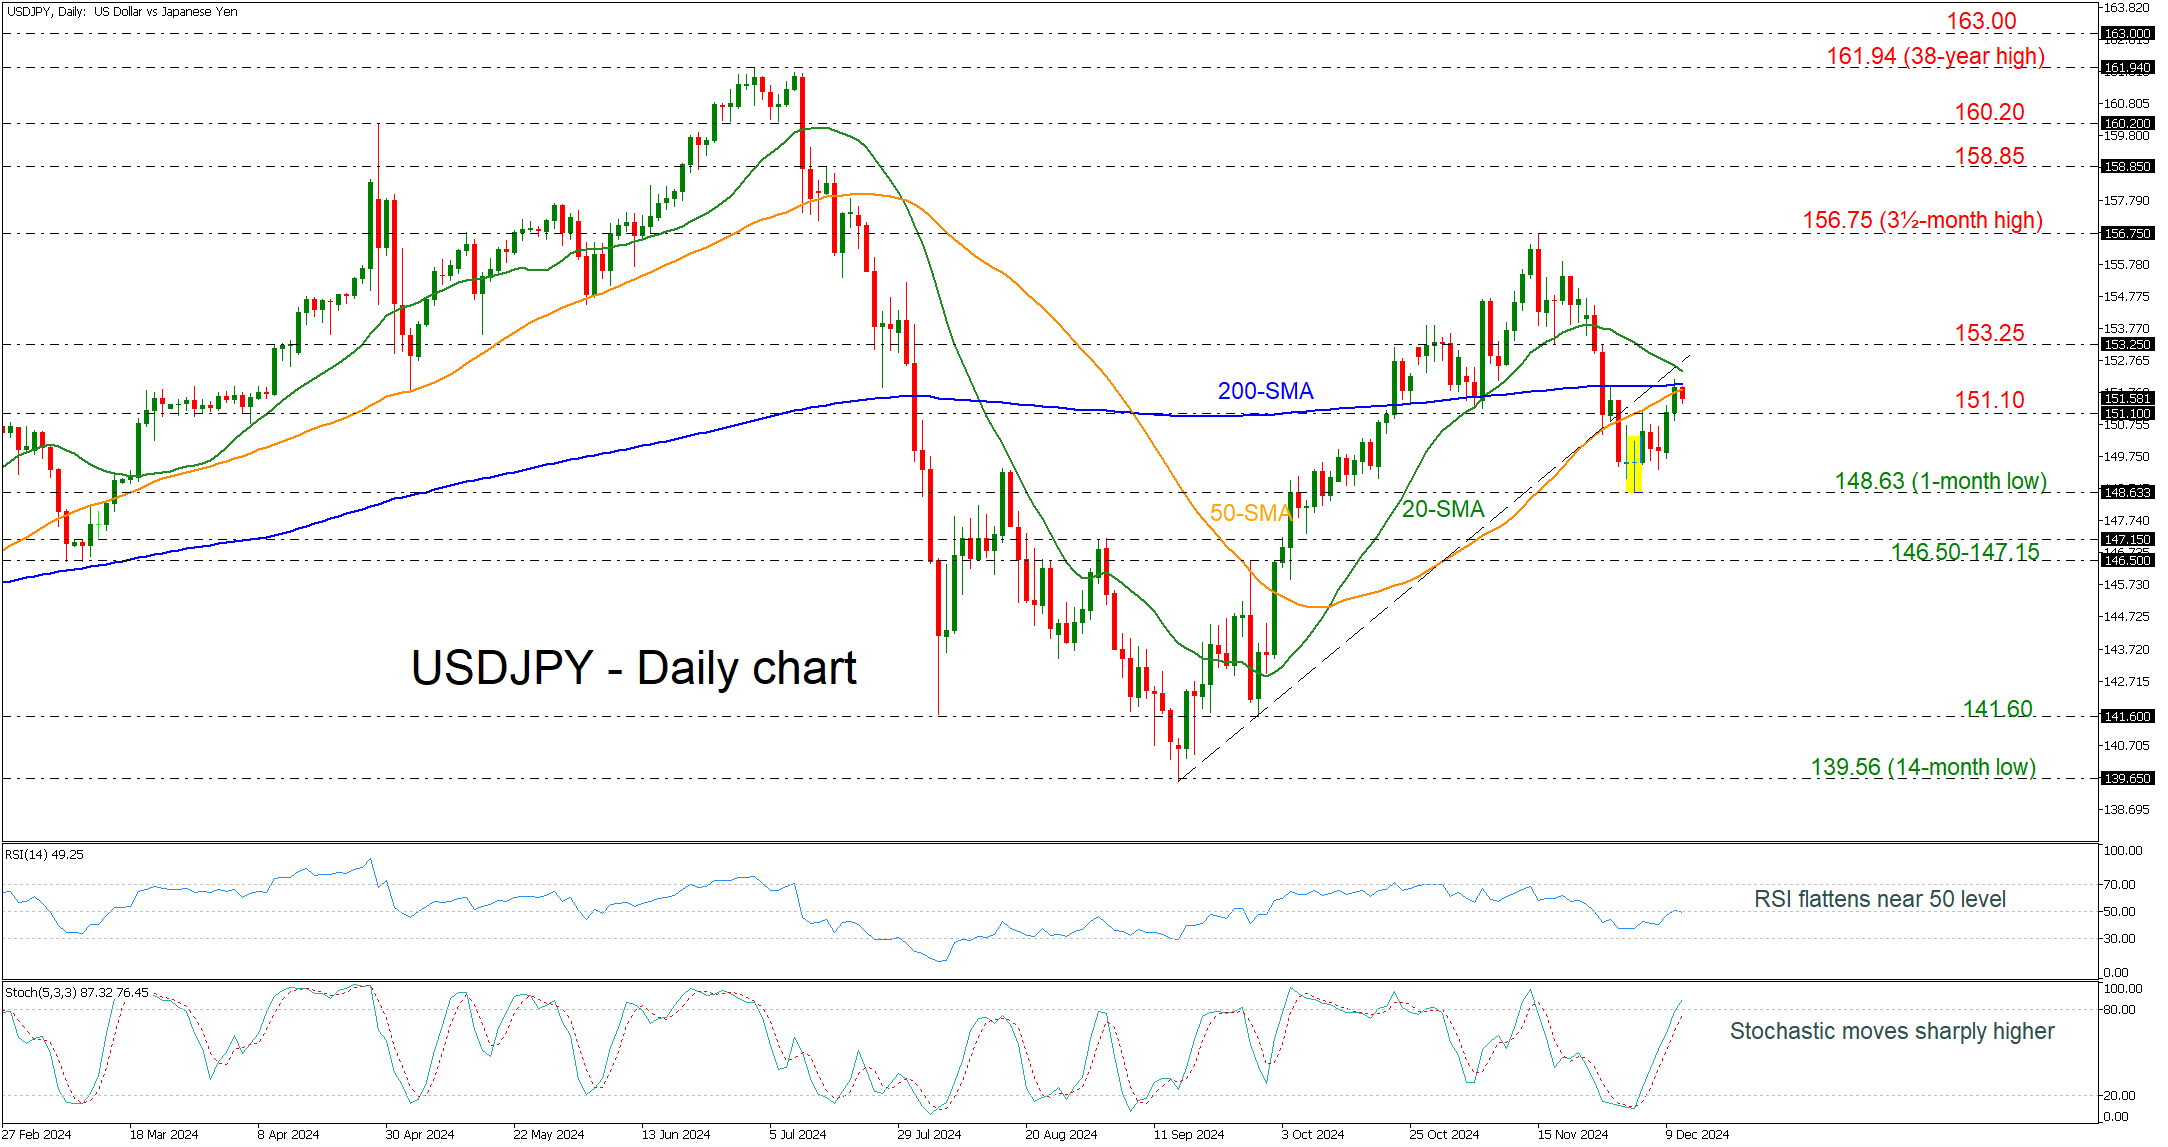
USDJPY is fighting with the significant 200-day simple moving average (SMA) around 152.00, trying to extend its bullish move that started after the bullish doji candle on December 3.
Momentum indicators are pointing to a neutral-to-positive bias in the short term, with the RSI just near the 50 level and the stochastic oscillator rising in overbought territory.
If prices continue to head higher, resistance should come from the 20-day SMA near the 152.40 mark. A move higher could reach 153.25, the inside swing low, and open the way to the three-and-a-half-month high of 156.75, which would reinforce the short-term bullish view.
However, should a downside reversal take form again, immediate support would likely come from the 151.10 ahead of the one-month trough at 148.63 A break lower could send traders towards the 146.50-147.15 region.
All in all, USDJPY is still standing beneath key levels such as the short-term uptrend line and the 200-day SMA. The pair needs some more boosts from the market to continue the upside tendency.
EUR/USD Faces Resistance While USD/CHF Builds Momentum
EUR/USD extended losses and traded below the 1.0550 support. USD/CHF is rising and might aim for a move toward the 0.8880 resistance.
Important Takeaways for EUR/USD and USD/CHF Analysis Today
- The Euro struggled to clear the 1.0635 resistance and declined against the US Dollar.
- There is a key bearish trend line forming with resistance at 1.0545 on the hourly chart of EUR/USD at FXOpen.
- USD/CHF is showing positive signs above the 0.8800 resistance zone.
- There was a break above a major bearish trend line with resistance at 0.8785 on the hourly chart at FXOpen.
EUR/USD Technical Analysis
On the hourly chart of EUR/USD at FXOpen, the pair failed to clear the 1.0635 resistance. The Euro started a fresh decline below the 1.0550 support against the US Dollar, as mentioned in the previous analysis.
The pair declined below the 1.0520 support and the 50-hour simple moving average. Finally, the pair tested the 1.0500 level. A low was formed at 1.0498 and the pair is now consolidating losses. The pair is showing bearish signs, and the upsides might remain capped.
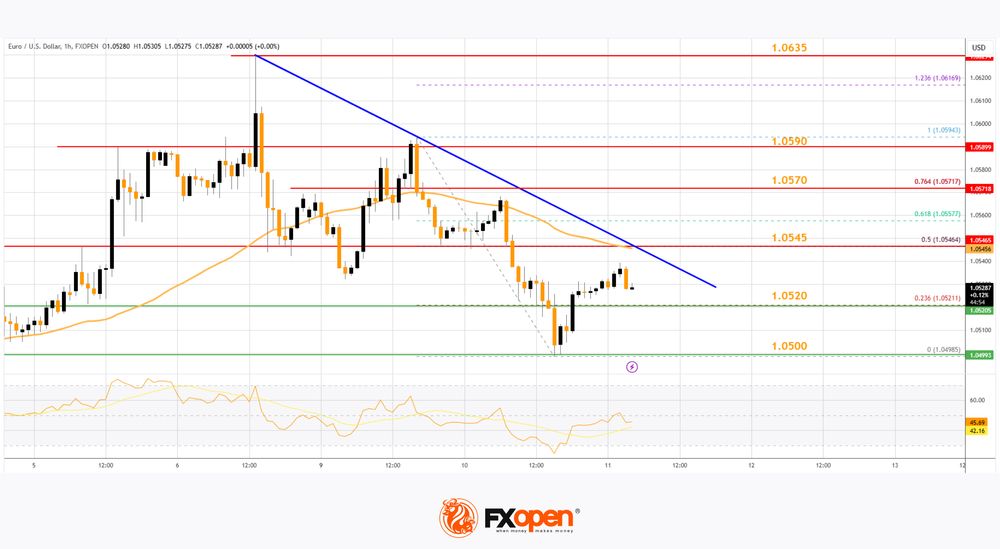
There was a minor increase above the 23.6% Fib retracement level of the downward move from the 1.0594 swing high to the 1.0498 low. Immediate resistance on the upside is near the 1.0545 level.
There is also a key bearish trend line forming with resistance at 1.0545 and the 50-hour simple moving average. The next major resistance is near the 1.0570 zone or the 76.4% Fib retracement level of the downward move from the 1.0594 swing high to the 1.0498 low.
The main resistance sits near the 1.0590 level. An upside break above the 1.0590 level might send the pair toward the 1.0635 resistance. Any more gains might open the doors for a move toward the 1.0675 level.
On the downside, immediate support on the EUR/USD chart is seen near 1.0520. The next major support is near the 1.0500 level. A downside break below the 1.0500 support could send the pair toward the 1.0445 level.
USD/CHF Technical Analysis
On the hourly chart of USD/CHF at FXOpen, the pair started a decent increase from the 0.8730 support. The US Dollar climbed above the 0.8765 resistance zone against the Swiss Franc.
There was a break above a major bearish trend line with resistance at 0.8785. The bulls were able to pump the pair above the 50-hour simple moving average and 0.8800. There was a clear move above the 61.8% Fib retracement level of the downward move from the 0.8879 swing high to the 0.8731 low.
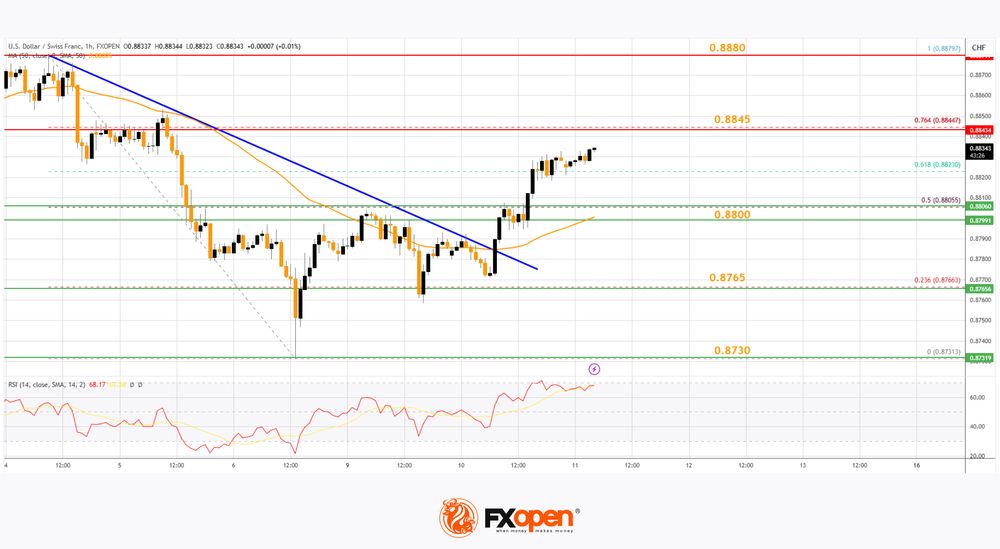
On the upside, the pair is now facing resistance near 0.8845 and the 76.4% Fib retracement level of the downward move from the 0.8879 swing high to the 0.8731 low.
The main resistance is now near 0.8880. If there is a clear break above the 0.8880 resistance zone and the RSI remains above 50, the pair could start another increase. In the stated case, it could test 0.8920.
If there is a downside correction, the pair might test the 0.8800 level. The first major support on the USD/CHF chart is near the 0.8765 level. The next key support is near the 0.8730 level. A downside break below 0.8730 might spark bearish moves. Any more losses may possibly open the doors for a move toward the 0.8700 level in the near term.
Trade over 50 forex markets 24 hours a day with FXOpen. Take advantage of low commissions, deep liquidity, and spreads from 0.0 pips. Open your FXOpen account now or learn more about trading forex with FXOpen.
This article represents the opinion of the Companies operating under the FXOpen brand only. It is not to be construed as an offer, solicitation, or recommendation with respect to products and services provided by the Companies operating under the FXOpen brand, nor is it to be considered financial advice.
USD Strengthens as ECB Rate Cut Looms
Fundamental Analysis
The USD's revaluation on Tuesday, December 10, 2024, is largely driven by expectations of a 25 basis point rate cut by the European Central Bank (ECB), which would weaken the euro. Markets have already priced in this adjustment, putting pressure on EUR/USD, which has dropped near 1.0520. The ECB's expansionary monetary policy, contrasted with the Federal Reserve’s more restrictive stance, supports the dollar.
Furthermore, political uncertainty in France and Germany, coupled with the potential negative impact of Donald Trump's trade policies, is contributing to the euro's weakness. Internal tensions in the Eurozone and economic slowdown heighten expectations of moderate growth, reinforcing the view that the USD will remain strong against the euro.
Technical Analysis
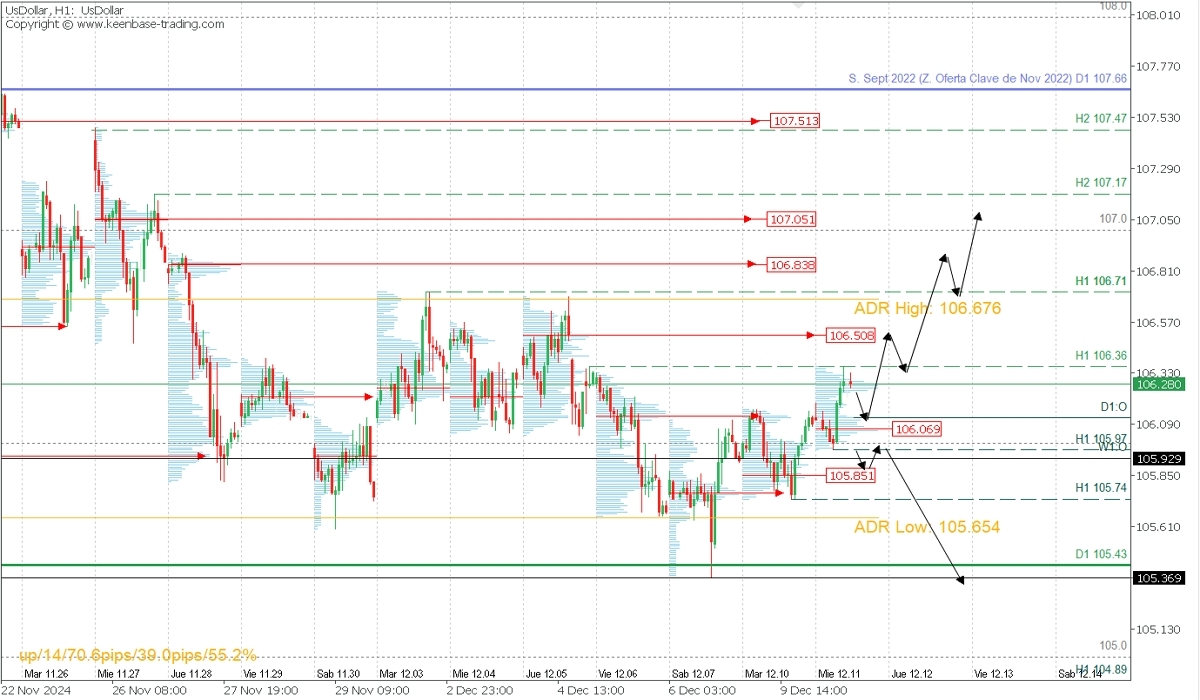
Dollar Index, H1
Supply Zones (Sell): 106.50
Demand Zones (Buy): 106.06 and 105.85
The Dollar Index shows a bullish reversal structure after decisively surpassing 106.00, leaving behind two volume concentrations with uncovered POCs at 105.85 and 106.06, representing demand zones with liquidity for bulls.
Under current conditions, the bullish opening has reached local resistance at 106.38, and may correct towards the broken Asian high at 106.19 or more extended to 106.06, from where buying can resume towards the uncovered POC at 106.50, with extension to the average bullish range at 106.67. This bullish scenario remains valid as long as support at 105.97 holds.
EURUSD, H1
Supply Zones (Sales): 1.05529
Demand Zones (Purchases):1.0529 and 1.0498
The bearish opening has left a volume concentration around 1.0552, the supply zone that initiated the downward move. If demand zones are defended by bulls, a bounce towards 1.0532 is possible, from where selling can resume. On the other hand, if the bearish momentum decisively breaks below 1.0529 and support at 1.0521, further declines are expected towards 1.0510 and possibly 1.0500.
The bearish scenario remains in play unless the price breaks above the Asian resistance and the day's high at 1.0568.

Technical Summary
- Corrective Bullish Scenario: Buy above 1.0533 with TP at 1.0550 intraday, then resume selling. Use a 1% capital stop loss with a low lot size to allow room for movement.
Bearish Scenario after Retracement: Sell below 1.0552 with TPs at 1.0500 and 1.0480 intraday, and 1.0446 in the coming days. - Anticipated Bearish Scenario: If the price decisively drops below 1.0521, target 1.0500, 1.0480 intraday, and continue downward with TP at 1.0447 in the following days.
- Always wait for the formation and confirmation of a Reversal/Exhaustion Pattern (PAR) on the M5 chart, as shown here: https://t.me/spanishfbs/2258 before entering trades at the key zones indicated.
Uncovered POC: POC = Point of Control: It is the level or area where the highest volume concentration occurred. If a bearish move followed it, it’s considered a sell zone and forms resistance. Conversely, if an upward move followed it, it’s seen as a buy zone, typically at lows, forming support.
AUD/USD Daily Report
Daily Pivots: (S1) 0.6347; (P) 0.6395; (R1) 0.6426; More...
AUD/USD's break of 0.6371 temporary low indicates resumption of whole fall from 0.6941. Intraday bias is back on the downside for 0.6348 support, and then 0.6269. On the upside, above 0.6470 resistance will turn intraday bias neutral first. But outlook will stay bearish as long as 55 D EMA (now at 0.6559) holds, in case of recovery.
In the bigger picture, price actions from 0.6169 (2022 low) are seen as a medium term consolidation to the down trend from 0.8006. More sideway trading could be seen above 0.6169, but overall outlook will stay bearish as long as 0.6941 resistance holds. Firm break of 0.6169 will resume the down trend to 61.8% projection of 0.8006 to 0.6169 from 0.6941 at 0.5806 next.
US CPI sets to drive EUR/USD for downside breakout
The spotlight today is firmly on the release of US CPI data for November. Expectations are for headline inflation to tick up from 2.6% to 2.7%, continuing its rebound from the September low of 2.4%. Meanwhile, core CPI is forecast to hold steady at 3.3%, staying in the 3.2%-3.2% range it has maintained since June.
Unless today’s data deviates significantly from expectations, it is unlikely to deter Fed from delivering a widely anticipated 25bps rate cut next week, bringing the federal funds rate to 4.25-4.50%. Fed fund futures currently reflect an 86% probability of this move.
But more critically, today’s readings could solidify the case for a pause in January, supported by futures pricing nearly 80% probability of such an outcome.
A pause would allow policymakers to digest the inflationary implications of upcoming fiscal and trade policies under President-elect Donald Trump. Current Treasury Secretary Janet Yellen cautioned that Trump’s tariffs pose a dual risk of "derail the progress" on inflation and have "adverse consequences on growth", creating a potential headache for Fed as it balances these challenges.
Technically, EUR/USD would be a key to watch in reaction to US CPI. Recovery from 1.0330 short term bottom is seen as a corrective move, might could have completed at 1.0629 already. Break of 1.0471 support will suggest that fall from 1.1213 is ready to resume through 1.0330. Next target will be 61.8% projection of 1.0936 to 1.0330 from 1.0629 at 1.0254.
Upside Surprise in US CPI Will Strengthen January FOMC Pause
Markets
German Bunds outperformed US Treasuries and UK Gilts yesterday as we approach final policy meetings of respective central banks which are set to widen their diverging views. The ECB will on Thursday conduct a third consecutive (and 4th in total) 25 bps rate cut. A possibly slightly lower GDP and CPI outlook is covered by uncertainty (and downside risks). It will prompt a different tone in the policy statement, erasing the expressed need to keep policy restrictive for as long as necessary to bring inflation sustainably back to 2%. Returning to forward looking decision making instead of data dependence allows the ECB early next year to ignore any possible hick-ups in a still bumpy inflation path, instead arguing that price stability will be achieved in the longer run. We expect those dovish twists to hold end of 2025 money market rates below neutral levels (+- 2.25%) even if we don’t think that this will eventually materialize. As ECB Schnabel pointed out, a stimulative monetary policy can help overcome cyclical economic weakness but doesn’t fix the structural issues Europe is struggling with. Daily changes on the German yield curve ranged between -3.6 bps (2-yr) and +0.7 bps (30-yr). The (very) long end of the curve is that way extending its nascent bottoming out process. Loss of interest rate support pulled the single currency lower. EUR/USD failed this month to regain the 1.06-handle with gravity gently leading the pair back towards 1.04 (close: 1.0527). EUR/GBP’s closing level (0.8243) was the lowest since the brexit-induced sell-off lifted the pair from around 0.70 to 0.9250 in 2016. The intraday-low from early 2022 (0.8203) is ready to be tested and at risk of break. Such break would be of huge technical importance, ending almost 8 years of range trading between roughly 0.82 and 0.95. US and UK yields yesterday respectively added between 2 and 3.4 bps and 2.9 and 5.8 bps, both in a bearish steepening move.
Today’s eco calendar is compact, but interesting with November US CPI inflation numbers and a $39bn 10-yr Note auction. Consensus expects monthly price growth of 0.3% for both headline and core inflation. That would keep annual figures broadly unchanged at respectively 2.7% and 3.3%. We don’t expect today’s numbers to change the outcome of next week’s FOMC meeting (25 bps), but any upward surprise will strengthen the idea of a January pause in the rate cut cycle and could prompt more underperformance of US Treasuries. Against the background of Trump’s expansionary fiscal plans, tonight’s 10-yr Note and tomorrow’s 30-yr Bond auction deserve monitoring (possible weakness?). A weaker EUR/USD is this week’s default play.
News & Views
The European Commission released its funding plan for the first half of 2025. It intends to issue €90 billion of long-term bonds between January and June 2025. This compared to the €75bn issued in the first half of this year and the €65bn in the second half of 2024. The Commission will raise these funds over seven auctions and six syndicated transactions. Volumes via auctions are expected to increase during the semester in line with the increased funding target, keeping the auction share stable. This increase will be facilitated by the introduction of three-leg bond auctions during the semester, with an indicative start as of Q2 2025. The funds raised will be used to cover payments under the NextGenerationEU and additional needs that arise from other policy programmes, including support to Ukraine. Bonds will continue to be issued using benchmark maturities from 3 to 30 years. Maturities for the new lines will be chosen based on market conditions and the need to bring liquidity to the EU curve. There’s a tentative focus for new conventional benchmark bonds on the 3-y, 10-yr and 20-yr segment. The Commission will continue to issue NextGenerationEU Green Bonds as well with a preference to tap existing NGEU Green Bonds to improve liquidity before issuing new lines.
Germany’s IG Metall chair, Christiane Benner, urges Berlin to drop the cap on its borrowing limit. The head of Germany’s dominant metalworkers union (and the largest European industrial union) said policymakers should follow the US and Chinese example, which are strongly supporting their domestic industries. While all off the parties in pole position to be in the next government, including the poll-leading CDU/CSU, are open for changes to the constitutional debt brake, Benner said the cap had to “stop immediately, not after the elections”. Her call comes amid a wave of industrial job cuts that’s underscoring deep economic woes.
BoC to flash rates by 50bps again in quick path to neutral
BoC is widely anticipated to lower its overnight rate by another 50bps at today’s meeting, reducing the policy rate to 3.25%. This follows a similar move in October, aimed at addressing a cooling economy where inflation has been at or below 2% for three months already, and core measures remain slightly above target. Last week’s data showing unemployment rate jumping to 6.8% from 6.5% solidified expectations of a significant rate reduction.
A recent Reuters poll highlighted this expectation, with 21 of 27 respondents predicting a 50bps cut and the remainder forecasting a more modest 25bps reduction. The primary argument for aggressive easing centers on the need to return interest rates to a neutral range, estimated between 2.25% and 3.25%. Following today's expected cut, rates would align with the upper bound of neutral, still potentially exerting a mildly restrictive effect on the economy.
However, there is an opposing view that recent resilience in consumer spending, inflation, and labor market data could justify a slower pace of easing. This argument suggests that BoC could take a more measured approach, affording time to assess the economy’s response to October’s 50bps cut before making further moves.
Regardless, the debate now shifts to determining the eventual terminal rate, with clarity likely, hopefully, to emerge only in January's Monetary Policy Report.
Technically, similar to other Yen crosses, CAD/JPY's corrective rebound from 101.63 should have completed with three waves up to 111.55. Further decline is expected as long as 55 D EMA (now at 108.65) holds. Break of last week's low at 105.75 will resume the fall from 111.55 towards 101.63 low, and possibly through it to resume the larger decline from 118.85. However, the speed of the decline could more hinge on the development in Yen than Loonie.
All Eyes on US CPI
In focus today
The most important data release of the day will be the US November CPI. We think inflation remained steady in headline terms (forecast: 0.2% m/m SA and 2.6% y/y vs. Oct: 0.2% m/m SA and 2.6% y/y). Core inflation likely slowed down slightly from the previous month (forecast: 0.2% m/m SA and 3.2% y/y vs. Oct: 0.3% m/m SA and 3.3% y/y). A reading in line with our forecast would support the case for a Fed rate cut at the meeting next week.
At 15:45 CET, Bank of Canada (BoC) will announce its rate decision. Consensus favours a 50bp cut, while markets are pricing in 41bp. We expect a 25bp cut, which would bring the policy rate to 3.50% amid the recent turn in inflation and potential spillovers from stronger US growth in 2025. However, risks are skewed towards a 50bp rate cut given the emphasis on excessive supply in the BoC's October MPR and last week's weak labour market data. As this is an interim meeting without any new MPR, we pay close attention to any signals in the press conference about the path of the cutting cycle in 2025.
Overnight we should get the policy statement from the Central Economic Work Conference in China, including economic priorities for 2025. We expect to see a clear sign of continued stimulus, but it is unlikely we get any specific details or numbers.
Economic and market news
What happened overnight
In Japan, wholesale inflation printed stronger than expected at 3.7% y/y (cons: 3.4%) and 0.3% m/m (cons: 0.2%), respectively. Trending higher for three months, the print supports our call for Bank of Japan to deliver a rate hike in December.
What happened yesterday
In the US, the NFIB small business optimism index jumped to 101.7 in November from 93.7 in December. However, this is not entirely surprising given that the survey's general 'uncertainty' index reached an all-time high ahead of the election. Easing political uncertainty supported most of the survey's sub-indices as well, as companies reported increasing hiring and price plans. While this surely is a bit concerning for inflation, we will likely need to wait for a few months for the election effects to fully fade.
In Denmark, CPI inflation was unchanged at 1.6% in November. While particularly food and summer house rentals were lower than expected, housing equipment pulled higher after price declines in October. The core m/m inflation print was approx. 0.
In Norway, core inflation surprised to the upside, printing 3.0% y/y (cons: 2.8%), aligning with Norges Bank's projection of 3.0% y/y. The largest upside surprise stems from domestic goods including food, and especially furniture, electronics and various household equipment. The surprising upticks could be due to a combination of cost push and improved pricing power, which could signal a turnaround in demand. A large part could easily also be attributed to Black Week-effects.
Overall, the release naturally should diminish the expectations for a cut in January. However, Norges Bank has put more emphasis on the balance of risk for the medium-term outlook for inflation. In that context, Thursday's Regional Network Survey, in particular the readings on capacity utilisation, wage growth and the labour market, are far more important for the forward guidance signals that we are going to get from Norges Bank next week.
In Sweden, the GDP, production and consumption indicators for October were surprisingly weak, printing -0.4% m/m, -0.8% m/m, and -0.3% m/m, respectively. For the GDP indicator, we saw substantial revisions with a large upward revision for August, resulting in a September print of -1.5% m/m. Looking at the rolling 3m changes, the picture is a bit less dire, but the start of Q4 is still not the one we looked for. While these monthly indicators are uncertain and often revised, the data at hand gives good reasons for the Riksbank to continue to cut rates to support the economic recovery.
Equities: Global equities were lower yesterday, marking a decline for the second consecutive day this week. Cyclical sectors, led by the high-flying technology sector, drove what was a broad-based decline. It is quite interesting to observe the market dynamics in this context. We argue that we received one of the clearest confirmations of Trump trade macro data yesterday, yet equities still closed lower. This concerns the NFIB index, which reported the highest monthly improvement on record, indicating a massive surge in confidence among smaller businesses, yet the equity markets barely took notice of the data. While there are compelling reasons to suggest that the initial phase of the Trump trade has been priced in, it is undeniable that the significant rise in the NFIB index makes a rally in equities in 2025 - and notably in small caps - much more probable, alongside continued job gains. In the US yesterday: Dow -0.4%, S&P 500 -0.3%, Nasdaq -0.3%, and Russell 2000 -0.4%.
FI: Global bond yields rose modestly ahead of the US CPI release today. The consensus expectations for the core-CPI are 0.3% m/m and 3.3% y/y for November relative to is 0.3% m/m and 3.3% y/y.
FX: Another relatively quiet day in G10 FX ahead of today's US CPI print and tomorrow's ECB meeting, marked by broad USD strength, particularly against AUD and NZD. EUR/USD edged slightly lower within the 1.05-1.06 range, while USD/JPY continued its upward trend as market expectations for a December BoJ hike shifted toward a hold. Scandies remained largely range-bound against the EUR, with EUR/NOK holding above 11.70 and EUR/SEK trading around 11.55.
GBP/USD Tests 1.2800: Breakout Could Ignite Momentum
Key Highlights
- GBP/USD started a recovery wave above the 1.2550 resistance zone.
- A key rising channel is forming with support near 1.2720 on the 4-hour chart.
- Gold prices could accelerate higher toward $2,700 or even $2,720.
- USD/JPY is recovering losses and might test the 152.50 resistance.
GBP/USD Technical Analysis
The British Pound started a recovery wave above the 1.2450 and 1.2550 levels against the US Dollar. GBP/USD climbed above 1.2620 to move into a short-term positive zone.
Looking at the 4-hour chart, the pair surpassed the 50% Fib retracement level of the downward move from the 1.3009 swing high to the 1.2487 low. The pair recovered above the 1.2720 resistance level and the 100 simple moving average (red, 4-hour).
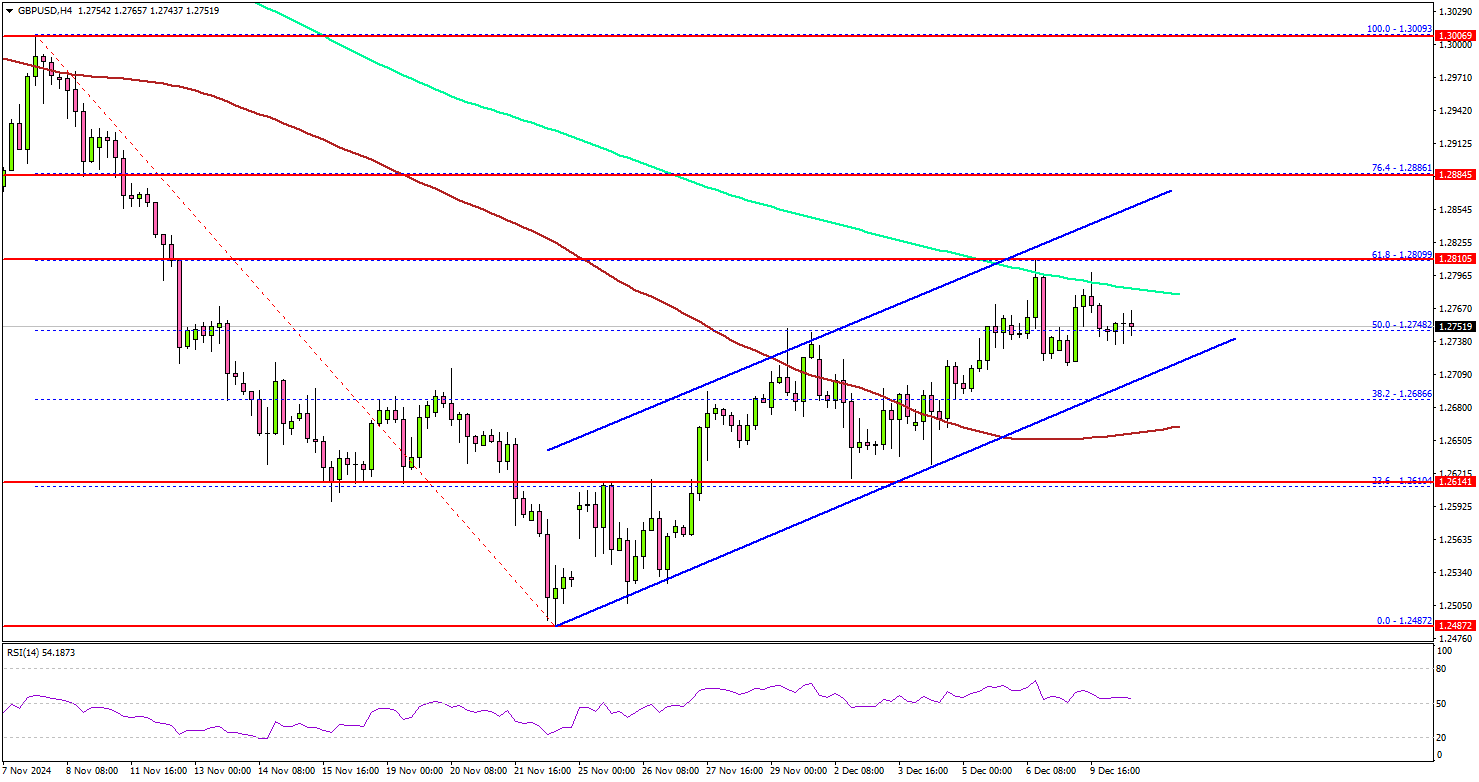
On the upside, the pair could face resistance near the 1.2800 level and the 200 simple moving average (green, 4-hour). It is close to the 61.8% Fib retracement level of the downward move from the 1.3009 swing high to the 1.2487 low.
The first major resistance is near the 1.2885 level. A close above the 1.2885 level could set the tone for another increase. The next major resistance could be the 1.2965 level, above which the price could climb higher toward the 1.3000 resistance.
On the downside, immediate support sits near the 1.2720 level. There is also a key rising channel forming with support near 1.2720 on the same chart. The next key support sits near the 1.2650 level. Any more losses could send the pair toward the 1.2580 level.
Looking at Gold, the price remained in a positive zone and the bulls could soon aim for a move above the $2,700 level.
Upcoming Economic Events:
- US Consumer Price Index for Nov 2024 (MoM) – Forecast +0.2%, versus +0.2% previous.
- US Consumer Price Index for Nov 2024 (YoY) – Forecast +2.7%, versus +2.6% previous.
- US Consumer Price Index Ex Food & Energy for Nov 2024 (YoY) – Forecast +3.3%, versus +3.3% previous.