Sample Category Title
EUR/USD Pausing Around 1.0800, GBP/USD Bullish Breakout, USD/JPY Strong Support Has Been Broken.
EUR/USD Pausing around 1.0800.
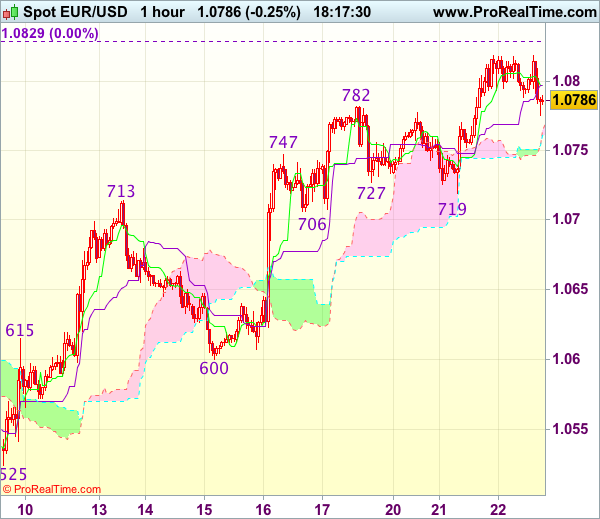
EUR/USD keeps on pushing higher, even though the pair is now pausing around 1.0800. A break of the upside channel would signal persistent buying pressures. Key resistance is given at a distance 1.0874 (08/12/2017 high). Strong support can be found at 1.0493 (22/02/2017 low). The technical structure suggests deeper increase towards resistance at 1.0874.
In the longer term, the death cross late October indicated a further bearish bias. The pair has broken key support given at 1.0458 (16/03/2015 low). Key resistance holds at 1.1714 (24/08/2015 high). Expected to head towards parity.

GBP/USD Bullish breakout.
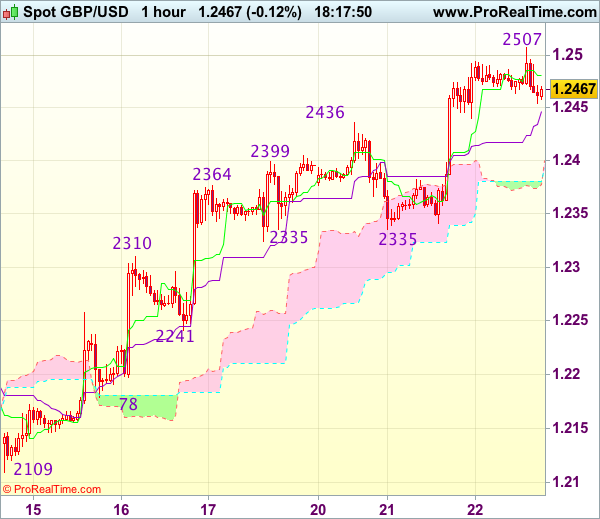
GBP/USD has broken bearish downtrend channel. The pair has broken resistance at 1.2429 and there are rooms for further strength. Key resistance can be located at 1.2570 (24/02/2017 high). Hourly support is given at 1.2324 (03/17/2017 low).
The long-term technical pattern is even more negative since the Brexit vote has paved the way for further decline. Long-term support given at 1.0520 (01/03/85) represents a decent target. Long-term resistance is given at 1.5018 (24/06/2015) and would indicate a long-term reversal in the negative trend. Yet, it is very unlikely at the moment
USD/JPY Strong support has been broken.
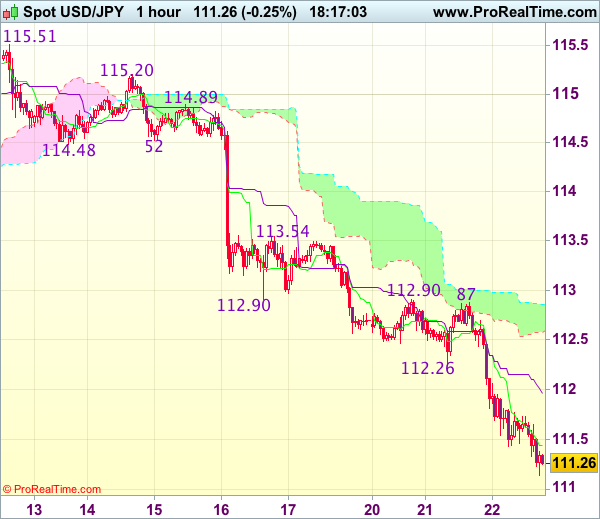
USD/JPY has failed to break key resistance given at 115.62 (19/01/2016 high) confirming persistent selling pressure. The pair has broken strong support at 111.36 (28/11/2016 low). Hourly resistance can be located at 113.57 (16/03/2017 high).
We favor a long-term bearish bias. Support is now given at 96.57 (10/08/2013 low). A gradual rise towards the major resistance at 135.15 (01/02/2002 high) seems absolutely unlikely. Expected to decline further support at 93.79 (13/06/2013 low).
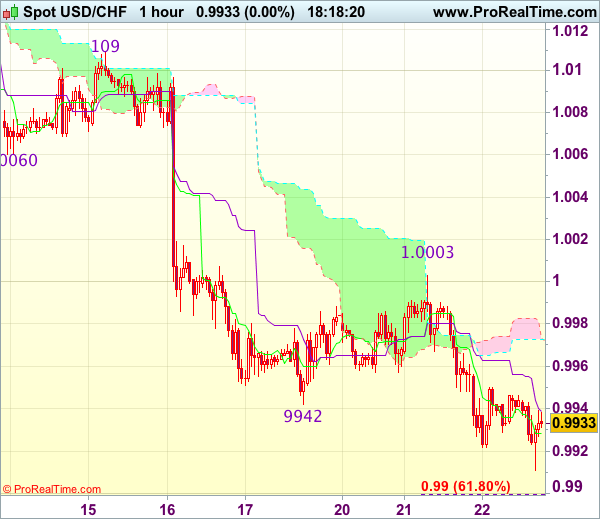
Trade Idea Update: USD/CHF – Sell at 1.0000
USD/CHF - 0.9930
Original strategy :
Sell at 1.0000, Target: 0.9900, Stop: 1.0035
Position : -
Target : -
Stop : -
New strategy :
Sell at 1.0000, Target: 0.9900, Stop: 1.0035
Position : -
Target : -
Stop : -
Yesterday’s selloff after meeting renewed selling interest at 1.0003 adds credence to our view that recent decline from 1.0171 is still in progress and may extend weakness to 0.9900 (61.8% projection of 1.0109-0.9942 measuring from 1.0003), however, loss of downward momentum should prevent sharp fall below 0.9870-75 and reckon 0.9850 would hold from here, risk from there has increased for a rebound later.
In view of this, would not chase this fall here and would be prudent to sell dollar on recovery as 1.0000-05 should limit upside and bring another decline. Only above previous support at 1.0060 (now resistance) would abort and signal low is formed instead, risk rebound to 1.0090-95 first.
Gold Spikes As Equities Tumble, RBNZ Meeting In Focus
News and Events:
NZD consolidates ahead of RBNZ meeting
The New Zealand dollar, like most commodity currencies, has performed relatively poorly over the last few days as it failed to attract investors' attention in spite of the broad based USD sell-off. The last RBNZ meeting drenched investors like a cold shower as Graeme Wheeler baffled investors with his surprisingly changed dovish tone on forward guidance. We can see how the RBNZ's decision could be viewed as confusing, especially against the backdrop of the improving inflationary outlook. However, we think that the central bank is betting on the Fed having to hike rates to control rising inflation pressures caused by the'Trumponomics' effect.
Unfortunately for the RBNZ, investors are currently unwinding the so-called reflation trade. In short, equities and the USD fell off a cliff yesterday and the trend is set to continue today. Against this backdrop, we would not be surprised if the Fed slows the pace of tightening and waits to see the actual effects of Trump's upcoming policy changes.
The RBNZ is holding its March meeting this evening and we do not expect Governor Wheeler to change his stance, neither to lift the OCR. The institution will however have to justify its dovish stance especially against the backdrop of mounting inflationary pressure. We favour long NZD positions, especially against the Australian dollar. NZD/USD has room for appreciation, even though the risk-off sentiment will limit risk appetite.
Trump Presidency to face serious litmus test
Is there really any language sweeter in an analyst's world than 'we told you so'?
The central theme expressed in our 2017 Market Outlook was that US President Trump would underperform expectations, unable to deliver the pro-growth, market driving policies he so fervently promised on the campaign trail. Yet, markets were too swept up in the hype of fiscal spending and tax reform to really examine the probability of success. Tomorrow's vote on the Obamacare repeal bill should be viewed as a defining moment for the inexperienced Trump presidency. With Republicans currently holding 237 to 193 majority in the House and 52 to 48 majority in the Senate, the inability to pass his hallmark legislation will be a massive political blow (especially following the debacle of his executive order travel ban). Polling indicates a tight vote, forcing Trump himself to make the round to drum up support for the bill. Trump has stated healthcare as a first priority followed by his proposed tax reform, so a defeat will only push strong pro-growth policy further from the market's reach. US cyclical and financial stocks have already come under significant pressure as optimism evaporates, pushing the global equity market broadly lower. Commodities (metals and energy) with the exception of precision metals are falling as the pace of US economic acceleration is being brought into question. A rejected bill will further zap risk-taking sentiment from investors, sending US yields and stocks lower. However, we doubt the current pullback will spiral into a full-blown correction. First, US economic data remains healthy, led by consumer and business optimism (however not accelerating to the point where the Fed needs to slam on the brakes). Second, should faith in Trump's ability to swiftly move forward on tax reform and other pro-growth policy, expectations for Fed hikes will reduce, likely triggering a resumption of risk-taking behavior. Interestingly, the market's reaction to hawkish comments by George and Mester was to largely ignore. In the current environment with rising global demand, accommodating monetary policy and low volatility we continue to advocate selling USD and rotating in higher yielding EM currencies. In the US, existing homes sales will provide a clear area where US optimism is translating into hard data (followed by Friday's durable goods orders).
Gold spikes one week after Fed rate hike
Curiously, gold is surging a week following the Fed's rate hike, flying in the face of the conventional way of thinking that the commodity should normally take a hit on the back of increased rates. Last week, the metal was struggling and took a hit but this week, it is largely recovering. Why?
It is clear to us that markets were overly optimistic about Trump's election and almost naive concerning the promised massive fiscal and spending plan. Now markets fears have come flooding back with no one really knowing what the outcome of Trump's presidency will truly be. The stock market has even begun to correct with the S&P losing almost 30 points, dropping to 2344 yesterday as the Trump administration desperately scrambles to pull together a plan to deliver its program.
Interestingly, though interest rates remain very low in the US, this is a trend we are seeing the world over. This is likely because markets are holding out for more insight on Trump's next moves before selling back their gold. If this is the case, then gold's rise is far from over.
Today's Key Issues (time in GMT):
- Jan Leading Indicator, last 96,3, rev 96,2 ZAR / 07:00
- Jan Unemployment Rate AKU, exp 4,50%, last 4,40% NOK / 07:00
- Feb Retail Sales MoM, last 0,20% DKK / 08:00
- Feb Retail Sales YoY, last -1,30% DKK / 08:00
- Feb CPI YoY, exp 6,30%, last 6,60% ZAR / 08:00
- Feb CPI Core MoM, exp 1,20%, last 0,30% ZAR / 08:00
- Feb CPI Core YoY, exp 5,40%, last 5,50% ZAR / 08:00
- Feb CPI MoM, exp 1,20%, last 0,60% ZAR / 08:00
- 4Q Current Account as a % GDP, exp -3,20%, last -4,10%, rev -3,80% ZAR / 08:00
- 4Q Current Account Balance, exp -147b, last -176b, rev -166b ZAR / 08:00
- ECB's Villeroy Speaks in Frankfurt EUR / 08:30
- Jan Current Account NSA, last 47.0b, rev 46.9b EUR / 09:00
- Jan ECB Current Account SA, last 31.0b, rev 30.8b EUR / 09:00
- Jan Current Account Balance, last 5535m EUR / 09:30
- mars.17 MBA Mortgage Applications, last 3,10% USD / 11:00
- ECB's Lautenschlaeger speaks in Frankfurt EUR / 11:30
- Mar IBGE Inflation IPCA-15 MoM, exp 0,14%, last 0,54% BRL / 12:00
- Mar IBGE Inflation IPCA-15 YoY, exp 4,73%, last 5,02% BRL / 12:00
- mars.20 CPI WoW, last 0,10% RUB / 13:00
- mars.20 CPI Weekly YTD, last 0,90% RUB / 13:00
- Jan FHFA House Price Index MoM, exp 0,40%, last 0,40% USD / 13:00
- Feb Existing Home Sales, exp 5.55m, last 5.69m USD / 14:00
- Feb Existing Home Sales MoM, exp -2,50%, last 3,30% USD / 14:00
- mars.17 DOE U.S. Crude Oil Inventories, exp 3000k, last -237k USD / 14:30
- mars.17 DOE Cushing OK Crude Inventory, exp 1100k, last 2130k USD / 14:30
- Currency Flows Weekly BRL / 15:30
- mars.23 RBNZ Official Cash Rate, exp 1,75%, last 1,75% NZD / 20:00
- 4Q BoP Current Account Balance, exp -$12.00b, last -$3.40b INR / 22:00
- Feb Tax Collections, exp 93000m, last 137392m BRL / 23:00
The Risk Today:
EUR/USD keeps on pushing higher, even though the pair is now pausing around 1.0800. A break of the upside channel would signal persistent buying pressures. Key resistance is given at a distance 1.0874 (08/12/2017 high). Strong support can be found at 1.0493 (22/02/2017 low). The technical structure suggests deeper increase towards resistance at 1.0874. In the longer term, the death cross late October indicated a further bearish bias. The pair has broken key support given at 1.0458 (16/03/2015 low). Key resistance holds at 1.1714 (24/08/2015 high). Expected to head towards parity.
GBP/USD has broken bearish downtrend channel. The pair has broken resistance at 1.2429 and there are rooms for further strength. Key resistance can be located at 1.2570 (24/02/2017 high). Hourly support is given at 1.2324 (03/17/2017 low). The long-term technical pattern is even more negative since the Brexit vote has paved the way for further decline. Long-term support given at 1.0520 (01/03/85) represents a decent target. Long-term resistance is given at 1.5018 (24/06/2015) and would indicate a long-term reversal in the negative trend. Yet, it is very unlikely at the moment.
USD/JPY has failed to break key resistance given at 115.62 (19/01/2016 high) confirming persistent selling pressure. The pair has broken strong support at 111.36 (28/11/2016 low). Hourly resistance can be located at 113.57 (16/03/2017 high). We favor a long-term bearish bias. Support is now given at 96.57 (10/08/2013 low). A gradual rise towards the major resistance at 135.15 (01/02/2002 high) seems absolutely unlikely. Expected to decline further support at 93.79 (13/06/2013 low).
USD/CHF is declining. Hourly support is given at 0.9862 (31/01/2017 low). Key resistance can be found at a distance at 1.0344 (15/12/2016 high). Expected to show continued weakness. In the long-term, the pair is still trading in range since 2011 despite some turmoil when the SNB unpegged the CHF. Key support can be found 0.8986 (30/01/2015 low). The technical structure favours nonetheless a long term bullish bias since the unpeg in January 2015.
| EURUSD | GBPUSD | USDCHF | USDJPY |
| 1.1300 | 1.3445 | 1.0652 | 121.69 |
| 1.0954 | 1.3121 | 1.0344 | 118.66 |
| 1.0874 | 1.2771 | 1.0171 | 115.62 |
| 1.0787 | 1.2469 | 0.9936 | 111.31 |
| 1.0454 | 1.1986 | 0.9862 | 106.57 |
| 1.0341 | 1.1841 | 0.9550 | 106.04 |
| 1.0000 | 1.0520 | 0.9444 | 101.20 |
Trade Idea Update: GBP/USD – Buy at 1.2400
GBP/USD - 1.2468
Original strategy :
Buy at 1.2400, Target: 1.2500, Stop: 1.2365
Position : -
Target : -
Stop : -
New strategy :
Buy at 1.2400, Target: 1.2500, Stop: 1.2365
Position : -
Target : -
Stop : -
As cable has continued trading with a firm undertone after yesterday’s rally above previous resistance at 1.2436, adding credence to our bullish view that the rise from 1.2109 has resumed and bullishness remains for further gain to 1.2500 (approx. 50% projection of 1.2109-1.2436 measuring from 1.2335), however, near term overbought condition should prevent sharp move beyond 1.2540-50 and price should falter below previous chart resistance at 1.2570, risk from there has increased for a retreat to take place later.
In view of this, would not chase this move from here and we are looking to buy cable on pullback as 1.2400-10 should limit downside. Below 1.2380-85 would defer and risk correction to 1.2350 but support at 1.2335 should remain intact.
Trade Idea Update: EUR/USD – Buy at 1.0725
EUR/USD - 1.0791
Original strategy :
Buy at 1.0725, Target: 1.0840, Stop: 1.0690
Position : -
Target : -
Stop : -
New strategy :
Buy at 1.0725, Target: 1.0840, Stop: 1.0690
Position : -
Target : -
Stop : -
As the single currency has maintained a firm bias after surging again yesterday, suggesting recent erratic upmove from 1.0493 low is still in progress and may extend further gain to previous chart resistance at 1.0829, however, loss of near term upward momentum should prevent sharp move beyond 1.0850-60 and price should falter well below 1.0890-00, risk from there has increased for a retreat to take place later.
In view of this, would not chase this rise here and we are looking to buy euro on subsequent pullback as 1.0706 support should limit downside and bring another rise later. Below 1.0675-80 would defer and suggest top is possibly formed, risk weakness to 1.0640 (previous resistance now support) but still reckon indicated support at 1.0600 would remain intact.
European Market Update: Risk Aversion Sentiment Spreads Into Europe, Trump Trade Fades
Risk aversion sentiment spreads into Europe, Trump trade fades
Notes/Observations
Risk aversion simmering over concerns President Trump’s legislative agenda facing headwinds; health bill struggles; could jeopardize goal of big tax cuts
North Korea said to have launched missile tests towards Japan; likely failed
Safe haven flow back in spotlight; spot gold at 3-week highs; Japanese yen currency firms
Overnight:
Asia:
North Korea may have launched several missiles on Wednesday morning from its eastern area of Wonsan; launch might have failed; Type of missiles involved was unknown
Bank of Japan (BOJ) releases Jan meeting minutes: BOJ members rejected bond yield target increase; rejected suggestions the central bank should raise its 10-year government bond yield target to match expected gains in Treasury yields. Reiterated view that CPI likely to reach 2% around FY18
Bank of Japan (BOJ) Gov Kuroda: Raising rates on excess reserves or lowering monetary base would be needed to exit QQE
BOJ Member Funo: Vital for BOJ to continue with powerful easing despite market speculation for rate hikes. Now is not the time to consider a shift in BoJ easy policy nor adjustment to bond yield target
Japan Feb Trade Balance saw its surplus hit a 10-month high with exports rising at its best pace in two years
Europe:
German Foreign Min Gabriel: Germany should send new message to EU that investment is more important than austerity
UK House of Lords committee report: Upmost importance for the UK to secure a preferable Free Trade Agreement (FTA) with the European Union for non-financial services
Americas:
Fed's Kaplan (moderate, voter): 2 more hikes this year was a "reasonable" base case, as long as labor market slack continued to decline and inflation continues to rise toward the Fed's 2-percent goal.
Fed's Rosengren (moderate, non-voter): run-up in US real estate prices could potentially amplify any future economic downturn; need to consider tools beyond interest rates that could help cool the sector
Fed's Mester (hawkish, non-voter): Built in more than 3 hikes into her forecast for 2017; Would be concerned if there were less than 3 hikes this year if data hold up.
Energy:
Weekly API Oil Inventories: Crude: +4.5M v -0.5M prior (7th build in the past 9 weeks)
Economic Data
(JP) Japan Feb Nationwide Dept Sales Y/Y: -1.7% v -1.2% prior; Tokyo Dep Store Sales Y/Y: -3.1% v -1.5% prior
(ZA) South Africa Feb CPI M/M: 1.1% v 1.2%e; Y/Y: 6.3% v 6.3%e
(ZA) South Africa Feb CPI Core M/M: 1.1% v 1.2%e; Y/Y: 5.2% v 5.5%e
(ZA) South Africa Q4 Current Account (ZAR): -76B v -147Be; Current Account to GDP Ratio: -1.7% v -3.2%e
(EU) Euro Zone Jan Current Account (Seasonally Adj): €24.1B v €31.0B prior; Current Account NSA (unadj): €2.5B v €47.0B prior
Fixed Income Issuance:
(IN) India sold total INR100B vs. INR100B indicated in 3-month and 6-month Bills
(ZA) South Africa sold total ZAR2.35B vs. ZAR2.35B indicated in 2037, 2041 and 2044 bonds
(DK) Denmark sold total DKK1.11B in 2027 and 2039 Bonds
SPEAKERS/FIXED INCOME/FX/COMMODITIES/ERRATUM
Index snapshot (as of 09:30 GMT)
Indices [Stoxx50 -0.7% at 3,402, FTSE -0.9% at 7,309, DAX -0.8% at 11,866, CAC-40 -0.9% at 4,957, IBEX-35 -0.9% at 10,119, FTSE MIB -1.0% at 19,719, SMI -0.9% at 8,534, S&P 500 Futures -0.2%]
Market Focal Points/Key Themes: European equity indices are trading sharply lower as the Health Care bill faces stiff opposition ahead of Thursday House vote; Market participants also jittery on political developments in France ahead of the highly-anticipated presidential election scheduled next month; Banking stocks generally lower across Europe with losses in the Eurostoxx led by shares of ING Groep after reports circulated that the company is under investigation by Dutch authorities for money laundering, international corruption; shares of Kingfisher leading the losses seen in the FTSE 100 after releasing FY16 results; Energy, commodity and mining stocks trading notably lower as oil and copper prices trade lower intraday.
Upcoming scheduled US earnings (pre-market) include Actuant, Amaya, EVINE Live, Acushnet, Perry Ellis, PetroChina, and Winnebago Industries.
Equities (as of 09:25 GMT)
Consumer Discretionary: [Kingfisher KGF.UK -5.2% (FY16 results, Chairman to step down), Hermes RMS.FR -1.2% (FY16 results)]
Financials: [ING Groep INGA.NL -5.0% (reportedly under investigation by Dutch authorities for money laundering, international corruption), Savills SVS.UK -1.8% (FY16 results)]
Healthcare: [Novartis NOVN.CH -1.8% (Phase III RELAX-AHF-2 study did not meet primary endpoints)]
Industrials: [Clarkson CKN.NL -4.5% (confirms secondary placing at £27.50/shr), Groupe Gorge GOE.FR -1.0% (FY16 results), Jenoptik JEN.DE -2.8% (outlook, raises div), Kuka KU2.DE -2.9% (final FY16 results), Lenzing LNZ.AT +0.3% (FY16 results), Meyer Burger MBTN.CH -2.4% (FY16 results)]
Materials: [Akzo Nobel AKZA.NL -3.3% (Rejects second proposal from PPG)]
Technology: [Gemalto GTO.NL -21.2% (cuts outlook), Suess MicroTec SMHN.DE +1.1% (Q1 outlook)]
Speakers
ECB’s Villeroy (France) stated that ECB was clearly progressing towards its inflation target and confident that headline and core inflation would converge and be close to target in 2019. Reiterated ECB view that accommodative policy was still needed; not the time to stop stimulating the economy; debate was not predetermined
Sweden Central Bank (Riksbank) reiterated that expansionary monetary policy was having the intended effect; domestic economy was developing well. Inflation had risen to be close to target and long-term inflation expectations are back around 2%
BOE Q1 Agents Summary of Business Conditions: Reiterates inflation is edging higher due to weaker GBP currency(Pound Sterling)
BOJ Gov Kuroda was in his Parliament and informed G20 that BOJ would continue with its powerful easing in order to achieve its 2% inflation target
Bank of Korea (BOK) Suh Bong-gook: Many factors that support a strong USD. Talks on currency manipulation might lead to won appreciation, but KRW currency (won) movement was mostly affected by the level of dollar
Currencies
Risk aversion provided another headwind for the USD as US Treasury yields moved sharply lower over the past day thus eroding the greenback's interest rate allure. safe-havens flows (yen and gold) were the main beneficiaries
USD/JPY was lower for the 6th straight session and near 4-month lows over concerns President Trump would struggle to deliver promised tax cuts that propelled the the greenback since his Nov victory. North Korea said to have launched missile tests towards Japan in a failed test that added to the cautious sentiment. Pair probing the lower end of the 111 handle
EUR/USD softer as the yen component was the driver in price action. Pair at 1.0780, lower by approx 0.2% just ahead of the NY morning.
Fixed Income:
Bund futures trade at 160.17 up 61 ticks continuing its rebound higher on risk aversion flows on weaker European Equity trade. Resistance moves to 160.45 followed by 160.66. Support moves to 159.41 followed by 159.12 then contract low of 158.73.
Gilt futures trade at 126.55 up 55 ticks reversing yesterdays Inflation inspired losses, on steep losses in US and Asian Stocks overnight. Support moves to 125.80 followed by 125.24. Resistance moves to 126.75, 126.87 followed by 127.35. Short Sterling futures trade flat to up 1bp with Jun17Jun18 spread flattening to 20/21Bp flattening some 3bp from yesterday's peak.
Wednesday's liquidity report showed Tuesday's excess liquidity fell to €1.322T a fall of €15B from €1.337T prior. Use of the marginal lending facility fell to €117M from €176M prior.
Corporate issuance saw $10.95B come to market via 9 issuers headlined by ING $4B 3 part offering and Medtronic $2B 3 part offering. Issuance for the week now stands at $16.6B.
Looking Ahead
(IL) Israel Feb Leading 'S' Indicator M/M: No est v 0.2% prior
05:50 (EU) ECB allotment in 7-day USD Liquidity Tender
06:00 (EU) Daily Euribor Fixing
06:30 (UK) DMO to sell £2.0B in 1.5% 2047 Gilts
06:30 (DE) Germany to sell €3.0B in 0.25% Feb 2027 Bunds
06:30 (FR) ECB’s Villeroy (France)
07:00 (US) MBA Mortgage Applications w/e Mar 17th: No est v 3.1% prior
07:00 (IE) Ireland Feb PPI M/M: No est v 0.2% prior; Y/Y: No est v 1.6% prior
07:00 (RU) Russia to sell combined RUB40B in 2019 and 2026 OFZ bonds
07:00 (CZ) Czech Republic to sell 2020 and 2027 bonds
07:30 (CL) Chile Central Bank's Traders Survey
07:30 (EU) ECB's Lautenschlaeger (Germany)
07:45 (US) Daily Libor Fixing
08:00 (BR) Brazil Mid-Mar IBGE Inflation IPCA-15 M/M: 0.2%e v 0.5% prior; Y/Y: 4.7%e v 5.0% prior
08:00 (UK) PM May weekly question time in House of Commons
09:00 (US) Jan FHFA House Price Index M/M: 0.4%e v 0.4% prior
09:15 (UK) Baltic Dry Bulk Index
10:00 (US) Feb Existing Home Sales: 5.56Me v 5.69M prior
10:30 (US) Weekly DOE Crude Oil Inventories
11:00 (CA) Bank of Canada (BOC) Dep Gov Schembri speech
16:00 (NZ) New Zealand Central Bank (RBNZ) Interest Rate Decision: Expected to leave Official Cash Rate unchanged at 1.75%
Trade Idea Update: USD/JPY – Stand aside
USD/JPY - 111.25
New strategy :
Stand aside
Position : -
Target : -
Stop : -
Although the greenback has remained under pressure after yesterday’s selloff and near term downside risk remains for recent decline from 115.51 to extend further weakness to 111.00, loss of near term downward momentum should prevent sharp fall below 110.85 (61.8% projection of 115.51-112.26 measuring from 112.87) and reckon 110.50 would hold from here, risk from there is seen for a rebound to take place later.
In view of this, would not chase this fall here and would be prudent to stand aside in the meantime. Above 111.70-75 would bring test of the Kijun-Sen (now at 111.96) but a break of previous support at 112.26 is needed to signal low is formed instead.
EUR/CAD Elliott Wave Analysis
EUR/CAD – 1.4451
EUR/CAD: Wave 4 ended at 1.4380 and wave 5 as well as circle wave C has possibly ended at 1.2129, major (A)-(B)-(C) correction has commenced and indicated target at 1.6000 had been met.
As the single currency has rebounded again after finding support at 1.4242, suggesting a retest of recent high at 1.4418 would be seen, break there would add credence to our view that recent fall from 1.5282 has ended, bring at least a strong retracement of this decline to 1.4530-35 (50% Fibonacci retracement of 1.5282-1.3784), however, near term overbought condition should limit upside to 1.4600-10 and price should falter well below 1.4710 (61.8% Fibonacci retracement), risk from there is seen for a retreat later.
Our latest preferred count is that larger degree wave [C] from 1.3289 as well as circle wave B ended at 1.7509 in Dec 2008 with (A): 1.6325, (B): 1.4719 followed by wave (C) at 1.7509, hence circle wave C is unfolding with wave 1 ended at 1.5186 (diagonal wave 1), wave 2 at 1.6096, impulsive wave 3 has ended at 1.2451, followed by wave 4 at 1.4380, in view of recent strong rebound, we are now treating the wave 5 as well as larger degree circle wave C has ended at 1.2129, hence (A)-(B)-(C) correction has commenced from there with impulsive wave (C) now unfolding and indicated initial upside target at 1.6000 had been met and reckon 1.6500 would hold.
On the downside, expect pullback to be limited to 1.4300-10 and said support at 1.4242 should hold, bring another rise later. A daily close below said support at 1.4242 would defer and risk correction to 1.4200 and possibly towards 1.4155-60 but reckon downside would be limited to 1.4100, the single currency may stage another rally from there probably in Q2.
Recommendation: Buy at 1.4300 for 1.4500 with stop below 1.4200.
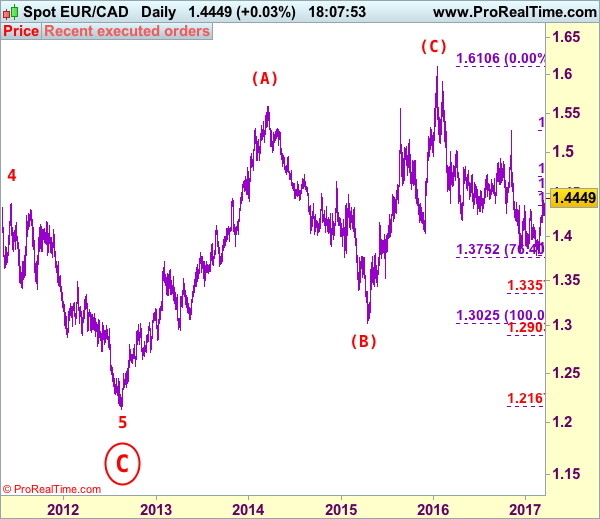
On the bigger picture, our long-term count on the monthly chart is that a big sideways consolidation from 2000 low of 1.2557 has possibly ended at 1.7509 as circle wave B with [A]: 1.6976 ( (A): 1.4513, (B): 1.2612, (C): 1.6976), wave [B]: 1.3289 is a double three with 1st a-b-c: 1.5384, x: 1.6709 and 2nd a-b-c: 1.3289. As indicated above, the wave [C] has ended at 1.7509. The selloff from there is now unfolding which itself should be labeled as an impulsive wave with wave 1: 1.5186 (diagonal wave 1), followed by wave 2: 1.6096 and wave 3: 1.2451, wave 4: 1.4380, wave 5 as well as larger degree circle wave C has possibly ended at 1.2129 and major correction has possibly commenced for retracement of recent decline towards 1.4000, then 1.4180-90 (38.2% Fibonacci retracement of 1.7509-1.2129). Below said support at 1.2129 would risk weakness to psychological support at 1.2000 and then 1.1851 (50% projection of 1.7509-1.2451 measuring from 1.4380) but reckon 1.1500 would remain intact, bring reversal later.

AUD/USD Elliott Wave Analysis
AUD/USD – 0.7660
AUD/USD – Wave 5 of C and (B) has possibly ended at 1.1081
Aussie found decent demand at 0.7491 and has rallied above indicated resistance at 0.7741, suggesting recent rise from 0.7158 is still in progress and may bring retest of previous chart resistance at 0.7778 but break there is needed to retain bullishness and signal another leg of major corrective upmove from 0.6827 low is underway for headway to 0.7835 resistance first, then 0.7900, however, psychological resistance at 0.8000 should hold from here.
We are keeping our count that top has been formed at 1.1081 (wave 5 of V) and major correction (A-B-C-X-A-B-C) has commenced, indicated downside targets at 0.7945 (61.8% Fibonacci retracement of entire rise from 0.6007-1.1081) and 0.7750 had been met and downside bias is seen for further weakness to 0.6800, then 0.6700 but reckon 0.6500 would hold from here.
Our preferred count is that the rally from 0.6007 to 0.7270 (7 Jan 2009) is marked as wave A, the retreat to 0.6248 (2 Feb 2009) is wave B and the subsequent upmove is labeled as wave C with wave (iii) and wave (iv) ended at 0.8265 and 0.7700 respectively and wave (v) as well as 3 ended at 0.9407, then wave 4 ended at 0.8066 (instead of 0.8578). The wave 5 has met our indicated projection target of 1.1060 and could ended at 1.1081, this level is now treated as the peak of wave (C) as well as larger degree wave B, hence major fall in wave C has commenced, our initial downside target at psychological support at 0.7000 has just been met and further weakness to 0.6500 would be seen later.
On the downside, whilst pullback to 0.7665-70 cannot be ruled out, reckon downside would be limited to 0.7630-40 and bring another rise later to aforesaid upside targets. Below previous resistance at 0.7592 would defer and suggest top is formed instead, risk weakness to 0.7540-50 but said support at 0.7491 should remain intact, bring rebound later.
Recommendation: Buy at 0.7600 for 0.7800 with stop below 0.7500
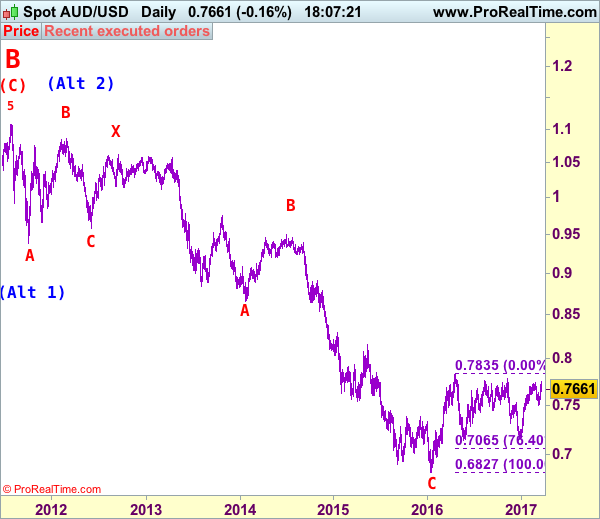
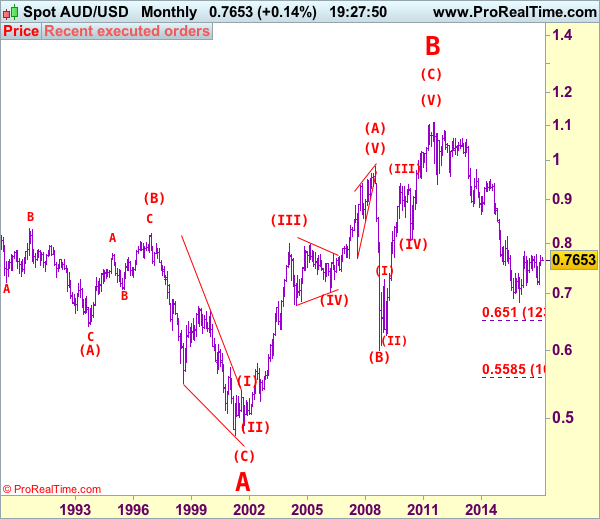
Our alternate count on the daily chart treated the top formed in 2008 at 0.9851 could be a larger degree wave I and was followed by a deep and sharp correction in wave II to 0.6007 and wave III is unfolding from there.
The long-term uptrend started from 0.4775 (2 Apr 2001) with an impulsive structure. Wave I is labeled as 0.4775 to 0.9851 (15 Jul 2008), wave II has ended at 0.6007 (Oct 2008) and wave III is still in progress which may extend further gain to 1.1265.
Forex Technical Analysis
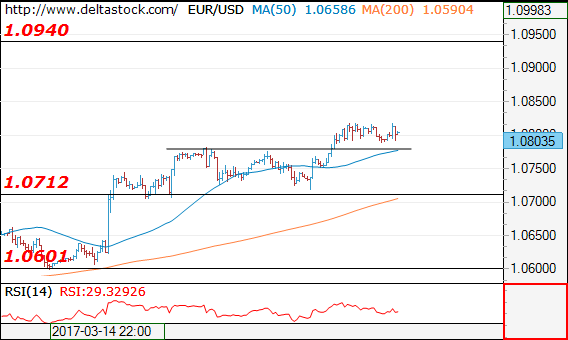
EUR/USD
Current level - 10803
The overall bias remains positive above 1.0780, for a break through 1.0828, towards 1.0940 area. Crucial on the downside is 1.0712 support.
| Resistance | Support | ||
| intraday | intraweek | intraday | intraweek |
| 1.0828 | 1.0870 | 1.0712 | 1.0600 |
| 1.0870 | 1.0945 | 1.0600 | 1.0490 |
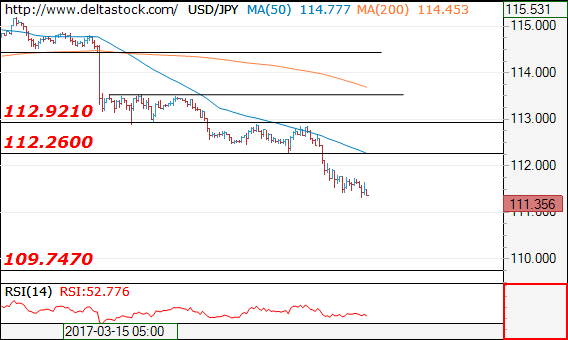
USD/JPY
Current level - 111.35
The downtrend is intact, heading towards 109.75 support area. Key resistance lies at 112.26.
| Resistance | Support | ||
| intraday | intraweek | intraday | intraweek |
| 112.26 | 113.50 | 111.00 | 109.75 |
| 112.90 | 115.65 | 109.75 | 107.80 |
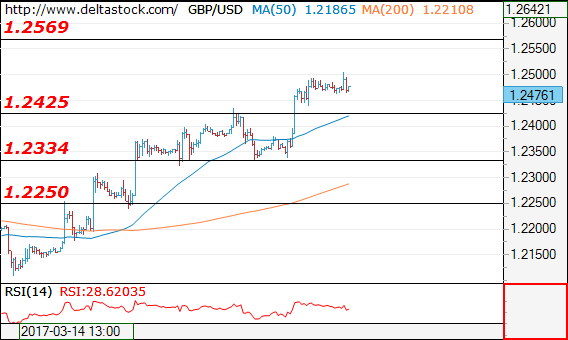
GBP/USD
Current level - 1.2476
The outlook is positive above 1.2425 support, for a rise towards 1.2570 area. Crucial on the downside is 1.2335 low.
| Resistance | Support | ||
| intraday | intraweek | intraday | intraweek |
| 1.2500 | 1.2570 | 1.2425 | 1.2107 |
| 1.2570 | 1.2705 | 1.2335 | 1.1984 |