Sample Category Title
GBPUSD – Bullish, Targeting Further Upside Pressure
GBPUSD - The pair remains on the offensive leaving risk higher in the days ahead. Support lies at the 1.2350 level where a break will turn attention to the 1.2300 level. Further down, support lies at the 1.2250 level. Below here will set the stage for more weakness towards the 1.2200 level. Conversely, resistance stands at the 1.2450 levels with a turn above here allowing more strength to build up towards the 1.2500 level. Further out, resistance resides at the 1.2550 level followed by the 1.2600 level. On the whole, GBPUSD continues to face upside pressure.
Elliott Wave Trade Ideas Performance Update
Two long positions were entered in EUR/JPY last week, the first one entered at 121.80 was quickly exited around break-even, we then entered another long position at 121.30 and the position is still holding at the moment.
No position was entered in other currency pairs last week.
In short, 2 positions were entered last week with total profit of 5 points and the positions are listed below.
15 Mar: EUR/JPY - Long at 121.80, exited at 121.85 (+ 5 points)
17 Mar: EUR/JPY - Lobg at 121.30,
| AUD EUR/JPY EUR/GBP CAD
Jan - 15 -275 - 35 -120
Feb + 140 -17 - 40 +11
Mar + 20 +165
Apr
May
Jun
Jul
Aug
Sep
Oct
Nov
Dec
Y-T-D + 145 - 127 - 75 + 57
Ellliott Wave Analysis: Crude Oil Pointing Higher
Crude oil is making nice bounce from our support area at 48.00 where energy might already completed an a-b-c structure. It is a corrective pattern that is pointing higher now, back to 49.58, especially if price will close outside of a downward channel.
Crude OIL, 1H
Candlesticks and Ichimoku Trade Ideas Performance Update
The long positions entered in cable at 1.2215 in the previous week was stopped at 1.2180 and although sterling extended weakness to 1.2109, decent demand emerged there and the British pound finally staged the anticipated rally from there to even above 1.2400 level late last week.
Another long position was entered in EUR/USD at 1.0640, however, the retreat from 1.0713 was just a bit deeper than expected, the position was stopped at 1.0610 before the single currency finding renewed buying interest and rallied as suggested to as high as 1.0782 on Friday.
In short, 2 positions were entered among all 4 currency pairs with total loss of 65 points and the positions are listed below:
13 Mar: GBP/USD - Long at 1.2215, exited at 1.2180 (- 35 points)
14 Mar: EUR/USD - Long at 1.0640, exited at 1.0610 (- 30 points)
| JPY EUR CHF GBP
Jan + 167 - 85 - 10 + 50
Feb + 200 +150 +93 - 59
Mar -8 -35 0 - 35
Apr
May
Jun
Jul
Aug
Sep
Oct
Nov
Dec
Y-T-D + 359 + 25 +83 -44
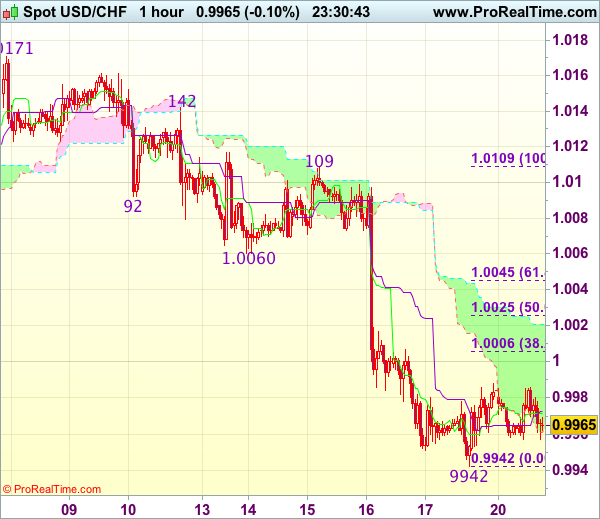
Trade Idea Wrap-up: USD/CHF – Sell at 1.0020
USD/CHF - 0.9963
Most recent candlesticks pattern : N/A
Trend : Near term down
Tenkan-Sen level : 0.9972
Kijun-Sen level : 0.9973
Ichimoku cloud top : 1.0021
Ichimoku cloud bottom : 0.9961
Original strategy :
Sell at 1.0020, Target: 0.9920, Stop: 1.0055
Position : -
Target : -
Stop : -
New strategy :
Sell at 1.0020, Target: 0.9920, Stop: 1.0055
Position : -
Target : -
Stop : -
As the greenback has rebounded after finding support at 0.9942 on Friday, suggesting consolidation above this level would be seen and corrective bounce to 1.0005-10 (38.2% Fibonacci retracement of 1.0109-0.9942) cannot be ruled out, however, reckon upside would be limited to 1.0025 (50% Fibonacci retracement) and bring another decline later. Below said support at 0.9942 would extend recent decline from 1.0171 to 0.9920-25 but loss of near term downward momentum should prevent sharp fall below 0.9900 and reckon 0.9870-75 would hold from here.
In view of this, would not chase this fall here and would be prudent to sell dollar on recovery as 1.0021 (current level of the upper Kumo) should limit upside and bring another decline. Only above previous support at 1.0060 (now resistance) would abort and signal low is formed instead, risk rebound to 1.0090-95 first.
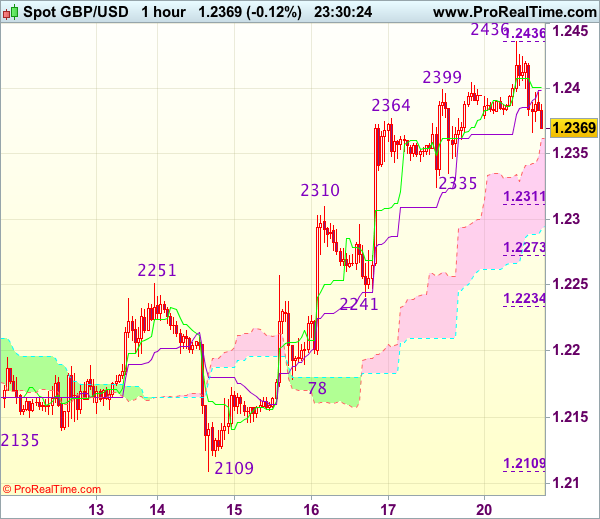
Trade Idea Wrap-up: GBP/USD – Buy at 1.2310
GBP/USD - 1.2372
Most recent candlesticks pattern : N/A
Trend : Near term up
Tenkan-Sen level : 1.2401
Kijun-Sen level : 1.2399
Ichimoku cloud top : 1.2362
Ichimoku cloud bottom : 1.2292
Original strategy :
Buy at 1.2310, Target: 1.2435, Stop: 1.2275
Position : -
Target : -
Stop : -
New strategy :
Buy at 1.2310, Target: 1.2435, Stop: 1.2275
Position : -
Target : -
Stop : -
As cable has retreated after intra-day brief rise to 1.2436, suggesting consolidation below this level would be seen and pullback to support at 1.2335 cannot be ruled out, however, reckon downside would be limited to 1.2310 (previous resistance now support) and bring another rise later, above said resistance at 1.2436 would extend recent upmove from 1.2109 (this month’s low) to 1.2450 but loss of near term momentum should prevent sharp move beyond previous resistance at 1.2479, risk from there has increased for a retreat to take place later.
In view of this, would not chase this move from here and we are looking to buy cable on pullback as said previous resistance at 1.2310 should limit downside and bring another rise. Below 1.2270-75 (50% Fibonacci retracement of 1.2109-1.2436) would defer and suggest top is possibly formed, risk correction to 1.2241 support.
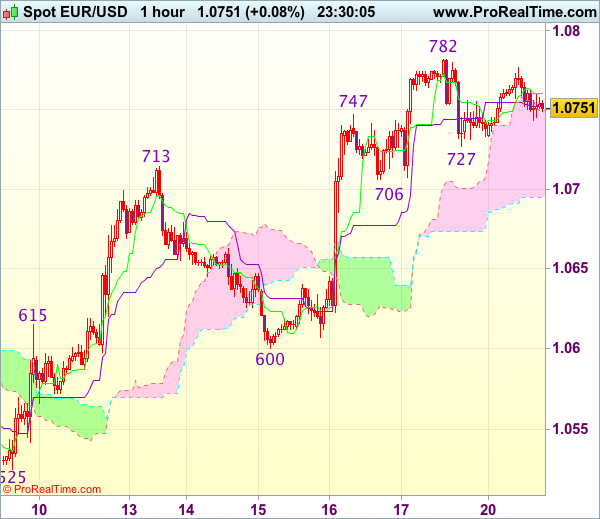
Trade Idea Wrap-up: EUR/USD – Buy at 1.0700
EUR/USD - 1.0749
Most recent candlesticks pattern : N/A
Trend : Near term up
Tenkan-Sen level : 1.0760
Kijun-Sen level : 1.0754
Ichimoku cloud top : 1.0750
Ichimoku cloud bottom : 1.0695
Original strategy :
Buy at 1.0700, Target: 1.0800, Stop: 1.0665
Position : -
Target : -
Stop : -
New strategy :
Buy at 1.0700, Target: 1.0800, Stop: 1.0665
Position : -
Target : -
Stop : -
As the single currency has maintained a firm undertone after last week’s rally, suggesting recent erratic upmove from 1.0493 low is still in progress and may extend further gain towards previous chart resistance at 1.0829, however, loss of near term upward momentum should prevent sharp move beyond 1.0850-60 and price should falter well below 1.0890-00, risk from there has increased for a retreat to take place later.
In view of this, would not chase this rise here and we are looking to buy euro on subsequent pullback as 1.0706 support should limit downside and bring another rise later. Below 1.0675-80 would defer and suggest top is possibly formed, risk weakness to 1.0640 (previous resistance now support) but still reckon indicated support at 1.0600 would remain intact.
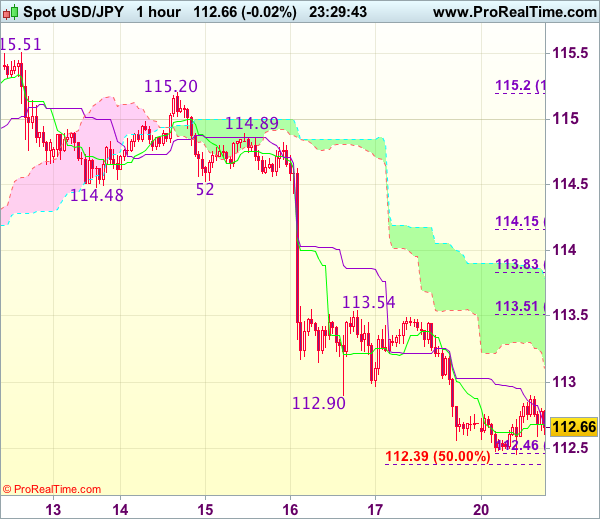
Trade Idea Wrap-up: USD/JPY – Sell at 113.50
USD/JPY - 112.68
Most recent candlesticks pattern : N/A
Trend : Near term down
Tenkan-Sen level : 112.68
Kijun-Sen level : 112.68
Ichimoku cloud top : 113.78
Ichimoku cloud bottom : 113.11
Original strategy :
Sell at 113.50, Target: 112.40, Stop: 113.85
Position : -
Target : -
Stop : -
New strategy :
Sell at 113.50, Target: 112.40, Stop: 113.85
Position : -
Target : -
Stop : -
As the greenback has recovered after marginal fall to 112.46, suggesting minor consolidation above this level would be seen and corrective bounce to the lower Kumo (now at 113.11) cannot be ruled out, however, reckon 113.51-54 (38.2% Fibonacci retracement of 115.20-112.46 and previous resistance) would limit upside and bring another decline later. Below said support at 112.46 would extend weakness to 112.35-39 (50% projection of 115.20-112.90 measuring from 113.54), then 112.10-15 (61.8% projection) but loss of downward momentum should prevent sharp fall below previous support at 111.69, risk from there has increased for a rebound to take place later.
In view of this, would not chase this fall here and would be prudent to sell dollar on subsequent recovery as said resistance at 113.54 should limit upside, bring another decline later. Only above the upper Kumo (now at 113.78) would abort and signal low is formed instead, bring rebound to 114.20-25 later.
Dollar Correction Slows in Uneventful Trading Session
Headlines
US equities opened little changed, as the calendar gave little incentives to traders to take positions. European equities trade with minor losses in an uneventful session.
Chicago Fed Evans defended last week's rate hike and expects two more hikes this year. He added the economy was on a pretty good course, labour market has been strong and the Fed is a little more confident inflation is moving up. Fiscal policy could provide an important lift to inflation.
Philly Fed governor Harker would not rule out a faster or slower pace of hikes in 2017 than three that he's projected in his quarterly forecast, but he hasn't yet factored in fiscal policy. He expects balance tapering to start when rates are between 1% and 1.5%.
The ECB has urged Brussels to toughen up its sanctions procedure against governments who persistently fall foul of its economic rules. It noted that over 90% of reform recommendations had been ignored by member states in 2016.
UK PM May will file divorce papers to leave the European Union on March 29, launching two years of complex negotiations that will pit the U.K.'s need for a trade deal against the bloc's view that Britain shouldn't benefit from Brexit.
Oil prices slipped as the US trading day revved - up, with analysts focused on the sharp rise this year in American crude inventories. WTI, the US benchmark, declined 1.4% to $48.12/barrel, while Brent crude dipped 0.9% to $51.3/barrel.
Rates
Bonds lingering in sideways range
In a thinly traded, data - poor and sentiment - driven session, core bonds traded sideways with German Bunds again slightly underperforming US Treasuries. At the time of writing, US yields trade nearly unchanged for the day (yield changes ranged between - 1.1 (2 - yr) and - 0.2 bp (30 - yr)), while German yields are slightly higher (yield changes between 1.1 bp (2 - yr) and +1.4 bps (30 - yr)). On intra EMU bond markets, 10 - yr yield spreads versus Germany range between +2 bps (Belgium, see below) and - 2 bps (Spain) with outperformance of Portugal ( - 4 bps, due to S&P decision to confirm rating?) and underperformance of Greece (+7 bps due to upcoming euro group?).
Intraday, the Bund opened marginally higher. A slight Asian risk off sentiment due to a disappointing G - 20 meeting suggested spill overs of the negative sentiment. However, those spill - overs didn't materialise. Equities opened lower but stabilized soon. Oil initially also held up well. The bond bears took the drivers' seat and the Bund slid gradual lower till the end of the morning session, ignoring another selling wave of oil (which largely reversed in early afternoon). The German curve slightly bear steepened. The Belgian and Slovak bond auctions went well, but as usually didn't affect the overall market. US Treasuries did nothing worth mentioning in the European morning trade and in early US dealings. Fed speakers' comments were also unable to trigger action.
Chicago Fed Evans, 2017 voter, said the Fed is on pace for two more rate hikes in 2017. He added the economy was on a pretty good course, labour market has been strong and the Fed is a little more confident inflation is moving up. Fiscal policy could provide an important lift to inflation, according to Evans. Minneapolis Kaskhari, in an interview, largely repeated his arguments why he dissented at last week's FOMC meeting. Most important, he wants to taper the balance sheet before raising rates. Philly Fed Harker, 2017 FOMC voter, defended last week's rate hike and said he can't rule out more than 3 rate hikes this year, but at the March dot - plot he put 3 dots. Confidence has to translate into action. He added that the Fed hasn't factored in fiscal policy as details are needed.
The Belgian Debt Agency sold €3.2B of its 2027, 2038 and 2041 OLO's. Average yields amounted to 0.933%, 1.591% and 1.64% respectively. Despite its expensiveness versus peers like France, Ireland and Slovakia, the auction went well and the maximum targeted amount was sold. Interestingly, the appetite of investors for the longer 2038 and 2041 OLO's (€1.6B) was very good. The good interest in the new benchmark 10 - year was less of a surprise. The bid/covers of 1.62 and 1.6 for the long maturities was strong given the amounts sold. Given the thinness of the market today, there was some minor price concession in the aftermath of the auction. Slovakia attracted also strong demand for its 0% 2023 and 3.375% 2027 bond auction. It sold €285.4 M of both bonds with bid/covers of 3.75 and 2.84..

Currencies
Dollar correction slows in uneventful trading session
Today, in technical trading deprived of any important news, the post - Fed setback of the dollar petered out. However, it's too early to conclude that a sustained bottoming has started. EUR/USD is changing hands in the 1.0750 area. USD/JPY trades around 112.60/65.
Overnight, Asian equities traded with a slight risk - off bias. This was at least partially due to investors disappointment as the G20 communiqué didn't say anymore that the group intends to avoid all forms of protectionism. USD/JPY remained under pressure from ongoing overall USD weakness and traded in the 112.60 area, near the lowest level this month. EUR/USD hovered in the 1.0765 area, within reach of the post - Fed top (1.0782).
Trading on European markets, including FX trading, showed very little dynamics. There were no market moving data. The 'usual links' between markets were again very loose. European equities opened in negative territory, but there were limited follow - through losses. Core European yields rose minimal and the interest rate differential between US and German bonds narrowed marginally. However, there were no additional USD losses. USD/JPY even 'rebounded' off the post - Fed low and returned to the 112.80 area. EUR/USD reversed a strong open and drifted back to the 1.0750/65 area.
There was still no high profile news at the start of the US trading session. US equities also opened marginally lower, capping any further USD gains. Fed governors Evans, Kashkari and Harker gave divergent signals. EUR/USD trades currently at 1.0750/55. USD/JPY is changing hands around 112.70/75. So, the dollar didn't lose further ground after last week's post - Fed correction. However, with no news and given the narrow range of today price action, it's too early to draw any firm conclusions.

Sterling losing a few ticks on Brexit announcement
Overnight, the Rightmove House prices were decent at 1.3% M/M and 2.3% Y/Y. Sterling trading was in the first place driven by technical considerations. Even so, the housing report maybe supported the cautiously positive momentum of sterling at the start of the European session. Sterling gained a few ticks against the euro and the dollar, but trading was confined to tight ranges. Around noon, a spokesman of UK PM May announced that the UK will trigger article 50 of the Lisbon treaty on March 29. The move was no surprise. Even so, sterling reversed the intraday gains against the euro and the dollar as investors realize that a period of heightened political uncertainty might be on the horizon. EUR/GBP trades currently in the 0.8680 area. Cable is again changing hands just below 1.24.

EUR/USD Bullish Switch on Short Term Trend
The US is on track for 3 hikes this year, and a few more in following years, but there were mentions during previous week that the ECB too may shift to normalising rates also in due time, so at this point we see a possible change in direction on this pair. The POC zone 1.0725-40 (L3, trend line, EMA 89, ATR pivot 23.6) and if 1.0670 stays strong we might see 1.0800 and 1.0840. The uptrend has been established by strong momentum candle (highlighted in green) and it seems we might see a continuation. Watch for any rejections from POC and break of 1.0780 if it happens short term.