Sample Category Title
Dollar Correction Slows in Uneventful Trading Session
Headlines
US equities opened little changed, as the calendar gave little incentives to traders to take positions. European equities trade with minor losses in an uneventful session.
Chicago Fed Evans defended last week's rate hike and expects two more hikes this year. He added the economy was on a pretty good course, labour market has been strong and the Fed is a little more confident inflation is moving up. Fiscal policy could provide an important lift to inflation.
Philly Fed governor Harker would not rule out a faster or slower pace of hikes in 2017 than three that he's projected in his quarterly forecast, but he hasn't yet factored in fiscal policy. He expects balance tapering to start when rates are between 1% and 1.5%.
The ECB has urged Brussels to toughen up its sanctions procedure against governments who persistently fall foul of its economic rules. It noted that over 90% of reform recommendations had been ignored by member states in 2016.
UK PM May will file divorce papers to leave the European Union on March 29, launching two years of complex negotiations that will pit the U.K.'s need for a trade deal against the bloc's view that Britain shouldn't benefit from Brexit.
Oil prices slipped as the US trading day revved - up, with analysts focused on the sharp rise this year in American crude inventories. WTI, the US benchmark, declined 1.4% to $48.12/barrel, while Brent crude dipped 0.9% to $51.3/barrel.
Rates
Bonds lingering in sideways range
In a thinly traded, data - poor and sentiment - driven session, core bonds traded sideways with German Bunds again slightly underperforming US Treasuries. At the time of writing, US yields trade nearly unchanged for the day (yield changes ranged between - 1.1 (2 - yr) and - 0.2 bp (30 - yr)), while German yields are slightly higher (yield changes between 1.1 bp (2 - yr) and +1.4 bps (30 - yr)). On intra EMU bond markets, 10 - yr yield spreads versus Germany range between +2 bps (Belgium, see below) and - 2 bps (Spain) with outperformance of Portugal ( - 4 bps, due to S&P decision to confirm rating?) and underperformance of Greece (+7 bps due to upcoming euro group?).
Intraday, the Bund opened marginally higher. A slight Asian risk off sentiment due to a disappointing G - 20 meeting suggested spill overs of the negative sentiment. However, those spill - overs didn't materialise. Equities opened lower but stabilized soon. Oil initially also held up well. The bond bears took the drivers' seat and the Bund slid gradual lower till the end of the morning session, ignoring another selling wave of oil (which largely reversed in early afternoon). The German curve slightly bear steepened. The Belgian and Slovak bond auctions went well, but as usually didn't affect the overall market. US Treasuries did nothing worth mentioning in the European morning trade and in early US dealings. Fed speakers' comments were also unable to trigger action.
Chicago Fed Evans, 2017 voter, said the Fed is on pace for two more rate hikes in 2017. He added the economy was on a pretty good course, labour market has been strong and the Fed is a little more confident inflation is moving up. Fiscal policy could provide an important lift to inflation, according to Evans. Minneapolis Kaskhari, in an interview, largely repeated his arguments why he dissented at last week's FOMC meeting. Most important, he wants to taper the balance sheet before raising rates. Philly Fed Harker, 2017 FOMC voter, defended last week's rate hike and said he can't rule out more than 3 rate hikes this year, but at the March dot - plot he put 3 dots. Confidence has to translate into action. He added that the Fed hasn't factored in fiscal policy as details are needed.
The Belgian Debt Agency sold €3.2B of its 2027, 2038 and 2041 OLO's. Average yields amounted to 0.933%, 1.591% and 1.64% respectively. Despite its expensiveness versus peers like France, Ireland and Slovakia, the auction went well and the maximum targeted amount was sold. Interestingly, the appetite of investors for the longer 2038 and 2041 OLO's (€1.6B) was very good. The good interest in the new benchmark 10 - year was less of a surprise. The bid/covers of 1.62 and 1.6 for the long maturities was strong given the amounts sold. Given the thinness of the market today, there was some minor price concession in the aftermath of the auction. Slovakia attracted also strong demand for its 0% 2023 and 3.375% 2027 bond auction. It sold €285.4 M of both bonds with bid/covers of 3.75 and 2.84..

Currencies
Dollar correction slows in uneventful trading session
Today, in technical trading deprived of any important news, the post - Fed setback of the dollar petered out. However, it's too early to conclude that a sustained bottoming has started. EUR/USD is changing hands in the 1.0750 area. USD/JPY trades around 112.60/65.
Overnight, Asian equities traded with a slight risk - off bias. This was at least partially due to investors disappointment as the G20 communiqué didn't say anymore that the group intends to avoid all forms of protectionism. USD/JPY remained under pressure from ongoing overall USD weakness and traded in the 112.60 area, near the lowest level this month. EUR/USD hovered in the 1.0765 area, within reach of the post - Fed top (1.0782).
Trading on European markets, including FX trading, showed very little dynamics. There were no market moving data. The 'usual links' between markets were again very loose. European equities opened in negative territory, but there were limited follow - through losses. Core European yields rose minimal and the interest rate differential between US and German bonds narrowed marginally. However, there were no additional USD losses. USD/JPY even 'rebounded' off the post - Fed low and returned to the 112.80 area. EUR/USD reversed a strong open and drifted back to the 1.0750/65 area.
There was still no high profile news at the start of the US trading session. US equities also opened marginally lower, capping any further USD gains. Fed governors Evans, Kashkari and Harker gave divergent signals. EUR/USD trades currently at 1.0750/55. USD/JPY is changing hands around 112.70/75. So, the dollar didn't lose further ground after last week's post - Fed correction. However, with no news and given the narrow range of today price action, it's too early to draw any firm conclusions.

Sterling losing a few ticks on Brexit announcement
Overnight, the Rightmove House prices were decent at 1.3% M/M and 2.3% Y/Y. Sterling trading was in the first place driven by technical considerations. Even so, the housing report maybe supported the cautiously positive momentum of sterling at the start of the European session. Sterling gained a few ticks against the euro and the dollar, but trading was confined to tight ranges. Around noon, a spokesman of UK PM May announced that the UK will trigger article 50 of the Lisbon treaty on March 29. The move was no surprise. Even so, sterling reversed the intraday gains against the euro and the dollar as investors realize that a period of heightened political uncertainty might be on the horizon. EUR/GBP trades currently in the 0.8680 area. Cable is again changing hands just below 1.24.

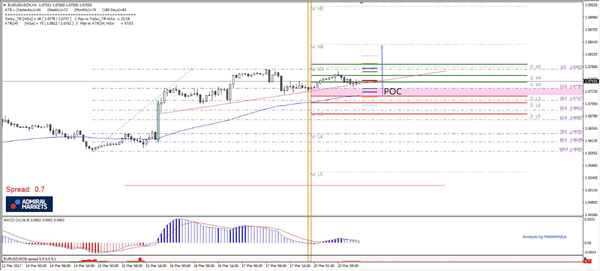
EUR/USD Bullish Switch on Short Term Trend
The US is on track for 3 hikes this year, and a few more in following years, but there were mentions during previous week that the ECB too may shift to normalising rates also in due time, so at this point we see a possible change in direction on this pair. The POC zone 1.0725-40 (L3, trend line, EMA 89, ATR pivot 23.6) and if 1.0670 stays strong we might see 1.0800 and 1.0840. The uptrend has been established by strong momentum candle (highlighted in green) and it seems we might see a continuation. Watch for any rejections from POC and break of 1.0780 if it happens short term.
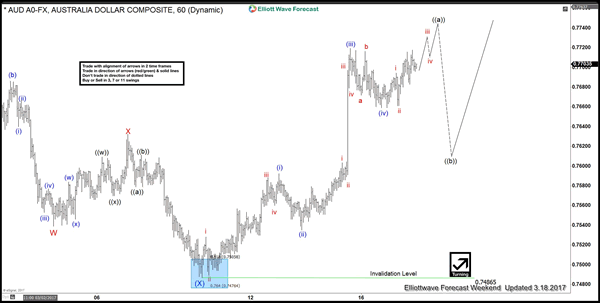
AUDUSD Elliott Wave View : 5 Waves Move
AUDUSD ended the correction in Intermediate wave (X) after reaching 0.7486 and then started rallying from there. With today's new high the pair is showing 5 waves impulsive move from 03/09/2017 low and has already reached the minimum target area for Minutte wave (v) to end. The minimum target for Minutte wave (v) can be calculated as the inverse 1.236-1.618 Fibonacci extension of Minutte wave (iv) which comes at 0.7734 - .07753. Short term, an extension higher can't be ruled out as there are still 2 other methods for calculating the 5th wave and one method of calculating (v) = (i) gives us a higher target around the equal legs area at 0.7765 - 0.7790. However, we need to be aware that cycle from 3/9 low (0.7486) is mature and pair can complete Minute wave ((a)) any moment and then start Minute wave ((b)) pullback in 3 , 7 or 11 swing to correct cycle from 3/9 low. After ending at least 3 waves pullback in Minute wave ((b)), we expect AUDUSD to find buyers for the next leg higher as it has a bullish sequence from December 2016 low due to breaking above 02/23/2017 high (0.7740).
AUDUSD 1 H Chart
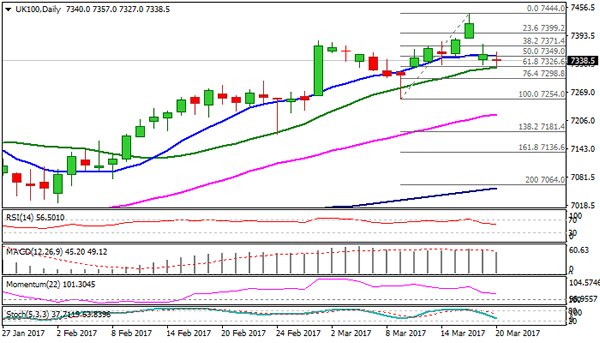
FTSE Remains at the Back Foot
FTSE remains at the back foot on Monday, after opening lower last Friday and being unable to fill the gap (Friday's recovery attempts were capped at 7374).
Early Monday's trading is directionless, holding within 30-pips range and so far supported by Fibo support at 7326 (61.8% of 7254/7444 upleg, reinforced by rising 20SMA).
This marks pivotal support and firm break lower would increase risk of return to correction low at 7254.
However, extended consolidation could be anticipated while the latter support holds, with fresh upside attempts to remain in play, as overall picture is bullish.
Return above 7400 handle is needed to signal an end of pullback from 7744 (fresh record high, posted on 16 Mar) and shift near-term focus higher.
Res: 7357; 7374; 7398; 7424
Sup: 7326; 7309; 7298; 7254
Canadian Dollar Edges Higher as Wholesales Sales Sparkle
USD/CAD has edged higher in the Monday session. In North American trade, the pair is trading at 1.3360. On the release front, Canadian Wholesale Sales jumped 3.3%, crushing the estimate of 0.3%. In the US, there are no economic events on the schedule. President Trump will speak at an event in Louisville, Kentucky. As well, FOMC member Charles Evans will deliver a speech in New York City. On Tuesday, Canada releases retail sales reports.
The Federal Reserve raised rates by a quarter-point last week, but the US dollar responded with broad losses. The Canadian dollar took advantage, gaining 1 percent last week. Why the negative reaction from the greenback? Firstly, there was disappointment in the markets with the Fed policy statement, which was more dovish than expected. The rate move was priced in at over 90 percent, and there had been speculation that a red-hot US economy would propel the Fed to accelerate its pace of monetary tightening, with possibly four rate hikes this year. Instead, Fed Chair Janet Yellen reiterated that further rate hikes would be "gradual" and the Fed made no changes to its "dot plot", with a projection for three rate hikes in 2017. As well, the US dollar may have lost ground due to traders and investors acting on "buy on rumor, sell on fact".
What's next for Janet Yellen & Co? Analysts do not expect another rate move in May, while a hike in June is currently priced in at 50%. The markets will be looking for clues about the Fed's monetary plans. A host of FOMC members will be speaking this weak, highlighted by Janet Yellen's speech on Thursday at an event in Washington. The market will be looking for clues regarding monetary policy. In the past, Fed policymakers have presented conflicting positions, and if the market senses divisions within the Fed, the US dollar could lose ground.
Sterling Pressured after Article 50 Date Confirmed
Dollar weakness has encouraged bullish investors to elevate the Sterling/Dollar to a fresh three-week high at 1.2436 during Monday's trading session. Although the emergence of a lone BoE hawk last week coupled with concerns about rising inflation has provided Sterling a boost, investors should be under no illusion that this has changed the bearish sentiment. With recent reports confirming that Theresa May will be triggering Article 50 on the 29th of March already sparking jitters, Sterling may be in-store for some serious punishment this week. It is becoming clear that the Brexit developments are likely to dictate where Sterling trades in the medium to longer term with uncertainty effectively limiting any extreme upside gains. From a technical standpoint, Sterling bears may re-enter the scene back below 1.2300.
Risk sentiment dented by protectionist fears
Stock markets were under noticeable pressure during Monday's trading session with risk appetite absent after the G20 decided to drop a pledge to avoid trade protectionism. Asian shares concluded mostly mixed amid the sluggish trading mood while risk aversion exposed European equities to downside losses. Although Wall Street limped into gains last week, further upside may be limited this evening as the renewed protectionism concerns keep investors on edge. With major finance leaders from the largest economies in the world failing to persuade the US to renew an anti-protectionism pledge, the growing threat of a potential global trade war may create serious headwinds for this phenomenal stock market rally.
Dollar Index levitates above 100.00
The lingering impacts of last week's "dovish hike" can still be seen on the Greenback which remains on the back foot as of writing. Although sellers have exploited the disappointment from the Fed's less than hawkish stance to attack the Dollar Index repeatedly, the downside may be limited as sentiment improves towards the U.S economy. Investors may pay extra attention to the string of speeches from Fed officials this week which could offer further clarity on interest rate hike timings this year. A hawkish surprise could install Dollar bullish investors with enough inspiration to send prices back towards 101.00.
From a technical standpoint, the Dollar Index remains heavily pressured on the daily charts. The 100.00 psychological support remains a key level which could protect the bulls or assist the bears.
Commodity spotlight - WTI Oil
WTI Crude found itself vulnerable to heavy losses on Monday with prices sinking towards $48 as the rising drilling activity in the U.S reinforced the oversupply fears. Sentiment remains bearish towards oil and the fading optimism over the effectiveness of OPEC's supply cut deal could encourage sellers to attack prices further. Although OPEC's inability to balance the oil markets in the first half of 2017 has sparked speculations of the organization extending its six-month contract, the rise of U.S shale and lingering concerns of some members not fully following the compliance in cutting production could create headwinds.
From a technical standpoint, WTI Crude is heavily pressured on the daily charts and a break below $48 could open a path lower towards $47.
Sterling Dips Mildly as UK PM May Will Trigger Brexit on March 29
Sterling dips broadly today but loss is limited. UK Prime Minister Theresa May's spokesman James Slack said that Article 50 on Brexit will be triggered next Wednesday on March 29. And, UK representative to EU Tim Barrow has already informed European Council President Donald Tusk of the plan. Slack also noted that "after we trigger, the 27 will agree their guidelines for negotiations and the Commission's negotiating mandate." And, "President Tusk has said he expects an initial response within 48 hours. We want negotiations to start promptly." Meanwhile, it's reported that UK and Germany are planning to sign a new defence pact after the trigger. German defence ministry confirmed that they are working on joint projects. And, the ministry emphasized that "independent of the effects of Brexit, Great Britain remains a strong partner and ally in Nato and also bilaterally."
Dollar mildly higher as Fed Evans open to 4 hikes this year
Dollar is trying to recover in early US session but momentum is weak so far. Chicago Fed President Charles Evans sounded hawkish in his comments today. He noted that he support three rate hike this year if the economic outlook holds. Meanwhile, depending on the developments, he is open to more or less rate increases. That is, he is open to four rate hikes this year. Meanwhile, he expects the economy to growth at 2.25% clip his year.
ECB Visco: Could Shorten the time between QE end and rate hike
ECB governing council member Ignzaio Visco said that the time between end of asset purchase and rate hike "could" be shortened. He said that "I cannot say that QE is somehow coming to an end, and at the same time that interest rates are being maintained at a low level." And, "it is a package, not single measures -- one by one -- that we'll discuss." But he emphasized that "the consistency between these various components is important," he said. "We have to be convinced that we are out of the low-inflation conditions that we have lived in in the last 3-4 years with one major consideration: that the risk of deflation seems to be really past." ECB governing council member Ewald Nowotny said last week that the central bank could raise interest rate before ending the quantitative easing program.
G20 dropped pledge on protectionism and climate change
In the communique released by the G20 countries during the weekend, they dropped the pledged to "avoid all forms of protectionism." Instead, they toned down to a much tamer version of "working to strengthen the contribution of trade to our economies." This is seen as a response to the protectionist approach of US president Donald Trump's administration. Yet, Trump didn't get the pledge to ensure "fair" trade neither. Meanwhile G20 also dropped the pledge on climate change. Regarding global recovery, G20 noted that "the pace of growth is still weaker than desirable and downside risks for the global economy remain. We reaffirm our commitment to international economic and financial cooperation."
On the data front...
Canada wholesale sales rose 3.3% mom in January. German PPI rose 0.2% mom, 3.1% yoy in February. . UK Rightmove house price rose 1.3% in March. New Zealand Westpac consumer confidence dropped to 111.9 in Q1. For the week ahead, RBA and BoJ will release meeting minutes. UK CPI could be a market moving data considering the hawkish BoE minutes last week. New Zealand will also face the test from trade balance. Meanwhile, Euro traders will look into Friday's PMIs.
- Monday: German PPI; Canada wholesale sales
- Tuesday: Australia house price, RBA minutes; UK CPI; Canada retail sales
- Wednesday: BOJ minutes; Japan trade balance; US house price index, existing home sales
- Thursday: RBNZ rate decision; German Gfk consumer sentiment; ECB bulletin; US jobless claims, new home sales
- Friday; New Zealand trade balance; Eurozone PMIs; Canada CPI; US durable goods orders
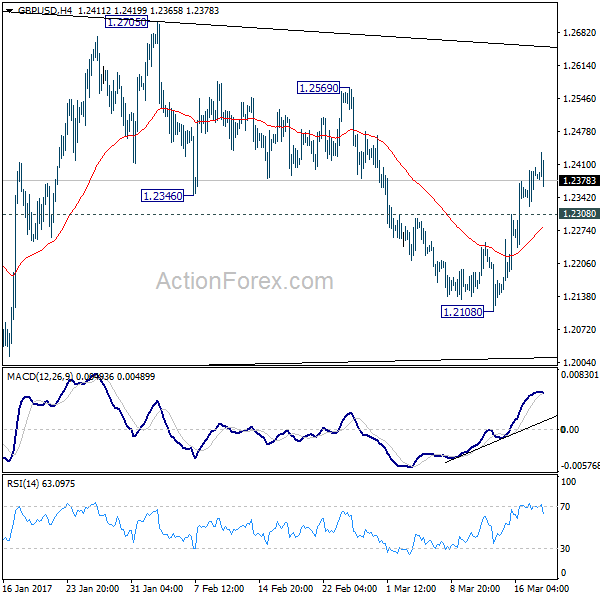
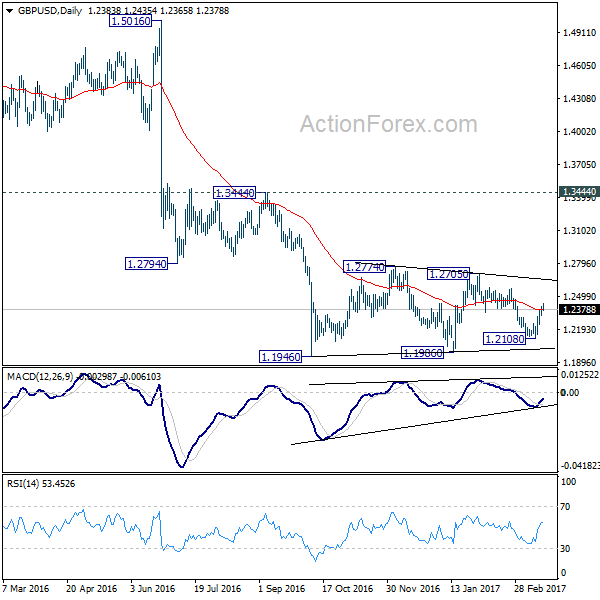
GBP/USD Mid-Day Outlook
Daily Pivots: (S1) 1.2342; (P) 1.2373; (R1) 1.2423; More...
GBP/USD edged higher to 1.2435 today but lost momentum. Nonetheless, with 1.2308 minor support intact, intraday bias remains on the upside for 1.2569 resistance. Consolidation pattern from 1.1946 is extending with another rising leg. And the larger down trend is not ready to resume yet. Break of 1.2569 will target .2705/74 resistance zone next. At this point, we'd expect strong resistance from 1.2705/2774 to limit upside to extend the sideway pattern. Break of 1.2308 minor support will turn bias back to the downside for 1.2108 support. Though, sustained break of 1.2774 will extend the rise towards 1.3444 key resistance level.
In the bigger picture, fall from 1.7190 is seen as part of the down trend from 2.1161. There is no sign of medium term bottoming yet. Sustained trading below 61.8% projection of 2.1161 to 1.3503 from 1.7190 at 1.2457 will target 100% projection at 0.9532. Overall, break of 1.3444 resistance is needed to confirm medium term bottoming. Otherwise, outlook will remain bearish.
Economic Indicators Update
| GMT | Ccy | Events | Actual | Forecast | Previous | Revised |
|---|---|---|---|---|---|---|
| 21:00 | NZD | Westpac Consumer Confidence Q1 | 111.9 | 113.1 | ||
| 00:01 | GBP | Rightmove House Prices M/M Mar | 1.30% | 2.00% | ||
| 07:00 | EUR | German PPI M/M Feb | 0.20% | 0.40% | 0.70% | |
| 07:00 | EUR | German PPI Y/Y Feb | 3.10% | 3.20% | 2.40% | |
| 12:30 | CAD | Wholesale Sales M/M Jan | 3.30% | 0.40% | 0.70% | 0.30% |
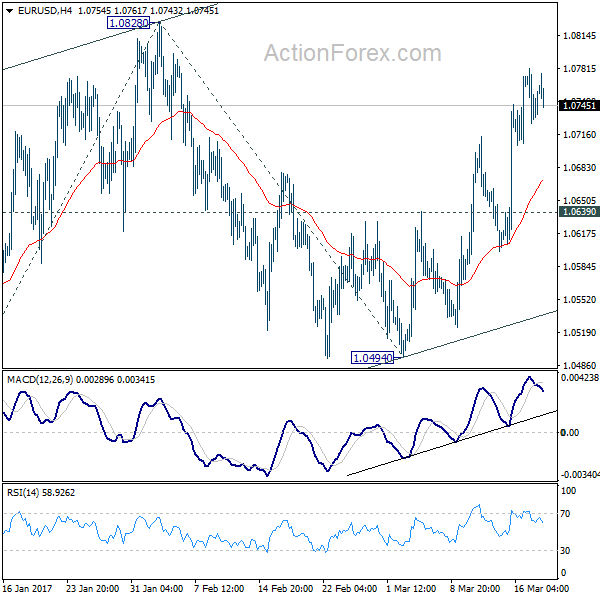
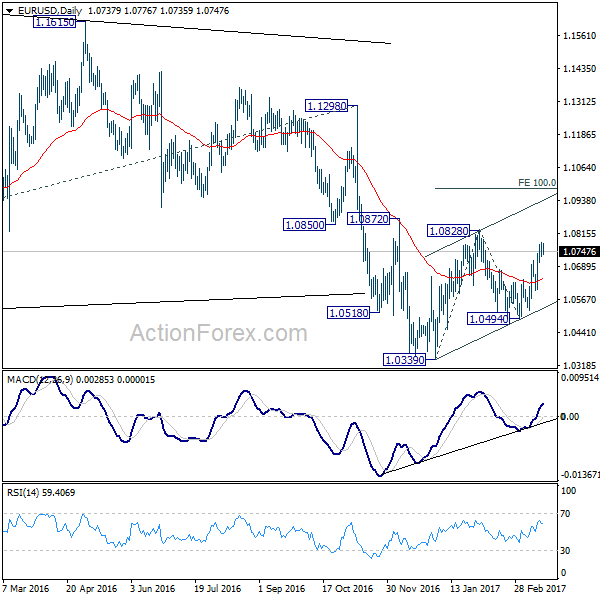
EUR/USD Mid-Day Outlook
Daily Pivots: (S1) 1.0715; (P) 1.0748 (R1) 1.0770; More.....
Further rise is expected in EUR/USD for 1.0828 resistance, with 1.0639 minor support intact. Corrective rise from 1.0339 is still in progress and break of 1.0828 will target 100% projection of 1.0339 to 1.0828 from 1.0494 at 1.0983. Since such rise is viewed as a corrective move, we'd expect upside to be limited by 1.0983 to bring larger down trend resumption eventually. On the downside, break of 1.0639 minor support will turn bias back to the downside for 1.0494 support.
In the bigger picture, as long as 1.1298 key resistance holds, whole down trend from 1.6039 (2008 high) is still expected to continue. Break of 1.0339 low will send EUR/USD through parity to 61.8% projection of 1.3993 to 1.0461 from 1.1298 at 0.9115.
GBP/USD Mid-Day Outlook
Daily Pivots: (S1) 1.2342; (P) 1.2373; (R1) 1.2423; More...
GBP/USD edged higher to 1.2435 today but lost momentum. Nonetheless, with 1.2308 minor support intact, intraday bias remains on the upside for 1.2569 resistance. Consolidation pattern from 1.1946 is extending with another rising leg. And the larger down trend is not ready to resume yet. Break of 1.2569 will target .2705/74 resistance zone next. At this point, we'd expect strong resistance from 1.2705/2774 to limit upside to extend the sideway pattern. Break of 1.2308 minor support will turn bias back to the downside for 1.2108 support. Though, sustained break of 1.2774 will extend the rise towards 1.3444 key resistance level.
In the bigger picture, fall from 1.7190 is seen as part of the down trend from 2.1161. There is no sign of medium term bottoming yet. Sustained trading below 61.8% projection of 2.1161 to 1.3503 from 1.7190 at 1.2457 will target 100% projection at 0.9532. Overall, break of 1.3444 resistance is needed to confirm medium term bottoming. Otherwise, outlook will remain bearish.
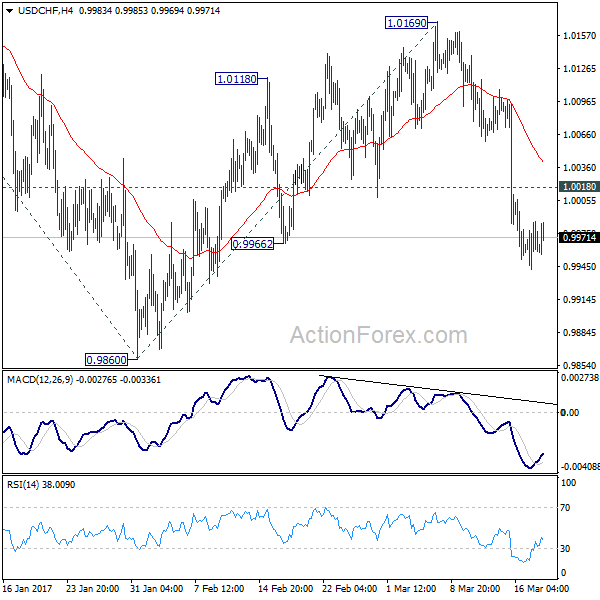
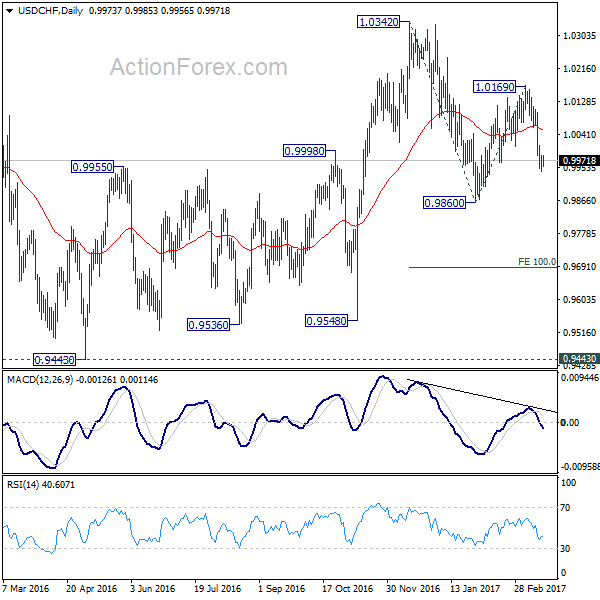
USD/CHF Mid-Day Outlook
Daily Pivots: (S1) 0.9951; (P) 0.9969; (R1) 0.9995; More.....
With 1.0018 minor resistance intact, intraday bias remains downside in USD/CHF for 0.9860 support. Recovery from 0.9860 has completed at 1.0169 and whole decline from 1.0342 is likely resuming. Break of 0.9860 will target 100% projection of 1.0342 to 0.9860 from 1.0169 at 0.9687. On the upside, above 1.0018 minor resistance will turn bias neutral. But outlook will now stay bearish as long as 1.0169 resistance holds.
In the bigger picture, USD/CHF is staying in medium term sideway pattern between 0.9443/1.0342. In any case, decisive break of 1.0342 resistance is needed to confirm underlying strength. Otherwise, we'll stay neutral in the pair first. In case of another fall, we'd expect strong support from 0.9443/9548 support zone.